
Abstract
BACKGROUND: Visually Accessible Rembrandt (Repository for Molecular Brain Neoplasia Data) Images (VASARI) features, a vocabulary to establish reproducible terminology for glioma reporting, have been applied for a decade, but a systematic performance evaluation is lacking.
PURPOSE: Our aim was to conduct a systematic review and meta-analysis of the performance of the VASARI features set for glioma assessment.
DATA SOURCES: MEDLINE, Web of Science, EMBASE, and the Cochrane Library were systematically searched until September 26, 2023.
STUDY SELECTION: Original articles predicting diagnosis, progression, and survival in patients with glioma were included.
DATA ANALYSIS: The modified Quality Assessment of Diagnostic Accuracy Studies-2 (QUADAS-2) tool was applied to evaluate the risk-of-bias. The meta-analysis used a random effects model and forest plot visualizations, if ≥5 comparable studies with a low or medium risk of bias were provided.
DATA SYNTHESIS: Thirty-five studies (3304 patients) were included. Risk-of-bias scores were medium (n = 33) and low (n = 2). Recurring objectives were overall survival (n = 18) and isocitrate dehydrogenase mutation (IDH; n = 12) prediction. Progression-free survival was examined in 7 studies. In 4 studies (glioblastoma n = 2, grade 2/3 glioma n = 1, grade 3 glioma n = 1), a significant association was found between progression-free survival and single VASARI features. The single features predicting overall survival with the highest pooled hazard ratios were multifocality (hazard ratio = 1.80; 95%-CI, 1.21–2.67; I2 = 53%), ependymal invasion (hazard ratio = 1.73; 95% CI, 1.45–2.05; I2 = 0%), and enhancing tumor crossing the midline (hazard ratio = 2.08; 95% CI, 1.35–3.18; I2 = 52%). IDH mutation-predicting models combining VASARI features rendered a pooled area under the receiver operating characteristic curve of 0.82 (95% CI, 0.76–0.88) at considerable heterogeneity (I2 = 100%). Combined input models using VASARI plus clinical and/or radiomics features outperformed single data-type models in all relevant studies (n = 17).
LIMITATIONS: Studies were heterogeneously designed and often with a small sample size. Several studies used The Cancer Imaging Archive database, with likely overlapping cohorts. The meta-analysis for IDH was limited due to a high study heterogeneity.
CONCLUSIONS: Some VASARI features perform well in predicting overall survival and IDH mutation status, but combined models outperform single features. More studies with less heterogeneity are needed to increase the evidence level.
ABBREVIATIONS:
- AUC
- area under the receiver operating characteristic curve
- HR
- hazard ratio
- IDH
- isocitrate dehydrogenase
- OS
- overall survival
- VASARI
- Visually Accessible Rembrandt [Repository for Molecular Brain Neoplasia Data] Images
SUMMARY
PREVIOUS LITERATURE:
The VASARI feature set for standardized glioma reporting has been applied by numerous studies to address different research questions. Applications range from human radiologic evaluations by using single features to multivariable machine-learning approaches. Clinical research questions encompass glioma subtype discrimination and noninvasive image-based survival prediction. Prediction of overall survival and IDH mutation status was among the most explored research questions. Several studies have identified multifocality, ependymal invasion, and enhancing tumor crossing the midline as unfavorable overall survival predictors. Enhancement quality, proportion of enhancing tumor, proportion of necrosis, and proportion of edema were identified as the main indicators of IDH mutation status.
KEY FINDINGS:
This meta-analysis identified three robust VASARI features (multifocality, ependymal invasion, enhancing tumor crossing midline) to predict overall survival. Meta-analysis for IDH-predicting models showed a pooled AUC of 0.82 with considerable heterogeneity between studies. Combined models, including VASARI features next to clinical, genomics, radiomics features, usually outperformed VASARI-only models.
KNOWLEDGE ADVANCEMENT:
Future studies should adhere to the original VASARI scoring definitions to minimize between-study heterogeneity. Given the time-consuming nature of manual extraction, it is crucial to develop automatic extraction technology. Reducing the feature set to the most promising ones can decrease the workload when radiologist input is required.
MRI is the essential pillar of preoperative glioma diagnosis and later therapy assessment. While there is consensus regarding a standardized neuro-oncologic imaging protocol,1 reporting of image aspects of glioma (radiophenotype) is less standardized. Criteria, as defined by Response Assessment in Neuro-Oncology (RANO 2.0),2 comprise only limited standards relying on quantitative measurements dedicated to the follow-up setting. In a study setting, however, a controlled reporting vocabulary is needed to identify reproducible imaging glioma biomarkers or generate data input suitable for artificial intelligence approaches.
Approximately a decade ago, The Cancer Genome Atlas project of the National Cancer Institute addressed this problem by suggesting a controlled vocabulary for glioma imaging called Visually Accessible Rembrandt (Repository for Molecular Brain Neoplasia Data) Images (VASARI).3 The VASARI set combines different MRI features (Online Supplemental Data), such as enhancement pattern and tumor location. A consensus group defined the features on the basis of expert opinion and literature. The VASARI project incorporated standard MRI sequences, including DWI, but excluded advanced imaging techniques like PWI. The current set comprises 30 semantic features, 3 of which apply to postoperative situations. All features are rated on the basis of scoring systems (Online Supplemental Data).
Numerous studies have applied the VASARI set since its proposal.4⇓⇓⇓⇓⇓⇓⇓⇓⇓⇓⇓⇓⇓⇓⇓⇓⇓⇓⇓⇓⇓⇓⇓⇓⇓⇓⇓⇓⇓⇓⇓⇓⇓-38 Applications range from human radiologic evaluations using single features5⇓⇓-8 to multivariable machine learning approaches.21,27⇓-29 Clinical research questions cover glioma subtype discrimination13,14,16,17 and noninvasive image-based survival prediction.7,10,13,22 Various VASARI features were identified as prognostic factors, including tumor location, involvement of eloquent brain areas, ependymal or pial invasion, as well as diagnostic indicators, such as the definition of the enhancing margin and the proportion of necrotic or enhancing tumor, in these studies. However, these applications have never been systematically evaluated, perhaps explaining why using the VASARI features set is not recommended by any clinical or scientific guideline. Because complete feature rating is time-consuming, a critical analysis identifying the most powerful features and models is pivotal for future study designs and potential clinical use. Recent, however not VASARI-centered, publications indicated pial and subependymal invasion (features 18 and 19) as negative for survival.39 A meta-analysis may confirm the hypothesis of features 18 and 19 as particularly promising predictive VASARI features.
This systematic review and meta-analysis aimed to gauge the performance of the VASARI set for glioma evaluation to identify a subset of the most diagnostic and prognostic predictive features to warrant use in trials or even clinically.
Materials and Methods
This study was registered in PROSPERO (ID for the published protocol: CRD42023392548) and was conducted according to Preferred Reporting Items for Systematic Review and Meta-Analysis (PRISMA).40 The research question was “What is the VASARI features’ performance in predicting diagnosis, progression, and survival in patients with glial tumors?” using the participants, index tests, and target conditions criteria.41
Data Sources and Screening Step
The search string had 2 components: VASARI and tumor types, including high-grade and low-grade oligodendroglioma, astrocytoma, and glioblastoma. Inclusion criteria were the following: 1) participants: adult or pediatric patients with glial tumors; 2) intervention/index test: human or automated methods using multiparametric conventional MRI as a source for VASARI; 3) comparison: standard interpretation of images with or without VASARI; 4) outcomes: prediction of the diagnosis, including histologic tumor grades and certain well-known mutations (isocitrate dehydrogenase [IDH], 1p/19q codeletion, telomerase reverse transcriptase promoter, and O[6]-methylguanine-DNA methyltransferase methylation status), progression, or survival; and 5) study design: original articles with a retrospective or prospective design.
Exclusion criteria were the following: 1) studies not performed on living humans; 2) studies with <10 participants (considered case series); 3) studies exclusively predicting other genetic/molecular alterations than indicated in the inclusion criteria; 4) non-peer-reviewed journals, conference abstracts, review papers, preprints; and 5) publications not in English.
A database search was performed on September 26, 2023, using MEDLINE (PubMed), the Web of Science, EMBASE, and the Cochrane Library. The search protocol is presented as Online Supplemental Data. One author screened the titles and abstracts (A.A., 7 years of radiology experience) for inclusion criteria after excluding duplicates using rayyan software (https://rayyan.ai/reviews). Additionally, the reference lists of included articles were screened by title and abstract (hand search). Uncertain cases were evaluated in consultation with another author (V.C.K., 11 years of neuroradiology experience).
Data Extraction
To guarantee identical rating standards, we used 5 studies to pilot the extraction process by 2 authors (A.A., V.C.K.). Two authors then performed data extraction for the remaining studies (A.A., for radiologic content, and Y.P., a second-year PhD student in neuroscience with expertise in statistics). The Online Supplemental Data list the data-extraction components.
Systematic Review Quality Assessment
The quality of each study was evaluated by 2 authors (A.A., V.C.K.) using the modified Quality Assessment of Diagnostic Accuracy Studies-2 (QUADAS-2; https://www.bristol.ac.uk/population-health-sciences/projects/quadas/quadas-2/) tool,42 encompassing 5 domains for assessing the risk of bias and 3 domains for evaluating applicability concerns (Online Supplemental Data). Discrepancies were resolved by consensus. Five studies, also used to pilot data extraction, were piloted for quality control assessment to identify systematic discrepancies in QUADAS-2 tool use.
Meta-Analysis and Statistics
Studies examining patient cohorts with a similar tumor type, statistical models with comparable inputs, and reported identical end points of interest were grouped. The availability of ≥5 studies with most QUADAS-2 categories scoring low or medium risk of bias was the liberal minimum for a meta-analysis. Otherwise, a narrative synthesis summarized the findings. If studies with overlapping cohorts were available, the total sample size was determined by including the largest cohort from overlapping studies (Online Supplemental Data). In case of missing data, other reported metrics (standard errors, sample sizes)43 served to derive parameters when feasible. Alternatively, corresponding authors were contacted and requested to provide supplementary information. Meta-analyses were conducted in R (Version 4.3.0.; http://www.r-project.org/) using generic inverse-variance and random effect models to account for methodologic between-study heterogeneity. To mitigate interpretability concerns arising from potential collinearity within VASARI data sets, the meta-analysis of hazard ratios (HRs) used metrics derived solely from univariable Cox proportional models. Heterogeneity was assessed with Higgins I2 statistics, considering values above 50% as significant heterogeneity. All tests were 2-sided. Because this is a meta-analysis, no correction was done for multiple testing. Forest plots were used to visualize results, complemented by pooled statistics with corresponding confidence and prediction intervals. The best-performing VASARI model was chosen if >1 model had been tested. The criteria for performance of meta-regression, sensitivity analysis, and nonreporting bias analysis were the availability of at least 10 studies to ensure the reliability of conclusions drawn from these analyses according to the Cochrane Handbook for Systematic Reviews of Interventions.44
Results
Overview
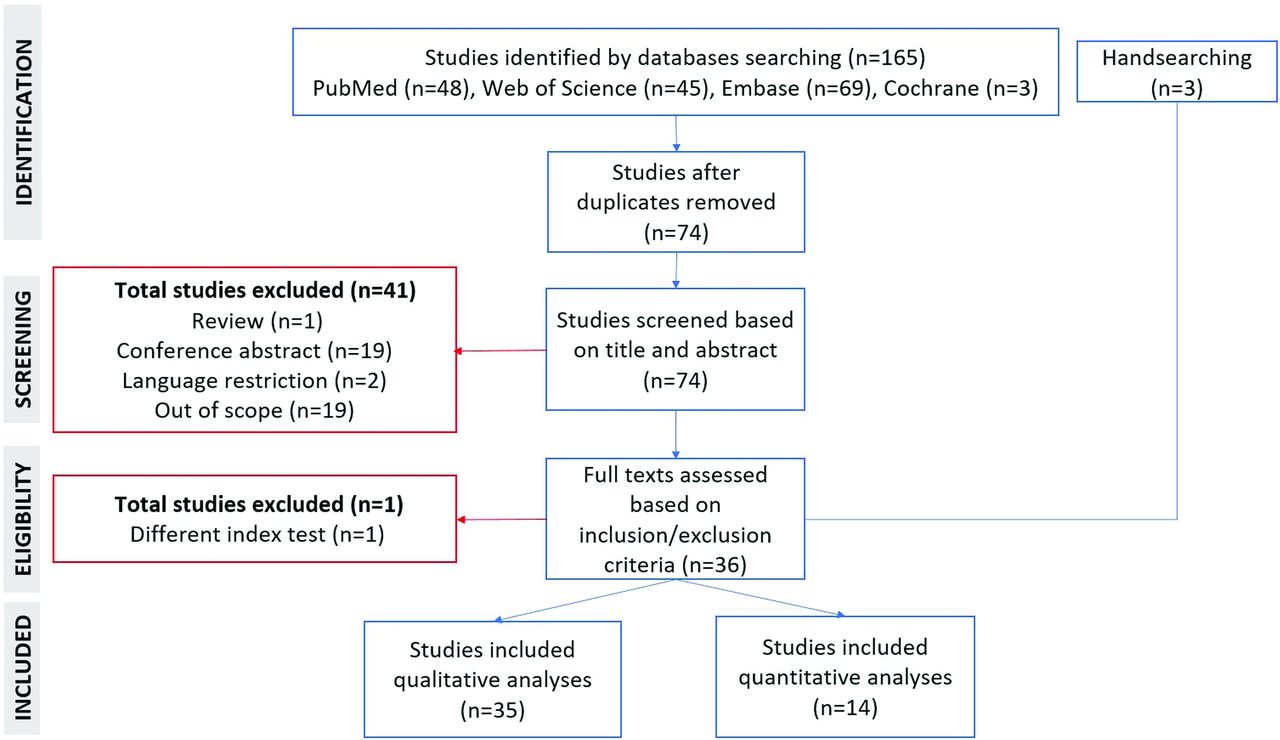
Figure 1 visualizes the literature selection. Thirty-five studies (29–335 patients) fulfilled the inclusion criteria (Online Supplemental Data). Eleven studies used The Cancer Imaging Archive cohort, possibly covering overlapping cohorts. The overlap-corrected number of recruited patients was 3304 (Online Supplemental Data). The overall risk-of-bias scores were medium (n = 33) and low (n = 2; Online Supplemental Data). Only 2 studies applied the 2021 World Health Organization Classification of Central Nervous System Tumors (WHO CNS 5)38 or reported IDH wild-type glioblastoma only.16 The remaining 33 studies explicitly used the 2016 or 2007 WHO CNS classifications (n = 519,22,26,27,30) or did not mention it (n = 284-15,17,18,20,21,23⇓–25,28,29,31⇓⇓⇓⇓⇓-37), resulting in applicability uncertainties regarding patient selection. One study38 was vague in the use of the reference standard.

PRISMA flow chart describing the literature-selection process.
Survival Prediction
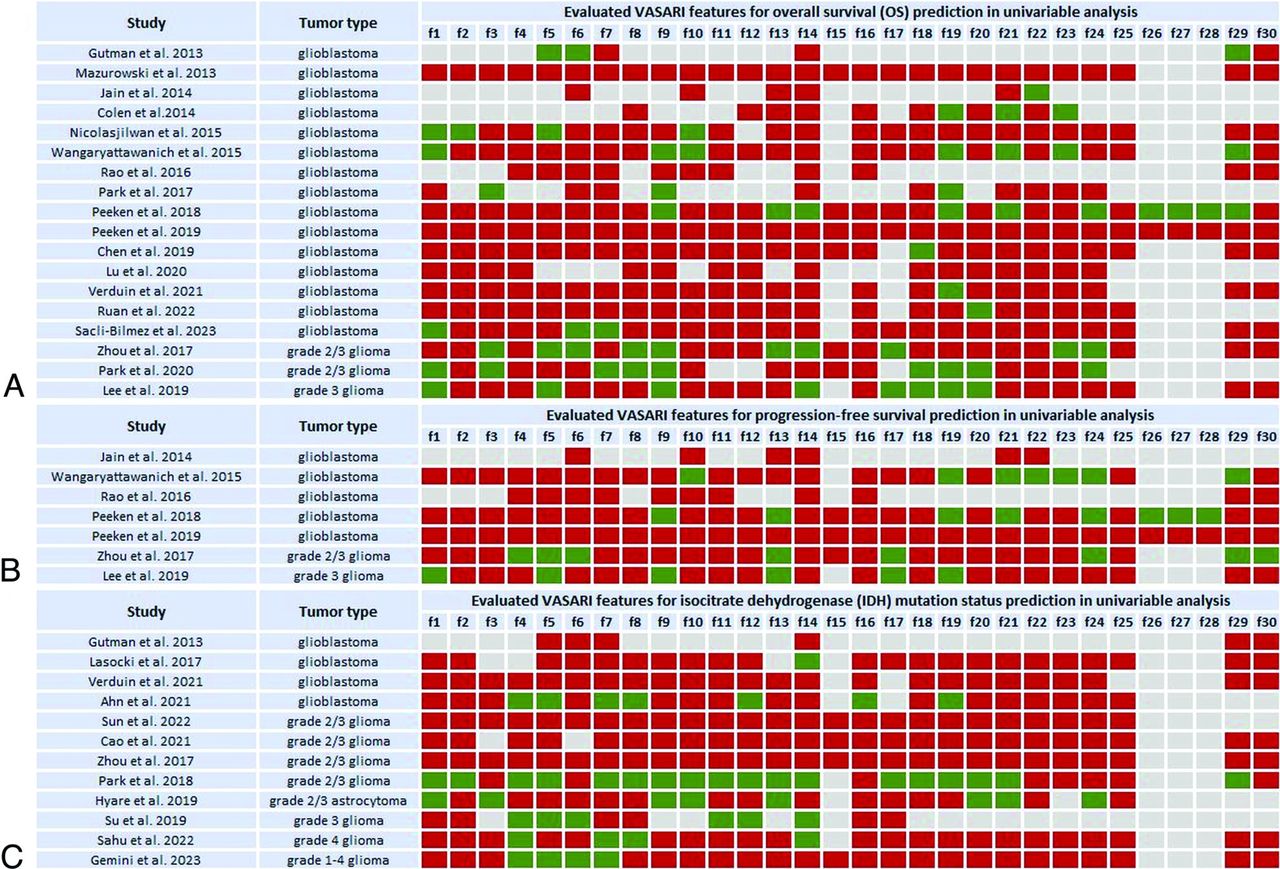
Fifteen4,5,7⇓⇓⇓-11,15,18,21,24,27,29,34,35 of 18 overall survival (OS)-predicting studies exclusively involved glioblastomas. Results for univariable analyses indicating the per-feature performance of the VASARI set are shown in Fig 2A. Eleven glioblastoma studies found a significant association between OS and different VASARI features.5,7⇓⇓-10,15,18,24,29,34,35 Comparing single-data-type models with only 1 input datum type (e.g., clinical, pathologic, FET-PET/CT, or genomics data), VASARI-based models outperformed others in 2 studies.21,27 However, a clinical model (age and Karnofsky performance status) slightly outperformed a VASARI-only model in the study by Peeken et al18 (C-indices = 0.64; 95% CI, 0.55–0.72 versus 0.66; 95% CI, 0.58–0.73). Compared with VASARI-only models, several studies9,15,18,21,27 stressed the superiority of predictive models trained on combined features, including VASARI plus clinical, genomics, treatment, and/or radiomics features. Peeken et al18 concluded that a combined model (VASARI, clinical, age, and Karnofsky performance status) and pathologic features (O[6]-methylguanine-DNA methyltransferase methylation) performed better than the VASARI-only model (C-indices = 0.72; 95% CI, 0.61–0.80 versus 0.64; 95% CI, 0.55-0.72). Mazurowski et al4 showed the added value of VASARI features (VASARI+clinical: area under the receiver operating characteristic curve [AUC] 0.81; 95% CI, 0.71–0.90; C-index= 0.69; 95% CI, 0.63–0.75) compared with clinical-only, including age, sex, and Karnofsky performance status (AUC = 0.62; 95% CI, 0.49–0.74; C-index 0.58; 95% CI, 0.50–0.66; both P < .01).

The association between different VASARI features and OS (A), progression-free survival (B), and IDH mutation status (C) listed per study involving glioblastoma and grades 1–4 glioma cohorts. Green indicates tested and significant feature; red, tested and nonsignificant feature or feature with statistical results not provided; gray, features not tested. The list of VASARI features and their detailed descriptions, along with respective scoring systems for each feature are in the Online Supplemental Data.
Three OS-predicting studies recruited grade 2 and 3 gliomas (Fig 2A). Zhou et al13 found a significant association between OS and 10 VASARI features in a univariable analysis of which only 1 feature, definition of the nonenhancing margin, was significant in multivariable analyses. They demonstrated that a well-defined nonenhancing margin correlated with longer OS than an ill-defined nonenhancing margin. Lee et al22 showed that the performance of clinical features (age, Karnofsky performance status, and extent of resection) plus molecular subtype (IDH mutation and 1p/19q codeletion status) model increased when extending it with VASARI features (C-indices = 0.84; 95% CI, 0.75–0.90 versus 0.91; 95% CI, 0.86–0.96). Similar results were found by Park et al,26 improving the integral AUC (initially 0.74; 95% CI, 0.69–0.81) of the clinical model (age, Karnofsky performance status, extent of resection, and histologic grade) by adding VASARI features (LASSO model 0.77; https://tullo.ch/articles/lasso-estimator; 95% CI, 0.74–0.85; elastic net model = 0.78; 95% CI, 0.74-0.85).
Glioblastoma was included in 5 of 7 progression-free survival predicting studies, with 2 studies10,18 showing a significant association with single VASARI features (Fig 2B). Peeken et al21 evaluated the performance of a combined model (VASARI plus clinical age, sex and Karnofsky performance status) plus pathologic (O[6]-methylguanine-DNA methyltransferase methylation, IDH mutation status, and Ki 67 proliferation index) showing superior performance compared with single-data-type models including their VASARI-only model (C-index validation set = 0.68; 95% CI, 0.57–0.78 versus 0.61; 95% CI, 0.50-0.72, P = .014, respectively). In that study, VASARI features showed the highest performance in the validation set among single-data-type models (C-index = 0.61; 95% CI, 0.50-0.72). They were also the dominant variable in the combined model (VASARI plus clinical plus pathologic features).
Two of 7 progression-free survival–predicting studies involved grade 2 and 313 or grade 3 gliomas22 (Fig 2B). Lee et al22 showed that adding VASARI features increased the performance of the combined model (clinical plus molecular) with C-indices = 0.79 (95% CI, 0.71-0.85) versus 0.84 (95% CI, 0.79–0.91).
IDH Mutation Status Prediction
Reported tumor entities were glioblastoma5,14,29,30 and grade 2 to 4 gliomas13,17,20,25,28,32,36,37 (Online Supplemental Data). Individually evaluated VASARI features are shown in Fig 2C. Five studies5,13,28,29,32 found no association between IDH mutation and individual VASARI features. Among other studies, the main features that were more consistently identified as significant predictors of IDH mutation status were enhancement quality (feature 4),17,20,30,36,37 proportion of enhancing tumor (feature 5),17,20,30,37 proportion of necrosis (feature 7),17,30,36,37 and proportion of edema (feature 14).14,17,20,36 There was a negative correlation between these features and the presence of an IDH mutation.
A higher performance of combined models was shown in several studies.13,20,28,32 Su et al20 showed that a VASARI model (using feature 6: proportion of nonenhancing tumor) outperformed the diffusion texture analysis model with an AUC of 0.92 (95% CI, 0.80–0.98 versus 0.72; 95% CI, 0.57-0.85). The proportion of nonenhancing tumor was significantly higher in IDH-mutant high-grade gliomas compared with IDH wild-type high-grade gliomas. However, the combined model (proportion of nonenhancing tumor plus ADC entropy) was the best-performing model (AUC = 0.95; 95% CI, 0.85–0.99). Sun et al32 determined an imaging model (VASARI features plus the T2 FLAIR mismatch sign) as the best single data-type model (AUC = 0.75; 95% CI, 0.60–0.89) in the test set.
Other Studies
Six studies predicted histologic tumor grade12,13,19,33,37,38 or further mutations (1p/19q codeletion, n = 3;13,17,32 O[6]-methylguanine-DNA methyltransferase methylation, n = 2;16,29 telomerase reverse transcriptase promoter, n = 316,23,30) or the presence of true progression (n = 3),6,13,31 respectively. The characteristics of these studies are summarized in the Online Supplemental Data.
Meta-Analysis
Survival Prediction.
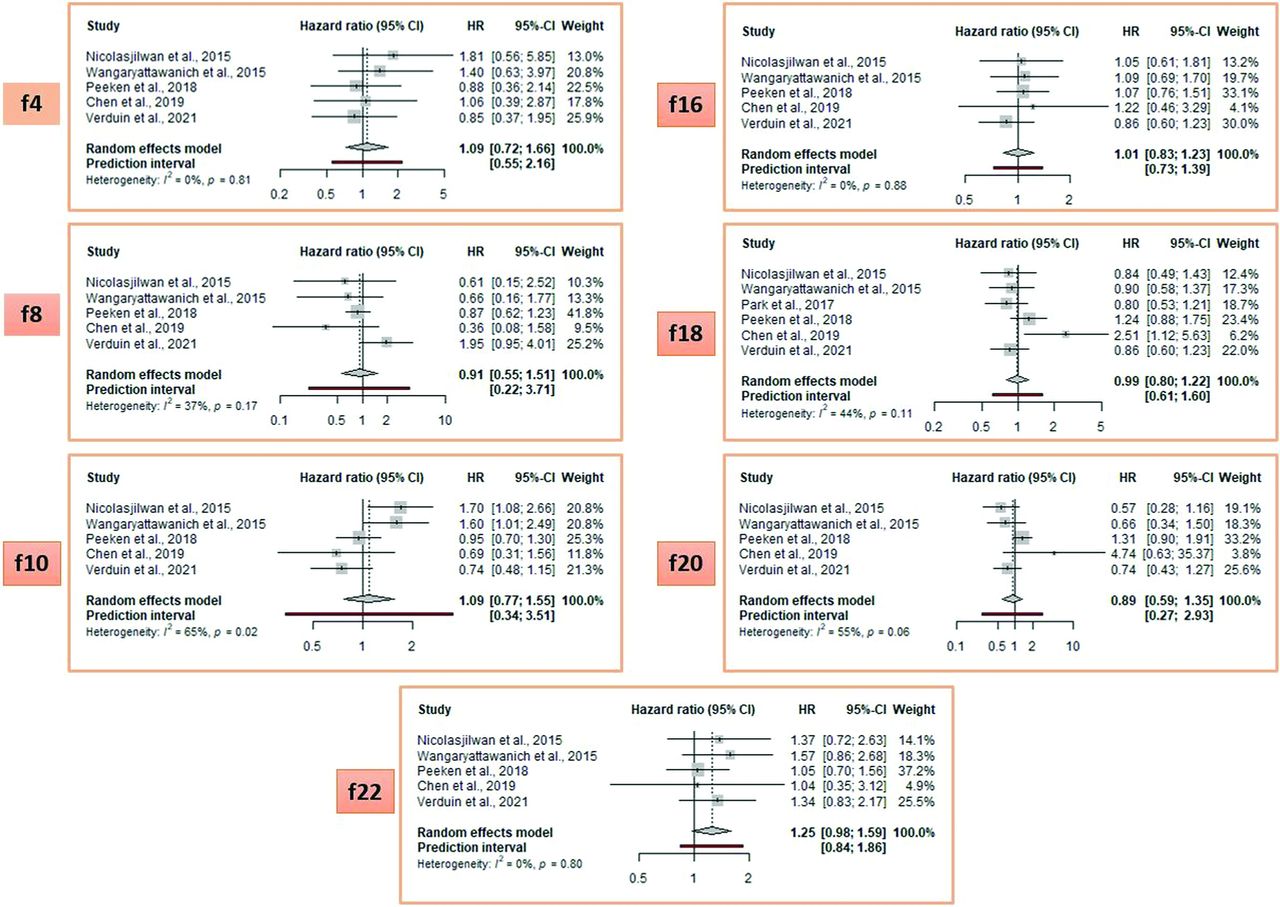
The meta-analysis of individual VASARI features to predict OS in glioblastoma studies identified 8 features with a HR above 1.25 (Fig 3; HR range = 1.32–2.08) and 7 equal to or below it (Fig 4; HR range = 0.89–1.25). The HR cutoff of 1.25 was arbitrarily defined for visual representation. Enhancing tumor crossing the midline (feature 23, pooled HR = 2.08; 95% CI, 1.35–3.18), multifocality (feature 9, pooled HR = 1.80; 95% CI, 1.21–2.67), and ependymal invasion (feature 19, pooled HR = 1.73; 95% CI, 1.45–2.05) were the strongest predictors.

Meta-analysis of OS-predicting studies with a pooled HR >1.25. Note that the list of VASARI features and their detailed descriptions, along with respective scoring systems for each feature are provided in Online Supplemental Data. f indicates VASARI feature; f3, eloquent brain; f9, multifocality; f11, thickness of enhancing margin; f13, definition of nonenhancing margin; f19, ependymal invasion; f21, deep white matter invasion; f23, enhancing tumor crosses the midline; f24, satellites.

Meta-analysis of OS-predicting studies with a pooled HR ≤ 1.25. Note that the list of VASARI features and their detailed descriptions, along with respective scoring systems for each feature are provided in the Online Supplemental Data. f indicates VASARI feature; f4, enhancement quality; f8, cysts; f10, T1/FLAIR ratio; f16, hemorrhage; f18,pial invasion; f20, cortical involvement; f22, nonenhancing tumor crosses midline.
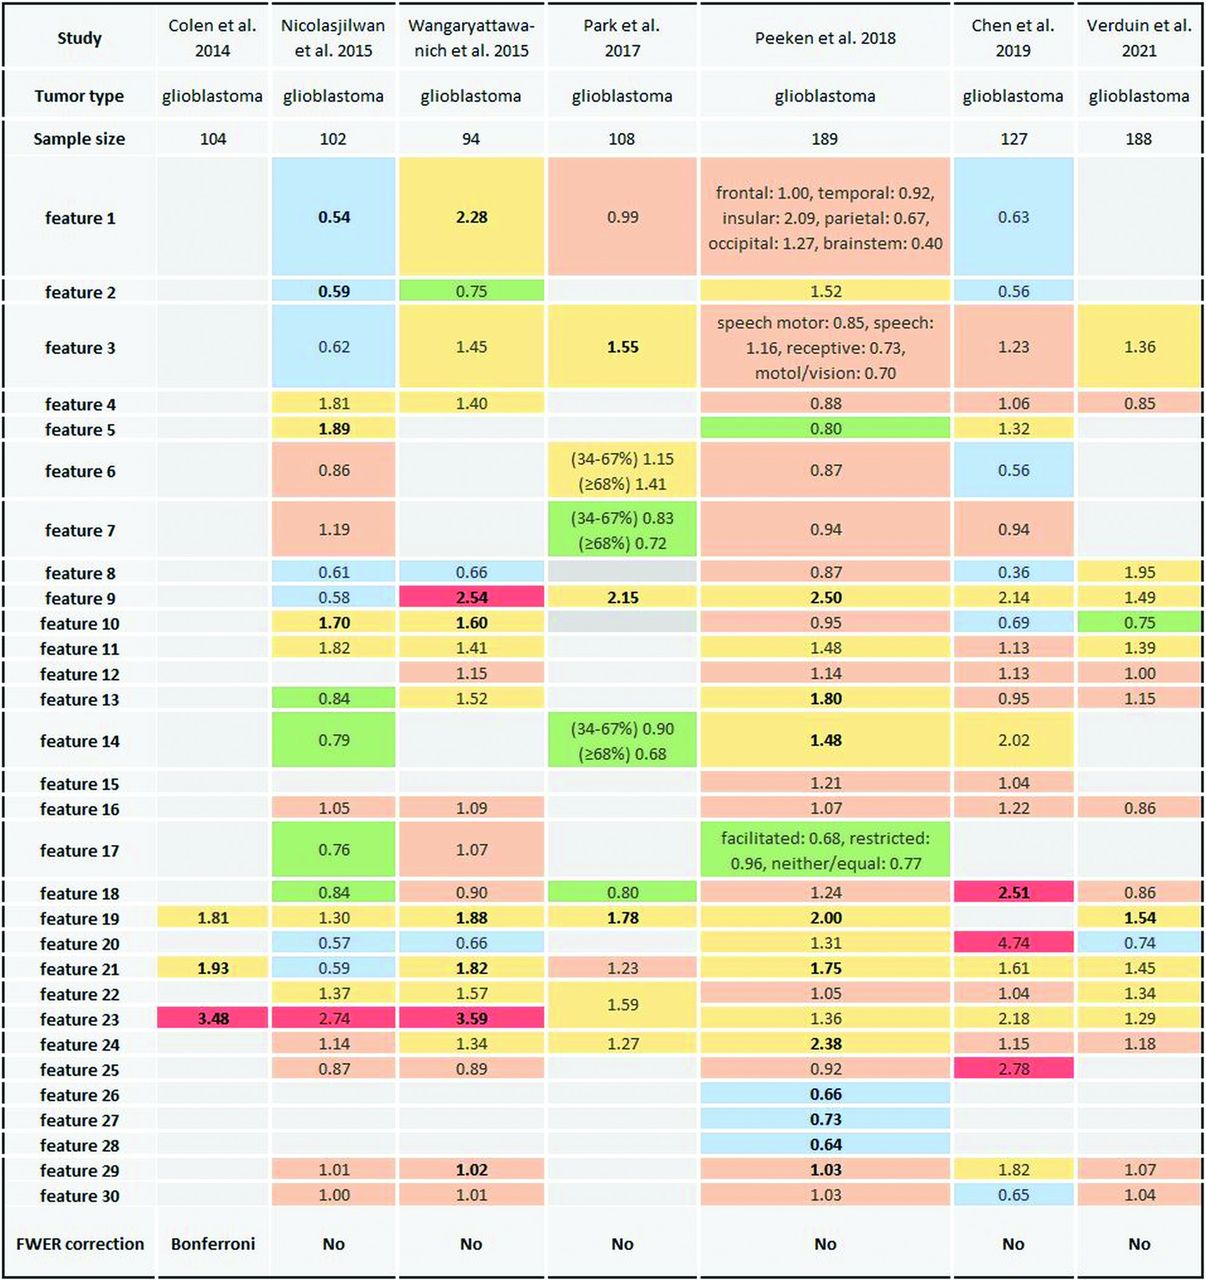
Figure 5 gives a detailed overview of HRs for individual VASARI features, including those features that were not selected for the meta-analysis, lacking the mandatory minimum number of 5 articles. Meta-regressions were not possible due to a lack of homogeneous articles.

Color table describing HRs of single VASARI features in OS-predicting studies using univariable Cox proportional models. Thresholds of single HRs were defined arbitrarily, and each color represents a different range: blue, HR <0.75; green, HR 0.75 to <0.85; light red, HR 0.85–1.25; orange, HR >1.25–2.5; dark red, HR >2.5. Values highlighted in bold indicate HRs with statistical significance (P value < .05). The list of VASARI features and their detailed descriptions, along with respective scoring systems for each feature, are provided in the Online Supplemental Data.
Meta-analysis of progression-free survival–predicting studies could not be conducted because only 2 studies10,18 met the necessary prerequisites for this analysis. An overview of HRs for individual VASARI features used in these 2 studies is provided in the Online Supplemental Data.
IDH Status Prediction
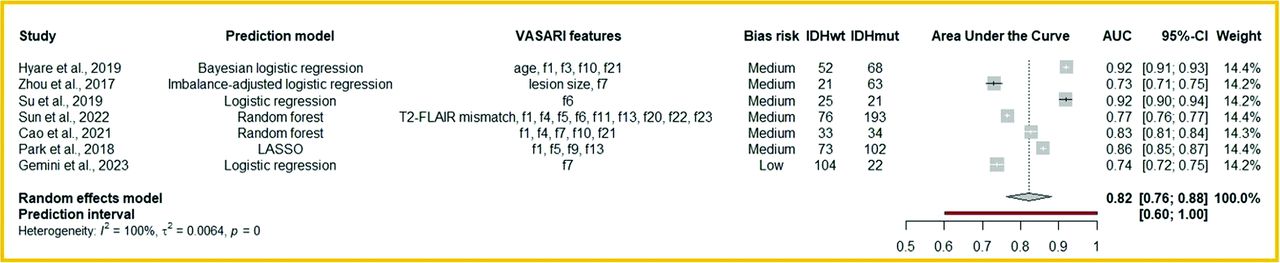
IDH status studies displayed a very heterogeneous design regarding prediction models and VASARI features (Fig 6). None of these studies used the same feature combination, allowing only a general approach (Are multivariable VASARI feature models powerful in predicting IDH status?). These studies13,17,20,25,28,32,37 included grade 1-4 gliomas. The AUC of these models was good, ranging from 0.73 to 0.92 (Fig 6). Meta-regressions were not possible due to a lack of homogeneous articles.

Meta-analysis of glioma IDH mutation status–predicting studies. The list of VASARI features and their detailed descriptions, along with respective scoring systems for each feature, are provided in the Online Supplemental Data. IDHwt indicates IDH wild-type; IDHmut, IDH-mutant.
DISCUSSION
This study shows that VASARI features have primarily been used to predict OS and IDH mutation status. A meta-analysis of OS-predicting studies revealed that the 3 most robust single features in determining OS were multifocality (pooled HR = 1.80), ependymal invasion (pooled HR = 1.73), and enhancing tumor crossing the midline (pooled HR = 2.08), confirming our hypothesis that some features are stronger predictors than others. In a meta-analysis of IDH mutation–predicting VASARI models that incorporated different combinations of single VASARI features, the pooled AUC was 0.82, with considerable variability among single studies. Combined models incorporating different nonimaging data types outperformed single-data-type models, including VASARI-only models, in determining survival, mutation status, or grades of glial tumors.
The survival rates of patients with gliomas remain low despite an aggressive treatment strategy. This outcome is likely the main reason why prognosis prediction was found to be the primary objective of the included studies. Multifocal tumor distribution (feature 9) and ependymal invasion (feature 19) were among the most unfavorable OS predictors,10,15,18,29 which could be prioritized in studies when evaluating all 30 features is impractical. Thomas et al45 also demonstrated a significant correlation between multiple lesions and other negative prognostic indicators, such as a low Karnofsky performance score and resection volume. Lim et al46 found that newly diagnosed glioblastoma with ependymal invasion and cortical involvement were more likely to have multifocal distribution and noncontiguous tumor recurrence with the initial lesion. The midline crossing enhancing tumor (feature 23) had the highest pooled HR of 2.08 and was the strongest OS-limiting predictor. Wangaryattawanich et al10 observed a 9.2-month OS difference (4.8 versus 14 months, P = .001) and a 4.2-month progression-free survival difference (2.4 versus 6.6 months, P < .001) in cases separated by whether the enhancing tumor was crossing the midline (feature 23); similar results were shown by Colen et al,8 with mean OS of 5.9 versus 14.3 months (P < .001).
According to the 2021 WHO CNS classification, the IDH mutation status is crucial to classifying adult-type diffuse gliomas.47 The term “IDH-mutant glioblastoma” has been changed to “IDH-mutant astrocytoma” requiring IDH wild-type status for glioblastomas. Our study identified 4 VASARI features (enhancement quality,17,20,30,36,37 proportion of enhancing tumor,17,20,30,37 proportion of necrosis,17,30,36,37 and proportion of edema14,17,20,36) as the main indicators of IDH mutation status. However, it was not possible to quantitatively evaluate the impact of these features on IDH status prediction due to the limited number of studies and their methodologic differences.
Combined feature models, including various variables, such as clinical, imaging/VASARI, radiomics, genomics, or pathologic features, predicting OS, or other objectives, outperformed single-data-type models, showing the importance of a multidisciplinary approach in decision-making. The input used for these models varied among studies. However, certain factors were frequently chosen, such as age and Karnofsky performance score for clinical models,4,18,22,26 IDH mutation, 1p/19q codeletion, and O(6)-methylguanine-DNA methyltransferase or histologic grade18,21,22 for pathologic/genomics models, and shape or texture features for radiomics models.24,31,32,34 Nevertheless, the methodologic heterogeneity among those studies, such as different sample sizes and VASARI features or differently structured multivariable models, lowers evidence and precludes translation from the research field to clinical application.
On the basis of the results of our study, several recommendations can be made to improve the generalizability of glioma research using VASARI features. The number and choice of applied VASARI features differed among studies, and some VASARI features were independently modified from their original definition in different studies. The postoperative features 26–28 and feature 15 (edema crossing the midline) were rarely used, making their significance challenging to estimate. Some studies modified VASARI features (using features 4–7, 14, and 17) from the original scoring system, hindering generalizability. Future studies should adhere to the original VASARI scoring system and, if feasible, evaluate all VASARI features to find relevant features for a particular objective. Because the manual extraction of VASARI features is time-consuming. Therefore, automatic extraction technology should be developed, which may also help minimize the heterogeneity described. When a radiologist’s input is needed, reducing the entire feature set to only the most promising features, such as multifocality, ependymal invasion, and enhancing tumor crossing the midline for overall survival prediction, as identified in this meta-analysis, may alleviate the workload. It lies in the nature of the exhaustive VASARI feature set to include collinearity among several features and features that leave a higher chance of interrater disagreement. A reduction of features for research purposes according to reproducibility and predictive value appears to be the proximate consequence.
Our study has several limitations. Studies were heterogeneous in design, and some had a small sample size, with a mean of 124 cases. Some studies used The Cancer Imaging Archive database, leading to partially overlapping cohorts, which we attempted to correct. The meta-analysis was limited due to a high study heterogeneity. Metaregression, sensitivity analysis, and nonreporting bias analysis could not be performed due to the limited number of studies and the diversity in reported predictive models and used feature sets. Studies reporting the performance of VASARI-based OS-predicting models had substantial methodologic heterogeneity, because each study used a different set of VASARI features. Model end points were also heterogeneous. Most of the studies reported a regression model predicting a continuous OS parameter (in days or months); some used classification with different thresholds to predict a more-or-less favorable OS outcome. Other reasons for heterogeneity were using different statistical models (random survival forest, Cox proportional regression, or clustering analysis) and inconsistent use of VASARI feature-selection methods for single-data-type models. Statistical data, needed for a meta-analysis, such as confidence intervals or standard errors, were inconsistently reported. Although we attempted a meta-analysis for IDH-predictive VASARI models, these models used different combinations of VASARI features, making it difficult to establish an added value of the VASARI model. Additionally, most studies did not provide molecular diagnostics for glioma grading. Although expected for studies published before 2021, this issue was one of the main reasons most studies were assigned the “medium” QUADAS-2 category for risk-of-bias assessment with applicability concerns in patient selection.
Conclusions
This meta-analysis reveals that certain features in the VASARI set have promise in predicting OS and IDH mutation status. However, the added value of VASARI for predicting tumor grade, true progression, and the status of other mutations remains uncertain, mainly due to insufficiently comparable studies. The discriminatory power of individual VASARI features differs considerably. A core set of promising features, as emerged from this meta-analysis, may be worth prioritizing for scientific evaluation and considered in clinical use, to avoid using the exhaustive list of VASARI features, which is too time-consuming for daily practice.
Footnotes
This study received funding from the Hanarth Foundation.
Professor Barkhof is supported by the National Institute for Health and Care Research Biomedical Research Center at University College London Hospitals.
Ms Azizova is supported by the European Society of Neuroradiology Research Fellowship Grant.
Disclosure forms provided by the authors are available with the full text and PDF of this article at www.ajnr.org.
References
- Received February 4, 2024.
- Accepted after revision March 1, 2024.
- © 2024 by American Journal of Neuroradiology


Jump to section
Related Articles
Cited By...
- No citing articles found.