
Graphical Abstract

Abstract
BACKGROUND AND PURPOSE: CTP has been validated for stroke due to large vessel occlusion, but not for medium or distal vessel occlusions (MDVO). The aim of this study was to evaluate discrepancy of 2 widely used postprocessing tools for CTP in patients with medium/distal vessel occlusion (MDVO) stroke.
MATERIALS AND METHODS: This retrospective single-center cohort study comprised CTP data sets of patients with acute isolated MDVO and disabling stroke. CTP postprocessing included Syngo.via and RapidAI. Perfusion lesions were segmented and compared with regard to volume and spatial distribution of the perfusion abnormalities. For each patient, the results of the 2 postprocessing tools were deemed to represent agreement regarding volume and/or distribution according to a predefined classification scheme. Penumbra volumes were compared between postprocessing tools by using the t test for paired samples.
RESULTS: Fifty CTP data sets from 49 patients (mean age 75.3 ± 10.7 years, 33 male patients) were included. In <30% of patients, the predefined criteria for agreement were met which indicate at least 50% congruence regarding lesion size and lesion location as well as a maximum distance between lesion margins <50 mm. Comparison of tissue at risk volumes revealed outliers, volume disagreement, and distribution disagreement in up to 79.6%. The 2 postprocessing tools disagreed on presence and volume of an infarct core in up to 86% of patients. Penumbra volumes differed significantly between postprocessing tools (P < .001; mean difference 50.5 mL/16.9 mL).
CONCLUSIONS: Despite being in daily use, commercially available postprocessing tools for CTP provide discrepant results in patients with MDVO.
ABBREVIATIONS:
- DS
- Dice score
- EVT
- endovascular therapy
- HD
- Hausdorff distance
- IQR
- interquartile range
- LVO
- large vessel occlusion
- MDVO
- medium/distal vessel occlusion
- RGB
- red, green, blue
- RVD
- relative volume difference
- Tmax
- time-to-maximum
SUMMARY
PREVIOUS LITERATURE:
MDVOs are frequent causes of acute ischemic stroke and are more and more considered for EVT. CTP can be used to identify potentially treatment-eligible candidates, underlined by the fact that CTP results are part of the inclusion criteria in 5 of 6 randomized trials for EVT in MDVO. However, numerous postprocessing tools for CTP raw data exist and it is currently unknown whether different postprocessing tools provide concordant results.
KEY FINDINGS:
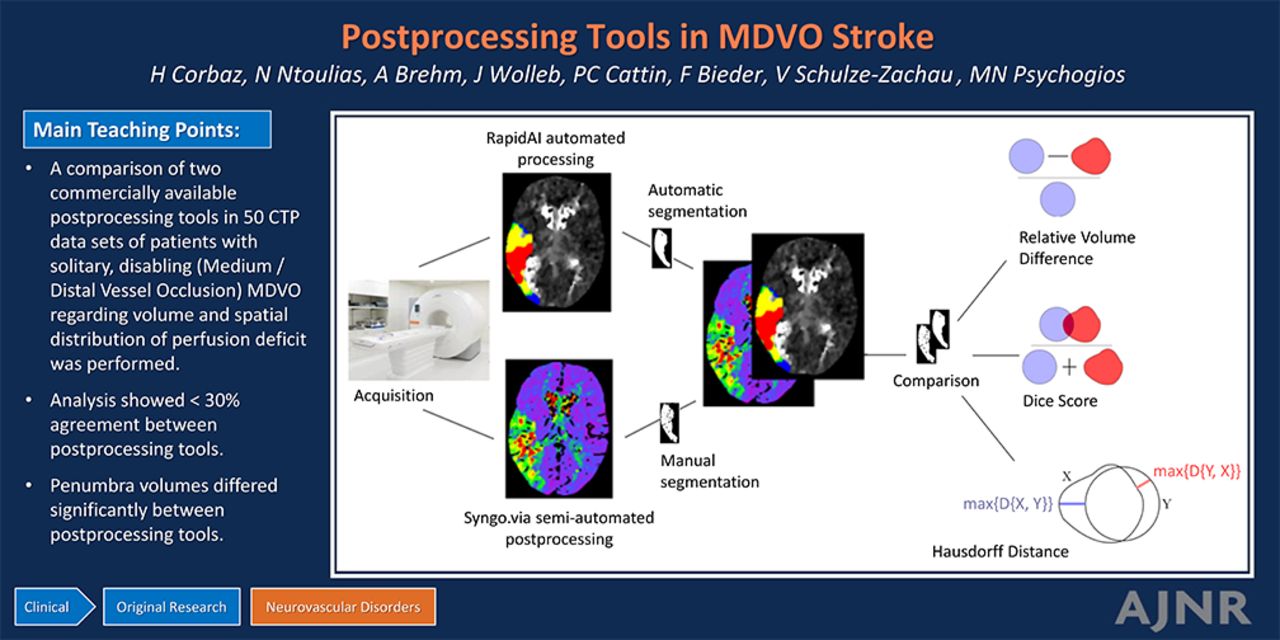
The comparison of 2 commercially available postprocessing tools in 50 CTP data sets of patients with solitary disabling MDVO showed agreement between postprocessing tools in <30%. Penumbra volumes differed significantly between postprocessing tools.
KNOWLEDGE ADVANCEMENT:
In patients with solitary disabling MDVO, 2 different postprocessing tools resulted in largely discordant results. This questions whether infarct core size or penumbra volume should routinely be used to identify candidates for MDVO thrombectomy.
Medium/distal vessel occlusions (MDVOs) constitute approximately one-third of ischemic strokes with identifiable vessel occlusion1 and add considerably to overall stroke-related morbidity and mortality.2 Six randomized trials Endovascular Therapy Plus Best Medical Treatment (BMT) Versus BMT Alone for MedIum Vessel Occlusion Stroke (DISTAL [NCT05029414]), Distal Ischemic Stroke Treatment with Adjustable Low-Profile Stentriever (DISTALS [NCT05152524]), Evaluation of Mechanical Thrombectomy in Acute Ischemic Stroke Related to a Distal Arterial Occlusion (DISCOUNT [NCT05030142]), Endovascular Treatment to Improve Outcomes for Medium Vessel Occlusions (ESCAPE-MeVO [NCT05151172]), Randomized Controlled Trial of the Clinical Outcome and Safety of Endovascular versus Standard Medical Therapy for Stroke with Medium Sized Vessel Occlusion (FRONTIER-AP [ACTRN 12621001746820p]), and Combined Thrombectomy for Distal Medium Vessel Occlusion Stroke (DUSK [NCT05983757])] are currently assessing whether endovascular therapy (EVT) may improve the clinical outcome in patients with MDVO.3 Although MDVO is a frequent and relevant disease, there is no guideline recommendation regarding the optimal diagnostic imaging work-up for detection and characterization of MDVOs. Several studies have pointed out that CTA alone has limited sensitivity for the detection of MDVO4,5 and that CTP can increase the detection rates of MDVO.6⇓-8 Beyond detection, CTP also plays a role in characterization of MDVO, which is reflected in the fact that CTP results are part of the inclusion criteria in 5 of 6 randomized trials for EVT in MDVO.3,9
However, different vendors provide different tools for postprocessing of CTP raw data10 with relevant differences in the assessment of ischemic core and penumbra volumes in patients with large vessel occlusions (LVOs).11 Furthermore, a variety of perfusion parameters and corresponding thresholds has been proposed to differentiate between infarct core and penumbra in LVO10 and the choice of perfusion parameter and threshold has been shown to affect estimations of salvageable tissue volume.12 While it is unclear whether these parameters and thresholds can be used interchangeably in LVO stroke,13 there is even greater uncertainty in MDVO.14
The aim of this study was to compare different perfusion parameters derived from 2 widely used postprocessing tools of 2 different vendors to detect major discrepancies regarding differences in volume estimation and anatomic distribution of the perfusion abnormalities.
MATERIALS AND METHODS
Patient Cohort
The local PACS was searched retrospectively for patients with acute disabling ischemic stroke by using the following inclusion criteria: patient age ≥18 years, acute stroke with symptom onset within the last 8 hours, MDVO with an isolated vessel occlusion, availability of NCCT, CTA, and CTP. Inclusion period was January 1, 2018 to December 31, 2023. Patients were not included if artifacts were found on CTP, such as patient movement indicated by automatic patient movement detection, or if CTP quality was reduced, eg, due to truncation, indicated by an incomplete venous outflow curve. Patients with a high-grade (>70%) stenosis of a cervical vessel according to NASCET criteria and patients with known intracranial arteriosclerotic disease with an intracranial stenosis >50% according to Comparison of Warfarin and Aspirin for Symptomatic Intracranial Arterial Stenosis criteria were not included to avoid confounding of perfusion results due to stenotic lesions proximal to the location of vessel occlusion.
Disabling stroke was defined to encompass NIHSS at admission ≥4 or clearly disabling symptoms such as aphasia or hemianopia. Inclusion was limited to patients with disabling stroke to avoid a cohort with heterogeneous treatment indication status and unclear clinical relevance of perfusion results. This study follows the anatomic definitions used in the DISTAL trial15: MDVO was defined to encompass occlusions of nondominant or codominant M2 segments that represent the first vertical segment of the MCA, or M3–M5 segments of the middle cerebral artery, A1–A5 segments of the anterior cerebral artery, P1–P4 segments of the posterior cerebral artery, or occlusions of the anterior or posterior communicating arteries. Figure 1 shows a patient flow chart to illustrate how patients were selected.

Patient flow chart. *The full-text search was conducted in the local PACS and included the descriptors “acute stroke,” “cerebrovascular insult,” and “National Institutes of Health Stroke Scale” as well as corresponding abbreviations.
Ethics committee approval and patient consent were not required according to current local legislation because all data were anonymized before analysis and the project involved assessing safety and quality of routine acute ischemic stroke management in the participating institutions. This manuscript follows the methodology proposed by the Strengthening the Reporting of Observational Studies in Epidemiology consortium16 and the corresponding checklist can be found in the Supplemental Data.
Image Data Acquisition and Postprocessing
Images were acquired by using conventional multislice CT scanners (Somatom Force, Siemens Healthineers). The CTP imaging adhered to a standard protocol as recommended by the manufacturer. Using a dual-head power injector, 60 mL of the contrast agent (Iopamiro 300, Bracco) was delivered at a rate of 5 mL/s through an 18-gauge venous line, followed by a 30 mL saline flush. The acquisition parameters for most images included: 180 mAs, 70 kV, 570 ms, a matrix size of 512 × 512, a field of view of 20 cm, a spiral pitch factor of 0.5, a single collimation width of 1.2 mm, and H36f kernel. A total of 28 contrast phases (20 scans with cycle time of 1.5 seconds and 8 cycles of 3 seconds) were captured in 53.03 seconds.
The following commercially available postprocessing tools were used: RapidAI CTP automated postprocessing (Version 5.0.4, iSchema View) and Syngo.via CT Neuro Perfusion semiautomated postprocessing (Siemens Healthineers).
Perfusion Lesion Segmentation
Semiautomated postprocessing results were manually segmented by using the open-source software package 3D Slicer (https://github.com/Slicer/Slicer)17 by a radiologist (N.N.) and critically reviewed by a senior diagnostic and interventional neuroradiologist with >10 years of experience (M.-N.P.). Regions with elongated time-to-maximum (Tmax) were segmented to identify tissue at risk, while regions with elongated time-to-drain, but normal Tmax were not included. Regions with reduced CBV were segmented to identify infarct core. For both Tmax and CBV, each single lesion was segmented on all affected slices, encompassing the complete volume of the perceived perfusion abnormality. Areas of visually perceived perfusion abnormality not corresponding to acute ischemia such as chronic postischemic defects were not included in lesion segmentation.
Segmentation of automated postprocessing results was performed automatically by using red, green, blue (RGB) channels with the following thresholds as defined by the vendor: Tmax > 4 seconds and Tmax > 6 seconds to identify tissue at risk, CBF <30% and Tmax > 10 seconds to identify infarct core. Tmax > 10 seconds has previously been used as a surrogate of infarct core and was shown to predict final infarct volume in patients with MDVO with unsuccessful reperfusion14 and the ratio of Tmax > 10 seconds to Tmax > 6 seconds, also known as hypoperfusion intensity ratio, was shown to correlate to patient outcomes.18,19
The RGB images were reformatted as binary images. Both the images and the labels from automated postprocessing were resampled to match the number of slices in the maps derived from semiautomated postprocessing. The binary label maps were resampled in the signed distance field domain. Coregistration was performed by using the Advanced Normalization Tools symmetric normalization registration method (affine and deformable transformations),20 with mutual information as the criterion (antspyx 0.4.2). The fixed images were the images from semiautomatic and the moving images were the images from automated postprocessing. The transformations were then applied to the labels of the moving images.
Definition of Comparative Measures
For comparison and high-quality registration, the pixels were resampled to have the same pixel size in both images. Pixels were not made isotropic to avoid excessive resampling. The volume of each perfusion lesion was measured as the sum of the pixels of a label. To obtain an estimate of the actual volume (estimated volume), we multiplied the measured volume by the size of the pixel in each direction (0.4 × 0.4 × 5 mm).
The relative volume difference (RVD) was defined as  with U being the volume of the first label and V the volume of the second label. It represents quantitative size difference in relation to the absolute lesion volume.
The Dice score (Sørensen Dice coefficient [DS]) and Hausdorff distance (HD)21 were used as quantitative measures of distribution. DS is defined as  where X is the first label and Y the second label. It represents how well the 2 labels overlap, with the value 1 representing perfect overlap and the value 0 representing no overlap. HD was defined to be
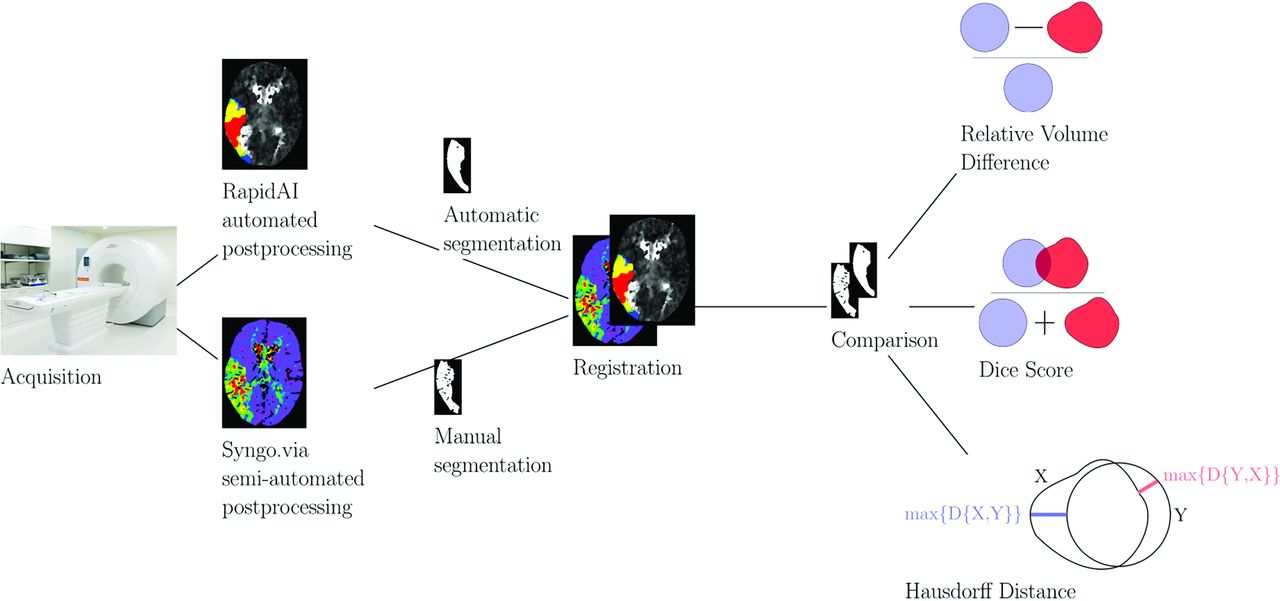
  , where D is the distance, A is the ensemble of pixels belonging to the first label and B is the set of pixels belonging to the second label. HD represents the largest distance between the 2 labels and is complementary to the Dice score, with the value 0 representing identical label margins. Figure 2 illustrates the workflow of the study including illustrations of DS and HD.

Study workflow.
Perfusion Lesion Comparison and Statistics
Regarding surrogates of tissue at risk and infarct core, we compared the Tmax lesion segmented from semiautomated postprocessing maps with lesions from 2 different thresholds of Tmax maps derived from automated postprocessing (thresholds: 4 seconds and 6 seconds). We compared the CBV lesion segmented from semiautomated postprocessing with core lesions derived from automated postprocessing (thresholds: < 30% CBF and Tmax > 10 seconds).
For each patient, the result of each comparison was classified to represent agreement or one of several types of disagreement according to the following criteria: First, the RVD was classified as volume agreement if below 0.5 (<50% volume difference) and volume disagreement if above 0.5. Patients in the volume agreement category were then classified in distribution agreement if their DS was above or equal to 0.5 (>50% lesion overlap) and in distribution disagreement if their DS was lower than 0.5. The patients from the category distribution agreement were classified to represent agreement if their HD was below or equal to 50 mm or to represent agreement with outliers if their HD was above 50 mm. This indicates that the distribution of the major component of the lesion was similar in both maps, but a minor fraction of the lesion was unequally distributed. The choice of the above-mentioned thresholds is arbitrary and represents the authors’ consensus of the lowest acceptable agreement between 2 tools if the tools are to be used in clinical decision-making. Furthermore, this consensus represents a reasonable compromise between technically feasible and clinically meaningful options. Figure 3 illustrates the comparison decision tree.

Classification scheme.
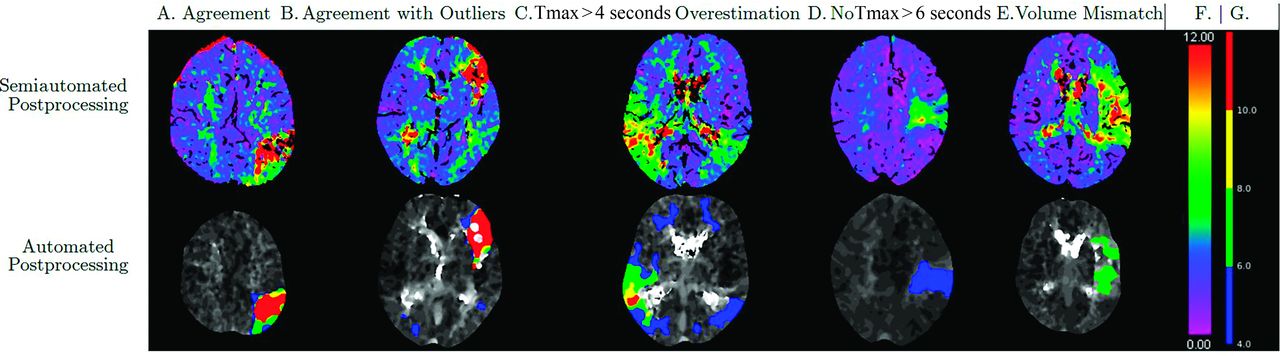
Patients in the category volume disagreement were further subclassified into 3 predefined groups. The definition of these groups is derived from observation of typical and relevant patterns of disagreement during routine clinical practice. The 3 groups were: 1) no lesion in automated postprocessing Tmax > 6 seconds map, 2) a substantially larger Tmax > 4 seconds lesion as compared with semiautomated postprocessing results of Tmax (defined as DS <0.5, HD >50, and volume ratio >0.5), and 3) patients with no CBV or CBF lesion in any postprocessing. Figure 4 shows examples of these patterns.

Examples of different categories of agreement or disagreement. Figure shows Tmax maps for semiautomated (upper row) and automated postprocessing. A, Agreement. B, Agreement with outliers. Please note contralateral areas of Tmax > 4 seconds indicated in blue in the RapidAI map. C, Tmax > 4 seconds overestimation. Please note how the Tmax >4 seconds lesion of RapidAI extends beyond the lesion of perfusion delay in the Syngo.via Tmax map. D, No Tmax > 6 seconds lesion. E, Volume mismatch. F, Color reference for perfusion maps derived from Syngo.via. G, Color reference for perfusion maps derived from RapidAI.
The median values for the DS, HD, and RVD were computed. If a category included at least 20% of patients, it was described as a pattern. Patterns were defined to be infrequent, if occurring in 20%–40% of patients, frequent (41%–60%), or dominant (>60%).
Calculation and Comparison of Mismatch Volumes
Regarding the penumbra, ie, potentially salvageable tissue, that is a mismatch between the area of perfusion delay and the infarct core: For semiautomated postprocessing, mismatch volume was defined as Tmax lesion volume – CBV lesion volume. For automated postprocessing, 2 mismatch volumes were calculated, defined as Tmax > 4 seconds volume – CBF <30% volume and Tmax > 6 seconds volume – CBF <30% volume. Mismatch volumes were compared by using t test for paired samples including Cohen d to calculate effect size and visualized by using Bland-Altman plots. SPSS Version 28.0.1.0 (IBM) was used for plotting and statistical testing. We deemed P values <.05 to be significant.
RESULTS
Study Cohort
The study cohort comprised 50 data sets derived from 49 patients (mean age 75.3 ± 10.7 years, 33 male patients). One patient experienced 2 strokes with a time lag of several months, each of which was due to a solitary MDVO. CTP data sets from both events were included. Baseline characteristics including occlusion location are shown in Tables 1 and 2. A patient flow chart can be found in Fig 1.
Patient baseline characteristics
Patient baseline characteristics
Characteristics and Comparison of Perfusion Lesions
Semiautomated perfusion postprocessing resulted in a median volume of tissue at risk of 42.8 mL (interquartile range [IQR] 33.8 mL) while automated postprocessing resulted in 67.4 mL (Tmax > 4 seconds, IQR 67.7 mL) and 25.4 mL (Tmax > 6 seconds, IQR 21.4 mL), respectively. The median volume of the infarct core was 7.3 mL (IQR 25.2 mL) if analyzed with semiautomated postprocessing while automated postprocessing revealed median volumes of 2.8 mL (CBF <30%, IQR 9.0 mL) and 7.4 mL (Tmax > 10 seconds, IQR 17.8 mL), respectively. Characteristics of perfusion lesion volumes are also shown in Table 3.
Distribution of the perfusion lesion volumes
Regarding perfusion lesion comparison, Table 4 shows the median of DS, HD, and RVD for each pair of perfusion lesions.
Median of the DS, HD, and the RVD for the different comparisons
Patterns of Perfusion Lesion Agreement and Discrepancy
The following patterns were found:
For the comparison of Tmax (semiautomated postprocessing) and Tmax >4 seconds, “agreement,” “agreement with outliers,” and “volume disagreement” were infrequent patterns.
For the comparison of Tmax (semiautomated postprocessing) and Tmax > 6 seconds, “agreement” was an infrequent pattern and “volume disagreement” was a dominant pattern.
For the comparison of CBV (semiautomated postprocessing) and CBF<30%, “Volume disagreement” was a dominant pattern with the following subcategories: “No CBF lesion” (frequent), “No CBV lesion” (infrequent), and “No lesion agreement” (infrequent).
For the comparison of CBV (semiautomated postprocessing) and Tmax > 10 seconds, “volume disagreement” was a dominant pattern with the following subcategories: “No Tmax > 10 seconds lesion” (infrequent) and “No CBV lesion” (infrequent).
Figure 5 illustrates the frequency of these patterns for every type of comparison. A detailed overview of pattern frequency can be found in the Supplemental Data.

Patterns of agreement and disagreement between semiautomated and automated postprocessing.
Characteristics and Comparison of Mismatch Volume
Mean mismatch volume as per semiautomated postprocessing was 47.1 mL (range: 2–156 mL). Mean mismatch volumes as per automated postprocessing were 97.6 mL (Tmax > 4 seconds versus CBF <30%; range: 5–369 mL) and 30.2 mL (Tmax > 6 seconds versus CBF <30%; range: 0–95 mL), respectively. Mismatch volumes derived from semiautomated postprocessing were significantly different compared with those derived from automated postprocessing (P < .001, Cohen d = 60.8 and P < .001, Cohen d = 27.5, respectively) with a mean difference of 50.5 ± 60.8 mL (Tmax > 4 seconds) and 16.9 ± 27.5 mL (Tmax > 6 seconds). Bland-Altman plots illustrating this comparison are shown in Fig 6.

Bland-Altman plots for the comparison of mismatch estimates of semiautomated and automated postprocessing. Mismatch volume derived from semiautomated postprocessing (mL) as compared with mismatch volume derived from automated postprocessing (mL). A, In the upper graphic, automated postprocessing mismatch volume was defined as volume of Tmax >4 seconds – volume of CBF <30%. B, In the lower graphic, automated postprocessing mismatch volume was defined as volume of Tmax > 6 seconds – volume of CBF <30%. In both graphics, semiautomated postprocessing mismatch volume was defined as volume of Tmax lesion – volume of CBV lesion. For both comparisons, the discrepancy of mismatch volume was larger for patients with larger average volume of the perfusion lesion. SD indicates standard deviation.
DISCUSSION
In this study, we compared 2 postprocessing tools for CTP in patients with isolated MDVO. Agreement between the tools was limited: 29% of patients met the predefined criteria of agreement between results of the postprocessing tools for the pair of maps that compared most favorable, with agreement indicating at least 50% congruence regarding lesion size and lesion location as well as a maximum distance between lesion margins <50 mm. Comparison of mismatch volumes between the 2 postprocessing tools revealed substantial differences, more profound in cases with larger perfusion lesions.
Results of perfusion delay metrics showed greater agreement compared with results of infarct core surrogates. Comparison between Tmax lesions derived from semiautomated postprocessing and Tmax > 6 seconds results from automated postprocessing showed the greatest proportion of agreement, while comparison to Tmax > 4 seconds was characterized by a substantial number of outliers (37%) and Tmax > 4 seconds overprediction (12%). This possibly indicates that the Tmax threshold of 4 seconds is not specific for acute MDVO stroke.
Comparison between surrogates of infarct core revealed that for most patients, there was disagreement regarding the presence and volume of an infarct core. In up to 67% of patients, at least one of both postprocessing tools did not detect an infarct core. Because the infarct core is smaller in MDVO compared with LVO, it may be more difficult to grasp. Furthermore, because the influence of collaterals is expected to be higher in MDVO compared with LVO,22 the reduction of CBF or CBV might be less severe and therefore more difficult to detect. Finally, even if one accepts the hypothesis that CBV, CBF <30%, and Tmax > 10 seconds result in comparable estimations of infarct core in LVO stroke, this does not necessarily also apply in MDVO stroke.
Mismatch volumes, ie, penumbra volumes, differed significantly between postprocessing tools, and the discrepancy regarding the infarct core represents a major contribution to this disparity. The discrepancy of mismatch volume was most severe in patients with larger overall perfusion lesions. The discrepancy of results uncovered in this study should remind decision makers to take all relevant aspects into account. Excluding individual patients from treatment based solely on the presumed absence of penumbra carries the risk of leaving behind potentially treatment-eligible candidates.
A prior study by Bathla et al23 focused on the comparison of perfusion results derived from Syngo.Via and RapidAI in LVO and found a 93% rate of concordance regarding the treatment allocation with respect to Endovascular Therapy Following Imaging Evaluation for Ischemic Stroke 3 (DEFUSE 3) imaging eligibility criteria. Muehlen et al24 found that Syngo.Via and RapidAI showed comparable results for follow-up infarct volume in LVO if relative CBF thresholds were adjusted. While these results cannot directly be extrapolated to MDVO, they provide evidence for the validity of both postprocessing pathways. Future studies may want to follow their approaches and focus on: 1) treatment criteria that are expected to be established after the publication of the ongoing randomized trials, and 2) actionable possibilities to increase the accordance of both methods.
This study has several limitations, including its monocentric cohort and limited sample size. The term MDVO covers a heterogeneous group of vessel occlusions that may have implications on results. However, this study’s cohort follows the frequency of occlusions described in large systemic reviews.25 The general limitations of manual segmentation apply for the perfusion lesions derived from semiautomated postprocessing. Although the quality of the final images has been visually and quantitatively checked, the registration process may result in minor deformations. In addition, the interpolation of the automated postprocessing images to match the number of slices in the semiautomated postprocessing images is an estimation process.
Strengths of this study include the restriction to a patient cohort with disabling symptoms. This approach ensures that the study population is not largely composed of patients with MDVO of unclear or limited clinical significance and that the study’s results apply to patients in which EVT may be considered. While previous studies have shown that CTP maps such as Tmax maps are able to detect MDVO with high accuracy,7 this study focuses on how MDVO can be characterized by CTP. Our approach goes beyond volumetric analyses by taking the spatial distribution of the CTP lesion into account. Because CTP results may be used to gain insight whether critical locations such as the central region are affected, the distribution of perfusion abnormalities can be relevant. While this study does not propose a new or superior CTP postprocessing method for MDVO, it may be part of the groundwork for future research projects.
CONCLUSIONS
Results from 2 different postprocessing tools differed substantially regarding the volume and the location of perfusion deficit in isolated MDVO as well as the volume of potentially salvageable penumbra. Our results question whether infarct core size or mismatch volume should routinely be used to identify candidates for MDVO thrombectomy. Further studies are needed to optimize the prediction of final infarct volume and to harmonize the different available postprocessing tools.
Acknowledgments
ChatGPT-4 (OpenAI, San Francisco, CA) was used for refining the language of the initial manuscript draft. All suggestions from ChatGPT-4 were critically reviewed by the authors who take full responsibility for the manuscript.
Footnotes
Helene Corbaz, Nikolaos Ntoulias, Victor Schulze-Zachau, and Marios-Nikos Psychogios contributed equally to this article.
Disclosure forms provided by the authors are available with the full text and PDF of this article at www.ajnr.org.
References
- Received September 2, 2024.
- Accepted after revision November 7, 2024.
- © 2025 by American Journal of Neuroradiology


Jump to section
Related Articles
Cited By...
- No citing articles found.