
Abstract
BACKGROUND AND PURPOSE: Lateral decubitus CT myelography (LDCTM) is one of the main studies for the detection of CSF-venous fistulas, but detection of CSF-venous fistulas is dependent on intrathecal contrast attenuation. The purpose of this investigation was to assess the tolerability and technical performance of increased intrathecal doses of myelographic contrast compared with standard doses.
MATERIALS AND METHODS: This is a retrospective series of 24 patients who underwent LDCTM following administration of either 10 or 20 mL of intrathecal iodinated contrast media (300 or 320 mg/mL of iodine content). Patients were scanned in the initial lateral decubitus position and then turned to the contralateral side and re-scanned in the same session. The safety and tolerability of the 20 mL dose was assessed from clinical records. The technical performance of the studies was compared between groups (10 or 20 mL) by measuring attenuation values over the lateral thecal sac at standardized levels. Both the initial scan and the scan after turning the patient to the contralateral side were assessed.
RESULTS: No moderate or severe adverse event was recorded in either group. The 20-mL group showed higher attenuation values, which were statistically greater on the second side examined compared with the standard-dose group.
CONCLUSIONS: Increased volume of intrathecal contrast was well-tolerated and improved the technical performance of LDCTM in this limited series. Further assessment of the safety and impact on diagnostic yield using larger patient cohorts is warranted.
ABBREVIATIONS:
- CVF
- CSF-venous fistula
- IOCM
- iodinated contrast media
- LDCTM
- lateral decubitus CT myelography
SUMMARY
PREVIOUS LITERATURE:
LDCTM is one of the main imaging modalities for the detection of CSF-venous fistulas, but studying both sides of the spine in the same session has limitations. Using an increased dose of contrast media to overcome these limitations has not been extensively studied previously, with 1 small case series describing a 2-injection technique.
KEY FINDINGS:
There were no relevant adverse reactions to 20 mL of iodinated contrast media in this series. Increased contrast dosage was associated with higher attenuation values within the subarachnoid space, especially on the second side examined during a single-session bilateral LDCTM.
KNOWLEDGE ADVANCEMENT:
LDCTM with a single bolus of 20 mL of IOCM appears safe and effective for the bilateral evaluation of the spine in patients with suspected CSF-venous fistulas.
CSF-venous fistulas (CVFs) result from abnormal connections between the spinal subarachnoid space and neighboring paraspinal veins, leading to the onset of spontaneous intracranial hypotension.1 Lateral decubitus CT myelography (LDCTM) and lateral decubitus digital subtraction myelography are the primary methods for identifying CVFs.1 Both examinations rely on decubitus positioning to promote dense layering of iodinated contrast media (IOCM) over the lateral aspect of the thecal sac to enhance visualization of CVFs.2,3 When a fistula is not identified on the first side examined, the contralateral side needs to be investigated. Because of the need for digital subtraction and thus an initial masking image without contrast on each side, bilateral lateral decubitus digital subtraction myelography is necessarily performed on 2 separate days.3,4 With LDCTM, because there is no masking/subtraction constraint, evaluating both sides in the same session is feasible.1,5⇓–7 However, contrast media tends to dilute within the thecal sac the more patients change their position, potentially decreasing the sensitivity of the evaluation on the second side. Thus, some centers opt to also perform bilateral LDCTM on 2 separate days, requiring a repeat lumbar puncture.4,7
Although package inserts and much of the medical literature on the intrathecal use of IOCM advises a limit of 3.0–3.2 g of iodine/day (ie, 10 mL of IOCM containing 300 or 320 mg/mL of iodine),8 recent literature suggests that higher doses could be safe.6,8,9 The authors have thus started performing LDCTM using such higher doses of contrast and hypothesized that this use might be safe and may promote higher contrast density over the dependent portion of the thecal sac during LDCTM performed for suspected CVF. The purpose of this investigation was to review preliminary safety and tolerability data from those cases and to assess the impact on contrast density in LDCTM cases in which both lateral decubitus positions were assessed after a single intrathecal contrast injection.
MATERIALS AND METHODS
This is a retrospective case-control series of patients undergoing LDCTM examinations between April 2023 to February 2024, which were performed by the same team of radiologists on the same CT scanner (Somatom Definition AS; Siemens). A checklist from the Strengthening the reporting of observational studies in epidemiology (STROBE) was used to guide the methodology of this study.
Inclusion criteria were the following: 1) LDCTM performed with a single bolus injection of either 10 or 20 mL of iodinated contrast media; 2) bilateral LDCTM during the same examination; 3) study performed for a suspicion of CVF; and 4) study performed with elevation of the head and hips to concentrate the contrast bolus in the thoracic spine. All consecutive patients meeting these criteria were enrolled, and no patients were excluded. Only the first examination meeting these criteria for each patient was considered. The control group was defined as subjects who received the standard 10 mL of intrathecal iodinated contrast media; and the study group, as those who received 20 mL of contrast.
Intrathecal Contrast Dose Selection
Our standard protocol before June 2023 involved the administration of 10 mL of intrathecal contrast (either 300 mg/mL [total dose of 3 g of iodine] or 320 mg/mL [total dose of 3.2 g of iodine]). From June 2023 onward, we have progressively changed our protocol and standardized the use of 20 mL of intrathecal contrast, consistently using the isosmolar agent Iodixanol 320 (320 mg/mL [total dose of 3.2 g of iodine]), which, in some of the authors’ anecdotal experience, might be associated with fewer neurologic adverse effects than other agents with higher osmolality.
Myelography Technique
Patients are positioned in the lateral decubitus position on the CT table (usually on the right side, except if the operator had a particular suspicion for the left side, eg, more diverticula, doubtful finding on a previous conventional CTM, and so forth), with the head, trunk, and hips at the same height. The lumbar thecal sac is then accessed under CT fluoroscopic guidance with a 25G pencil-point Whitacre needle (Becton, Dickenson and Company). After measuring the CSF opening pressure and before the injection of contrast, the patient’s head is elevated with pillows to prevent the contrast from flowing into the head, which can potentially induce headache and decrease the density of intrathecal contrast in the spine. Either 10 or 20 mL of iodinated contrast media is then injected. The patient is monitored for adverse effects that might cause the operator to stop the contrast injection. Mild pain, subjective heaviness, or burning sensation during injection are expected adverse effects of the contrast medium and would usually not prompt discontinuation of injection. The needle is withdrawn, and the patient’s hips are elevated with a foam wedge, creating a gravity-dependent concavity on the midthoracic spine. A scan is obtained with the patient in the first decubitus position. Subsequently, the wedge is removed, and the patient is carefully rolled over on his or her back into the contralateral decubitus position. The hips are again elevated using a wedge, and a second scan with the patient in the contralateral decubitus position is acquired. Occasionally >1 scan is performed in each decubitus position with differing degrees of hip elevation to adjust the cranial or caudal movement of the contrast bolus. The time between scans usually varies from 2 to 6 minutes and does not seem to be an important factor under this protocol in our experience. All examinations are performed with the patient under local anesthesia without sedation.
Evaluation of Safety and Tolerability
All procedural notes were reviewed for immediate relevant adverse events (moderate or severe as per the Society of Interventional Radiology Adverse Event Classification10), including but not limited to severe or prolonged headache, seizure, loss of consciousness, or need for hospitalization. Charts were also reviewed to identify hospital admission or emergency department visits during the following 4 weeks after the procedure. If present, telephone follow-up notes were also reviewed.
Technical Performance Evaluation
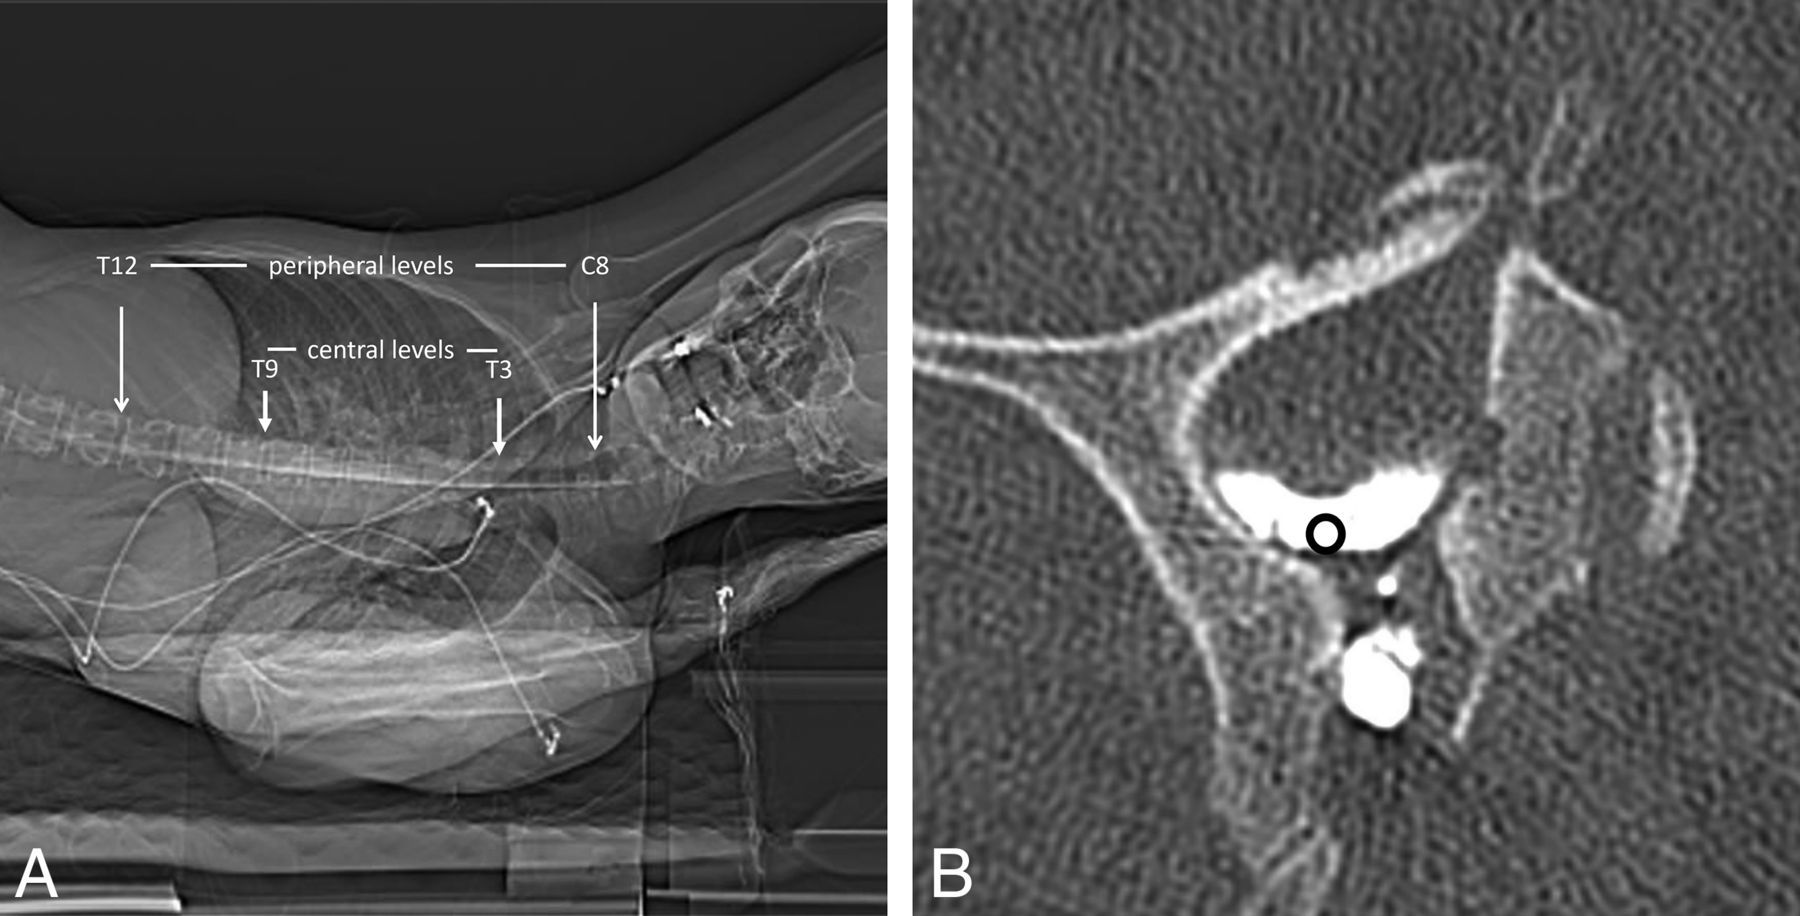
For each myelogram, quantitative analysis of the intrathecal contrast density was performed. Analysis was separately conducted on both decubitus scans for each patient. If >1 scan was obtained in a single decubitus position, the scan with the most complete coverage of the thoracic spine was used. Four standardized levels were assessed to represent the contrast density and spread throughout the thoracic spine: C7, T3, T9, and T12. Levels C7 and T12 were considered peripheral levels, to represent how often the entire thoracic spine was well-opacified, while T3 and T9 were considered central levels, to represent the quality of the remaining concentrated contrast bolus.
On each sampled level, a 0.05-cm2 ROI was placed immediately caudal to the dural emergence of the corresponding nerve root, within the most lateral dependent part of the thecal sac, measuring the mean attenuation in Hounsfield units (Fig 1).

Technique for measurement of attenuation in the lateral thecal sac. A, CT scout image indicating the levels assessed on each scan. B, Axial CT image shows representative placement of an ROI immediately caudal to the dural emergence of the nerve root.
Three average attenuation values were then calculated for each side: total thoracic attenuation average (from all 4 sampled levels), central thoracic attenuation average (from T3 and T9), and peripheral thoracic attenuation average (from C7 and T12).
We also assessed the number of levels that exhibited adequate opacification of the lateral margin of >1500 HU within a 0.05-cm2 ROI positioned immediately medial to the corresponding exiting nerve root sleeve.
Because of the small sample size, we did not compare the diagnostic yield for CVFs between groups, because the study would likely not have been powered adequately to make this assessment. However, when CVFs were detected, the side and vertebral level of the CVF were recorded.
Statistical Analysis
We compared each average attenuation value (total, central, and peripheral) for each side (first side and second side) between the control group and the 20-mL group using a Student t test. The side of the first scan of each patient (decubitus position in which the contrast had been injected) was considered the first side, and the side after rolling the patient over was considered the second side, regardless of it being the right or the left side. P values <.05 were considered statistically significant.
RESULTS
Twenty-four examinations performed between April 2023 and February 2024 met the inclusion criteria. Of these, 6 examinations were performed using 10 mL of intrathecal contrast, and 18 examinations were performed with 20 mL. The Table summarizes the patient population.
| Age | Sex | Opening Pressure | Contrast Volume | Contrast Type | Iodine Dose | First Decubitus | CVF | Bern Score | |
|---|---|---|---|---|---|---|---|---|---|
| 1 | 41 | F | 13 | 20 | Iodixanol 320 | 6.4 | Left | L T8 | 4 |
| 2 | 59 | F | 5 | 20 | Iodixanol 320 | 6.4 | Right | L T8 | 7 |
| 3 | 64 | F | 11 | 20 | Iodixanol 320 | 6.4 | Right | R T2 | 8 |
| 4 | 20 | M | 25 | 20 | Iodixanol 320 | 6.4 | Right | None | 4 |
| 5 | 34 | M | 18 | 20 | Iodixanol 320 | 6.4 | Right | None | 0 |
| 6 | 52 | F | 16 | 20 | Iodixanol 320 | 6.4 | Right | None | 0 |
| 7 | 42 | F | – | 20 | Iodixanol 320 | 6.4 | Right | None | 0 |
| 8 | 40 | F | 18 | 20 | Iodixanol 320 | 6.4 | Left | None | 0 |
| 9 | 15 | M | 14 | 20 | Iodixanol 320 | 6.4 | Right | None | 2 |
| 10 | 64 | F | – | 20 | Iodixanol 320 | 6.4 | Left | R T9 | 6 |
| 11 | 63 | M | 8 | 20 | Iodixanol 320 | 6.4 | Right | None | 0 |
| 12 | 31 | M | 27 | 20 | Iodixanol 320 | 6.4 | Right | None | 0 |
| 13 | 41 | F | 11 | 20 | Iodixanol 320 | 6.4 | Left | None | 0 |
| 14 | 51 | M | 7 | 20 | Iodixanol 320 | 6.4 | Right | R T7 | 6 |
| 15 | 51 | F | 10 | 20 | Iodixanol 320 | 6.4 | Right | R T10 | 4 |
| 16 | 68 | M | 1 | 20 | Iodixanol 320 | 6.4 | Right | None | 0 |
| 17 | 70 | M | 7 | 20 | Iodixanol 320 | 6.4 | Right | R T6 | 7 |
| 18 | 46 | F | 11 | 20 | Iodixanol 320 | 6.4 | Right | R T11 | 6 |
| 19 | 65 | F | 28 | 10 | Iohexol 300 | 3.0 | Right | None | 1 |
| 20 | 44 | F | 10 | 10 | Iohexol 300 | 3.0 | Left | None | 2 |
| 21 | 40 | F | 12 | 10 | Iodixanol 320 | 3.2 | Left | R T7 | 9 |
| 22 | 30 | M | 16 | 10 | Iohexol 300 | 3.0 | Right | R C8 | 9 |
| 23 | 29 | F | 15 | 10 | Iohexol 300 | 3.0 | Right | None | 0 |
| 24 | 61 | M | 13 | 10 | Iodixanol 320 | 3.2 | Right | None | 0 |
Note:—R indicates right; L, left; en dash, information not available or not measured; M, male; F, female.
General characteristics of the population under study
Safety and Tolerability
No moderate or severe adverse effects were identified in either group following intrathecal contrast administration. There were no cases of hospital admission or emergency department visits related to the adverse events from the CTM immediately after the procedure or in the following 3 months (there were 8 new admissions for transvenous embolization and 4 visits for blood patches). Telephone follow-up information was available for all patients in the 20-mL study group and for most of the control group (4/6), with contact time varying between 24 hours and 5 days after the examination. Two patients in the 20-mL group reported mild erythematous skin reactions in the trunk region, with mild itching approximately 8 and 12 hours after the procedure, both of which were considered delayed mild allergic reactions treated with antihistamines and resolved after 24 and 48 hours, respectively. No other adverse effects were reported. Mild symptoms without the need for medication, either during or immediately after the CTM, such as short-lasting headache or nausea, are considered normal and not routinely entered in the patient’s notes, so they could have been present in either group and could not be compared.
Technical Performance
Differences in intrathecal attenuation in the thoracic spine and in the number of adequately opacified vertebral levels between the control and study groups are shown in Fig 2. The total thoracic attenuation average on the first side examined was 2034 HU in the control group and 2272 HU in the 20-mL group (P = .31). The second contralateral side measurements for these values were 1497 HU and 2007 HU, respectively (P = .02).

Box-and-whisker plots summarizing the technical performance of the 10-mL control and 20-mL study groups. The distribution of average attenuation within the lateral-most part of the thecal sac on the total (A), central (B), and peripheral (C) portions of the thoracic spine is shown. The number of levels adequately opacified by contrast (D) is also shown. Boxplots highlighted using bold lines, Asterisks in A, B, and D indicate groups showing statistically significant differences.
The central thoracic attenuation average (T3 and T9) followed the same pattern, with a smaller non-statistically significant difference on the first side examined (2468 versus 2747 HU; P = .18) and a larger statistically significant difference on the second side examined (1623 versus 2426 HU; P = .001).
The peripheral thoracic attenuation average (C8 and T12) did not show a statistically significant difference between groups, but in both cases, the average attenuation was higher in the 20-mL group (1604 HU versus 1797 HU [P = .6] on the first side, and 1371 HU versus 1589 [P = .45] on the second side). Again, the same trend was noticeable, with a greater difference in attenuation on the second side examined.
For reference, the Online Supplemental Data illustrate the difference in the quality of the opacification relative to the measured attenuation on the lateral part of the thecal sac on different levels.
The average number of vertebral levels with adequate opacification of the dural sac on the first side examined was 12.2 in the control group and 13.1 in the 20-mL group (P = .51). This difference was more pronounced and statistically significant on the second side examined, with 7.2 well-opacified levels in the control group versus 10.7 in the 20-mL group (P = .04).
A total of 10 CVFs were identified in 10 different patients (2 in the control group and 8 in the 20-mL group). Three of these (1 in the control group and 2 in the 20-mL group) were identified on the second side of the examination (Fig 3).

Cases in which a CVF was found on the second side examined. A, Axial CT image shows a left T8 CVF in a patient who had received 20 mL of contrast. B, Axial CT MIP image shows a right T7 CVF in a patient who had received 10 mL of contrast. C, Axial CT image shows a right T9 CVF in a patient who had received 20 mL of contrast. Arrows in all images point to opacified draining veins from the CVFs.
DISCUSSION
Our investigation found that higher volumes of intrathecal IOCM (up to 6.4 g of iodine) were safe and well-tolerated, consistent with previous investigations.5,7,8 Additionally, we found that the higher 20-mL contrast dose improved contrast density and the number of levels well-opacified on the second decubitus scan obtained after turning the patient following the initial decubitus scan. Although not statistically significant in this small sample size, trends toward higher attenuation values and the number of levels adequately opacified on the initial decubitus scan were also observed. These results suggest the need for larger studies capable of assessing rare complications and further evaluating the technical performance and effect on the diagnostic yield in patients with suspected CVF.
In our study, all intrathecal contrast attenuation averages were higher in the 20-mL dose group than in the control group, with larger and statistically significant differences on the second decubitus scan. This difference was more pronounced with the central thoracic average, in which the absolute difference averaged 802 HU higher in the 20-mL group, a 50% increase in attenuation. This difference reflects the gravitationally dependent settling of IOCM when the patient is positioned in the lateral decubitus position with the head and hips elevated with respect to the midthorax.2
Of note, none of the patients who had received 20 mL of IOCM had a central thoracic average of <1500 HU on the second side examined, while one-half of the patients in the control group did. This effect could potentially limit the degree to which the contrast pool can be repositioned to other levels of interest by adjusting the height of the head or hips if such repositioning was needed.
Lower attenuation values could theoretically impair the ability to detect CVFs. Previous literature shows that an increased attenuation, such as that achieved by lateral decubitus myelography, enables the identification of previously unnoticed fistulas.2,3 Specifically, Kranz et al2 described a gain in diagnostic confidence of CVF by performing the CT myelography acquisition with the patient in the lateral decubitus position, which provided a mean increase in intrathecal attenuation of 1215 HU.
The peripheral thoracic attenuation average was higher in the 20-mL group compared with the control group, but the difference was not statistically significant. Although our study may have been underpowered for the inference of these smaller differences, we hypothesize that the number of levels covered by contrast (and thus the average attenuation on peripheral levels) is less influenced by the contrast dose and more by the patient’s position, particularly the degree of lateral concavity formed by the spine (Online Supplemental Data). A high degree of concavity formed by elevating the patient’s hips and head may result in a sharp drop of contrast attenuation outside of the region of dependent contrast layering (Fig 4). While this possibility may occasionally restrict the evaluation of the entire spine in a single acquisition, subsequent manipulation of the hips and head seems to be effective in ensuring a complete assessment. While the initial coverage of IOCM was somewhat unpredictable, shifting the contrast column both cranially and caudally proved highly effective, particularly in the 20-mL group in which the central bolus consistently maintained a strong concentration (Fig 5).

Coronal CT reformats showing the cranial and caudal margins of an IOCM bolus on the first side examined (A) and on the second side examined (B) of a patient who had received 20 mL of IOCM. Notice that a peripheral level may have very poor opacification even if a large and dense bolus of contrast is still present adjacently.

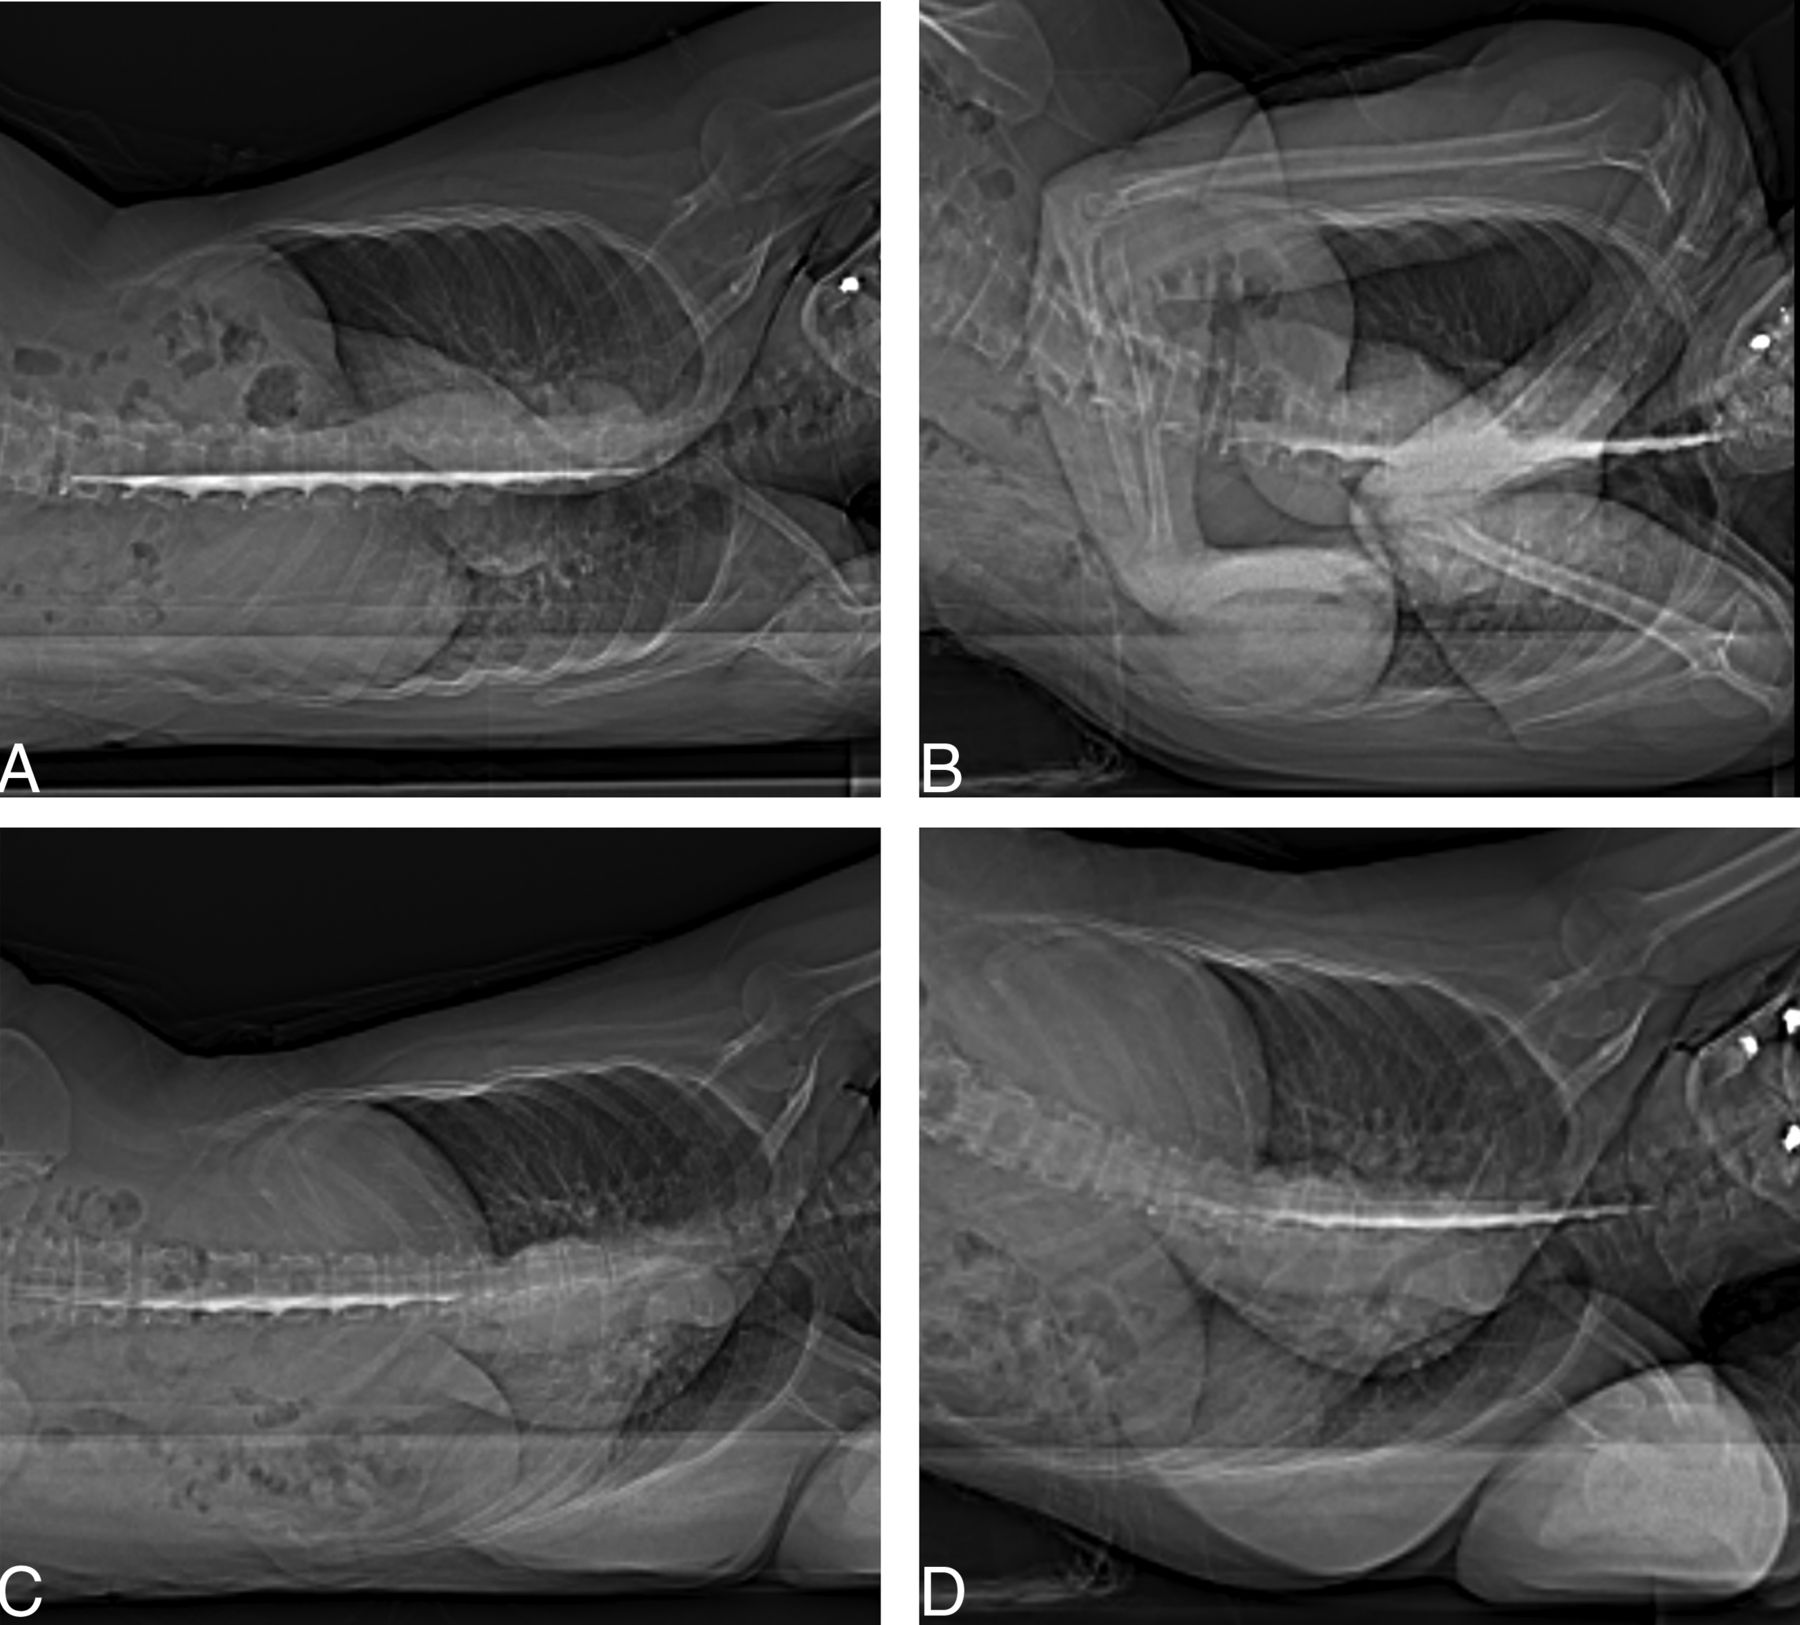
Anterior-posterior scout images of a patient who had received 20 mL of IOCM, demonstrating that the residual contrast bolus stays dense, even after the patient is repositioned a few times. Patient positioning is shown as follows: right decubitus, hips neutral (A); right decubitus, hips elevated (B); left decubitus, hips neutral (C); and left decubitus, hips elevated (D).
One previous article reported that among 48 CVF diagnoses, only one of those came from contralateral decubitus repositioning without a dedicated injection (2% of their diagnoses),11 while, in our population, 33% of cases had such an outcome, a difference that may be explained by our positioning scheme as well as by our increased contrast dose. In addition, we have achieved a 100% diagnostic yield for CVF detection in the high-suspicion subgroup according to brain MR findings, here defined as a Bern score ≥5, which is a yield similar to or higher than that of previous articles using either decubitus digital subtraction myelography or decubitus CT myelography in patients with high Bern scores or positive findings on brain MR when the Bern score was not directly assessed, which all fall in the range of 67%–100%.12⇓⇓⇓–16 Notably, most of these articles relied on dedicated injections on each side. This information could suggest that contralateral repositioning with an increased dose might be equivalent to a dedicated contralateral injection. In fact, in our data, contrast concentration on the second side examined in a 20-mL dose was similar to that of the first side examined with the usual 10-mL dose.
Our study has several limitations. It was retrospective in nature and not randomized, thus subject to confounding. Some possible confounding factors such as patients’ sizes (height and weight) were not considered. Another possible confounding factor was the fact that the 20-mL dose group exclusively received Iodixanol as contrast agent, while the control group mostly used iohexol. However, there is little reason to believe that different IOCMs should differ considerably except for their density/concentration, and concentration of the IOCM used is directly related to the total iodine dose, which was our subject of investigation.
The sample size was small and likely underpowered for some of the associations we tried to evaluate. The small sample size also precluded the evaluation of diagnostic yield. Further studies investigating the diagnostic yield of higher contrast volumes directly or assessing the effect of attenuation values on CVF detection rates would be useful. This particular scan protocol is obtained with a static pool of contrast at the time of scanning and differs from other “dynamic” CTM protocols in which contrast is moving during scanning.7,17 The effect of increased contrast volumes on such dynamic CT myelography protocols may differ. Finally, the small study size limits the ability to detect uncommon safety events.
CONCLUSIONS
The increased volume of intrathecal contrast was well-tolerated and improved the technical performance of LDCTM in this limited series. Further assessment of the safety and impact on diagnostic yield using larger patient cohorts is warranted.
Footnotes
Disclosure forms provided by the authors are available with the full text and PDF of this article at www.ajnr.org.
References
- Received June 19, 2024.
- Accepted after revision July 26, 2024.
- © 2025 by American Journal of Neuroradiology


