
Abstract
BACKGROUND AND PURPOSE: Mass effect and vasogenic edema are critical findings on CT of the head. This study compared the accuracy of an artificial intelligence model (Annalise Enterprise CTB) with consensus neuroradiologists’ interpretations in detecting mass effect and vasogenic edema.
MATERIALS AND METHODS: A retrospective stand-alone performance assessment was conducted on data sets of noncontrast CT head cases acquired between 2016 and 2022 for each finding. The cases were obtained from patients 18 years of age or older from 5 hospitals in the United States. The positive cases were selected consecutively on the basis of the original clinical reports using natural language processing and manual confirmation. The negative cases were selected by taking the next negative case acquired from the same CT scanner after positive cases. Each case was interpreted independently by up-to-three neuroradiologists to establish consensus interpretations. Each case was then interpreted by the artificial intelligence model for the presence of the relevant finding. The neuroradiologists were provided with the entire CT study. The artificial intelligence model separately received thin (≤1.5 mm) and/or thick (>1.5 and ≤5 mm) axial series.
RESULTS: The 2 cohorts included 818 cases for mass effect and 310 cases for vasogenic edema. The artificial intelligence model identified mass effect with a sensitivity of 96.6% (95% CI, 94.9%–98.2%) and a specificity of 89.8% (95% CI, 84.7%–94.2%) for the thin series, and 95.3% (95% CI, 93.5%–96.8%) and 93.1% (95% CI, 89.1%–96.6%) for the thick series. It identified vasogenic edema with a sensitivity of 90.2% (95% CI, 82.0%–96.7%) and a specificity of 93.5% (95% CI, 88.9%–97.2%) for the thin series, and 90.0% (95% CI, 84.0%–96.0%) and 95.5% (95% CI, 92.5%–98.0%) for the thick series. The corresponding areas under the curve were at least 0.980.
CONCLUSIONS: The assessed artificial intelligence model accurately identified mass effect and vasogenic edema in this CT data set. It could assist the clinical workflow by prioritizing interpretation of cases with abnormal findings, possibly benefiting patients through earlier identification and subsequent treatment.
ABBREVIATIONS:
- AI
- artificial intelligence
- AUC
- area under the receiver operating characteristic curve
- CADt
- computer-assisted triage device
- NPV
- negative predictive value
- PPV
- positive predictive value
SUMMARY
PREVIOUS LITERATURE:
The use of artificial intelligence (AI) algorithms to triage and prioritize head CT cases with large vessel occlusion or intracranial hemorrhage is well established. Mass effect and vasogenic edema are similarly critical findings that may require emergent attention, yet there are fewer AI algorithms that identify them. This algorithm, which received US Food and Drug Administration clearance for the identification of both findings as part of computer assisted triage devices (CADt), was the first to do so for vasogenic edema.
KEY FINDINGS:
This standalone model performance assessment demonstrated sensitivity and specificity of at least 89.8% for the identification of each of mass effect and vasogenic edema by an AI algorithm. This performance occurred in both thin and thick series, and a similar performance was maintained across various demographic and technical subgroups.
KNOWLEDGE ADVANCEMENT:
The ability to identify these findings could assist the clinical workflow through prioritizing the interpretation of abnormal cases. The growing number of findings identified by CADt devices also broadens the pool of patients who could benefit from them.
Mass effect and vasogenic edema are critical findings on CT of the head and require emergent medical attention.1⇓-3 Mass effect can be caused by various pathologies including tumor and hemorrhage. It manifests on CT with effacement of the ventricles, basal cisterns, or cerebral sulci; midline shift; and brain herniation, including tonsillar herniation or uncal herniation. Vasogenic edema can similarly be caused by various pathologies and manifests as a deep white matter hypodensity extending into subcortical white matter.
Like the identification of large-vessel occlusion and intracranial hemorrhage on head CT,4,5 the identification of mass effect and vasogenic edema by artificial intelligence (AI) algorithms could assist in clinical care by triaging suspected cases for sooner interpretation and enabling sooner treatment. While there have been at least 15 computer-assisted triage devices (CADt) cleared by the US FDA for intracranial hemorrhage, there are far fewer for mass effect and vasogenic edema.6⇓-8 This article describes the performance of the Annalise Enterprise (CTB module) device, which is available in many non-US regulatory jurisdictions and can identify 130 different radiologic findings on head CT.9 In the United States, the 2 findings of mass effect and vasogenic edema have received FDA clearance as separate devices including being the first CADt device to identify vasogenic edema.10,11
This study was a stand-alone model performance assessment for the identification of mass effect and vasogenic edema: It compared the accuracy of the AI device with consensus neuroradiologists’ interpretations in detecting these findings. Similar to a prior study for intracranial hemorrhage,12 the device was provided separately with thin (≤1.5 mm) and/or thick (>1.5 and ≤5mm) axial series from each case so that the performance on different section thicknesses could be calculated. The performance was also calculated for cases belonging to demographic and technical subgroups to determine the generalizability of the device.
MATERIALS AND METHODS
Study Design
This retrospective stand-alone model performance study was conducted using radiology cases from 5 hospitals within the Mass General Brigham network between 2016 and 2022 using methods similar to those found in a previously published study about intracranial hemorrhage identification.12 The study examined the performance for the binary detection of mass effect and vasogenic edema by the AI model. It was approved by the Mass General Brigham institutional review board with a waiver of informed consent. It was conducted in accordance with relevant guidelines and regulations including the Health Insurance Portability and Accountability Act. This article follows the Standards for Reporting Diagnostic Accuracy (STARD 2015; https://www.equator-network.org/reporting-guidelines/stard/) reporting guidelines.
Case Selection
The cohorts for mass effect and vasogenic edema were selected in a consecutive manner on the basis of the original radiology reports. The cohort size for each of the positive and negative cases was based on powering calculations as described in the statistical analysis section below. The positive cases were identified through a natural language-processing search engine (Nuance mPower Clinical Analytics; https://www.nuance.com/healthcare/diagnostics-solutions/radiology-performance-analytics/mpower-clinical-analytics.html) followed by a manual report review. The negative cases were identified by taking the next negative case acquired on the same CT scanner after the positive cases to avoid temporal and technical bias. The next negative cases were taken after every Nth positive case based on the ratio of positive-to-negative cases to ensure that the principles of consecutive selection applied.
The cohort considered all CT head cases performed at a hospital, including inpatients and outpatients; there were no limitations on the original CT head clinical indication. The CT head cases were obtained from patients at least 18 years of age. The CT head cases were taken from unique patients; only the first CT head from a given patient was included. It was possible for a case to be included in both cohorts (ie, both mass effect and vasogenic edema); there were 8 cases that were included in both cohorts.
All cases were de-identified and underwent an image-quality review by an American Board of Radiology–certified neuroradiologist. The relevant series for the model interpretations were selected at the same time as described under the Series Selection section below. The review was performed using the FDA-cleared eUnity image visualization software (Version 6 or higher; Mach7) and an internal Web-based annotation system that used the REDCap electronic data-capture tools hosted at Mass General Brigam.13,14
Series Selection
The model was provided with a single selected series at the time of model inference. These series were noncontrast thin (≤1.5 mm) and/or thick (>1.5 and ≤5 mm) axial series for each CT head case. The series were selected so that the thin series was the thinnest available series ≤1.5 mm; the thick series was randomized between the thinnest and thickest available series in the range >1.5 and ≤5 mm to ensure representation of series thicknesses across the entire range. The series were selected at the same time as the image-quality review. After series selection, a DICOM metadata review was additionally performed to ensure that the section thickness was within the appropriate range and that there was a consistent section interval (with tolerance of ±0.2 mm).
Ground Truth Interpretations
Ground truth interpretations were performed by up to 3 American Board of Radiology–certified neuroradiologists. They answered whether the relevant finding was “Present” or “Absent.” The definition provided to the neuroradiologists for mass effect was “mass effect as evidenced by effacement of ventricles, basal cisterns or cerebral sulci, midline shift, or brain herniation (eg, tonsillar herniation or uncal herniation).” The definition of vasogenic edema was “deep white matter hypodensity extending into subcortical white matter.” The neuroradiologists also answered whether a “parenchymal abnormality including ischemia/mass/cyst/encephalomalacia” was present. They provided their interpretations independently, without access to the original radiology reports and in different worklist orders. They used the same image-visualization software and annotation system as used in the image-quality review. They had access to the entire CT head case (ie, they were not restricted to the series selected for model inference). For determining consensus interpretations for the presence of mass effect or vasogenic edema, we used a “2 + 1” strategy: The first 2 neuroradiologists interpreted every case and a third neuroradiologist then interpreted cases with discrepant interpretations. A parenchymal abnormality was considered present if either of the first 2 neuroradiologists annotated it as present; the third neuroradiologist was not asked about its presence.
Model Inference
The evaluated AI model was Version 3.1.0 of the Annalise Enterprise CTB Triage Trauma device (https://annalise.ai/annalise-triage/). It is the same AI model used by the Annalise Enterprise (CTB module) device, which is commercially available in some non-US markets and whose development has been previously described.9 In brief, it consists of an ensemble of 5 neural networks with 3 heads: one for classification, one for left-right localization, and one for segmentation. It can identify 130 different radiologic findings and was trained on >200,000 CT head cases, which were each labeled by at least 3 radiologists. These training cases came from 8 different scanner manufacturers and >90 different scanner models. The training cases were completely independent of the cases used for this stand-alone model performance study.
The Annalise Enterprise CTB Triage Trauma device provides only binary classification output about the identification of findings, which is consistent with FDA regulations for CADt devices. The model was installed at Mass General Brigham for use in this study and received only the DICOM-formatted CT head cases. It output a classification score between 0 and 1 for mass effect and vasogenic edema. A binary output for these findings could be derived using prespecified operating points. As part of model inference, the device contains multiple filters to look at attributes of the series to be interpreted to ensure that the model does not perform inference on unsuitable images; in these situations, the device does not produce an output, which is referred to as “unsuccessful model inference” within this study. While not part of the current study, internal bench testing indicated a model turn-around time of 81.6 seconds (95% CI, 80.3–82.9 seconds).10,11
Statistical Analysis
The statistical analysis was performed in R (Version 4.0.2; http://www.r-project.org) on the full analysis set. The predefined end points included the areas under the receiver operating characteristic curves (AUCs) for the identification of mass effect and vasogenic edema for each of the thin and thick series. The AUCs were calculated using the consensus annotations and the classification scores from the AI model. The prespecified end points also included the sensitivity and specificity at predetermined operating points; this article reports the performance at operating points that have received FDA clearance. They were calculated by comparing the binary model output at each operating point with the consensus annotations (ie, by calculating the number of true-positive, false-negative, true-negative, and false-positive cases).
The positive predictive values (PPVs) and negative predictive values (NPVs) were calculated as exploratory analyses at assumed prevalences of 0.05, 0.10, 0.15, and 0.20. The sensitivities and specificities were calculated as exploratory analyses for the subgroups of presence or absence of a parenchymal abnormality. The AUCs, sensitivities, and specificities were calculated as exploratory analyses for the subgroups of sex, age, ethnicity, race, and CT scanner manufacturer. These parameters were derived from clinical databases or DICOM fields for each radiology case. Any missing data were treated as “unknown” or “unavailable,” and no data were imputed.
All CIs were calculated using bootstrapped intervals with 2000 resamples. The sample sizes for each of the findings were powered on the basis of preliminary model results at a balanced operating point to ensure that the lower bound of the 95% CI for sensitivity was >80%, and for specificity, >80%.
RESULTS
Mass Effect
A cohort of 818 CT head cases was selected for the mass effect cohort (Fig 1). This cohort resulted in 650 thin series and 816 thick series for which the model could be evaluated.

Cohort selection diagram for mass effect.
Thin Series.
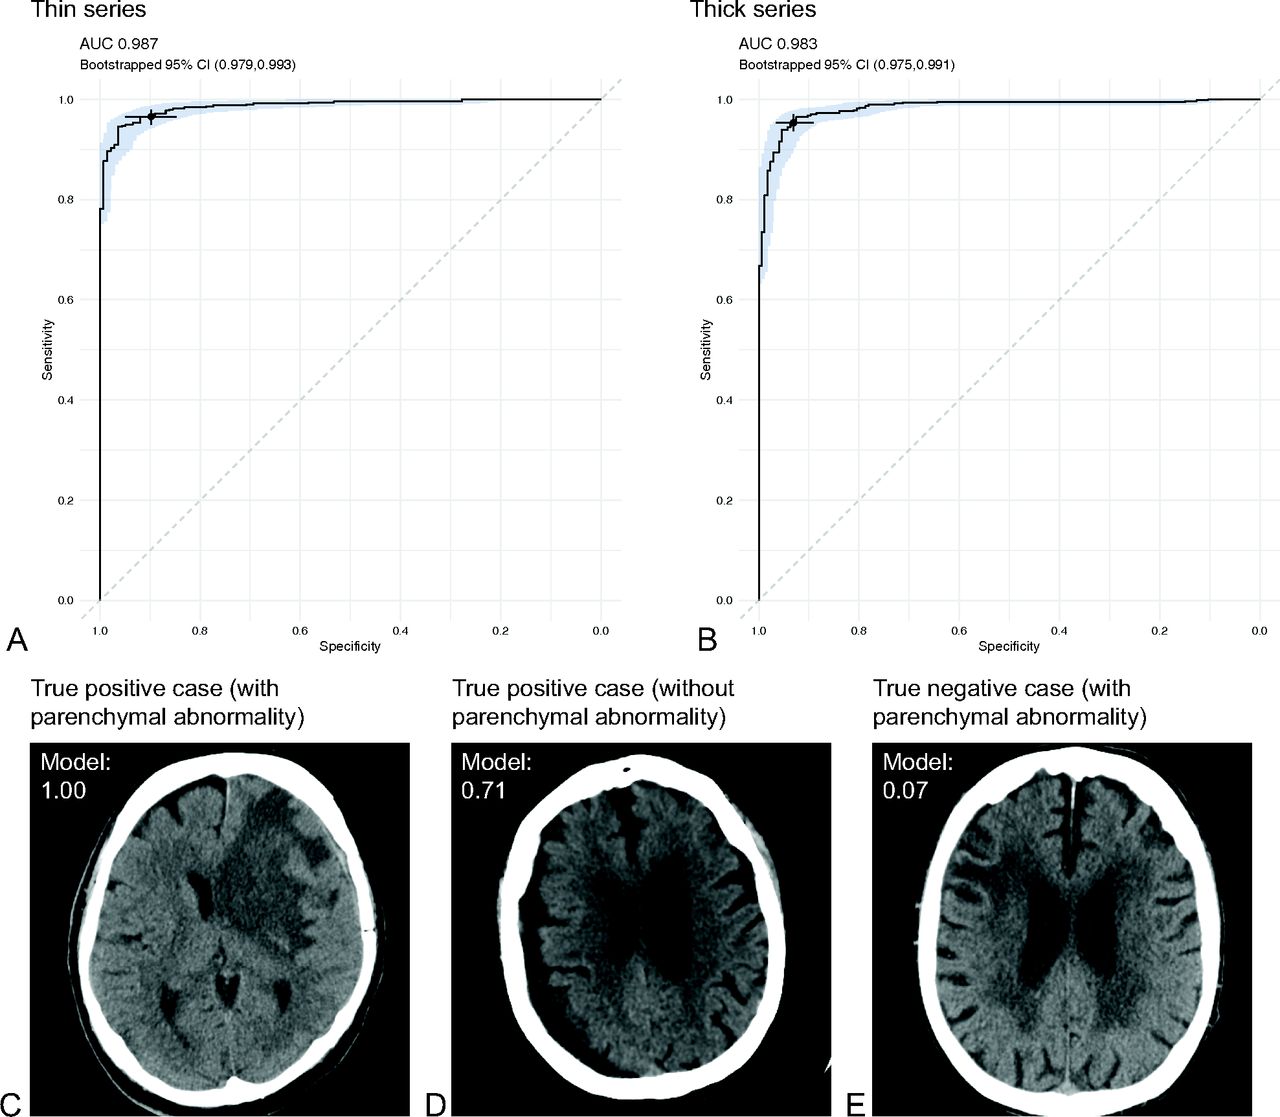
The model successfully performed inference on 632 (97.2%) thin series. This cohort for analysis included 306 (48.4%) women and 326 (51.6%) men, the mean age was 67.2 (SD, 17.5) years, and there were 495 (78.3%) positive cases and 137 (21.7%) negative cases (Online Supplemental Data). The AI model identified mass effect with an AUC of 0.987 (95% CI, 0.979–0.993) (Fig 2A and Table 1). At an operating point of 0.221484, the sensitivity was 96.6% (95% CI, 94.9%–98.2%) and the specificity was 89.8% (95% CI, 84.7%–94.2%). At an assumed prevalence of 0.10, the PPV was 51.2% (95% CI, 40.9%–66.7%) and NPV was 99.6% (95% CI, 99.4%–99.8% (Table 2). The performance was maintained in the presence or absence of a parenchymal abnormality with the model achieving a sensitivity and specificity of at least 80% for both subgroups (Table 3). The performance was broadly consistent across sex, age, ethnicity, race, and manufacturer with all subgroups with at least 5 cases having a sensitivity and specificity of at least 80% (Online Supplemental Data).

Performance for mass effect. Receiver operating characteristic curves for the thin series (A) and thick series (B). The shaded region reflects the bootstrapped 95% CIs. The selected point on each graph reflects the performance at the operating points described in the text. Sample images for a true-positive case with parenchymal abnormality (C), a true-positive case without parenchymal abnormality (D), and a true-negative case with parenchymal abnormality (E). The model classification score output is provided for each case.
Model performance summary for identifying mass effecta
PPVs And NPVs at different levels of assumed prevalence for identifying mass effect and vasogenic edemaa
Sensitivity and specificity for subgroups based on the presence or absence of a parenchymal abnormalitya
Thick Series.
The model successfully performed inference on 770 (94.4%) thick series. This cohort for analysis included 356 (46.2%) women and 414 (53.8%) men, the mean age was 66.5 (SD,17.3) years, and there were 596 (77.4%) positive cases and 174 (22.6%) negative cases (Online Supplemental Data). The AI model identified mass effect with an AUC of 0.983 (95% CI, 0.975–0.991) (Fig 2B and Table 1). At an operating point of 0.160195, the sensitivity was 95.3% (95% CI, 93.5%–96.8%) and the specificity was 93.1% (95% CI, 89.1%–96.6%). At an assumed prevalence of 0.10, the PPV was 60.6% (95% CI, 49.4%–75.0%) and NPV was 99.4% (95% CI, 99.2%–99.6%) (Table 2). The performance was maintained in the presence or absence of a parenchymal abnormality with the model achieving a sensitivity and specificity of at least 80% for both subgroups (Table 3). The performance was broadly consistent across sex, age, ethnicity, race, and manufacturer with all subgroups with at least 5 cases having a sensitivity and specificity of at least 80% (Online Supplemental Data).
Vasogenic Edema
A cohort of 310 CT head cases was selected for the vasogenic edema cohort. This cohort resulted in 174 thin series and 309 thick series for which the model could be evaluated (Fig 3).

Cohort selection diagram for vasogenic edema.
Thin Series.
The model successfully performed inference on 169 (97.1%) thin series. This cohort for analysis included 77 (45.6%) women and 92 (54.4%) men, the mean age was 65.6 (SD, 19.7) years; there were 61 (36.1%) positive cases and 108 (63.9%) negative cases (Online Supplemental Data). The AI model identified vasogenic edema with an AUC of 0.980 (95% CI, 0.961–0.993; Fig 4A and Table 1). At an operating point of 0.145352, the sensitivity was 90.2% (95% CI, 82.0%–96.7%) and the specificity was 93.5% (95% CI, 88.9%–97.2%). At an assumed prevalence of 0.10, the PPV was 60.7% (95% CI, 46.4%–82.4%) and NPV was 98.8% (95% CI, 97.9%–99.7%) (Table 2). The performance was maintained in the presence or absence of a parenchymal abnormality with the model achieving a sensitivity and specificity of at least 80% for both subgroups (Table 3). The performance was broadly consistent across sex, age, ethnicity, race, and manufacturer with all subgroups with at least 8 cases having a sensitivity and specificity of at least 80% (Online Supplemental Data).

Performance for vasogenic edema. Receiver operating characteristic curves for the thin series (A) and thick series (B). The shaded region reflects the bootstrapped 95% CIs. The selected point on each graph reflects the performance at the operating points described in the text. Sample images for true-positive cases with parenchymal abnormality (C) and true-negative case with parenchymal abnormality (D). The model classification score output is provided for each case.
Thick Series.
The model successfully performed inference on 301 (97.4%) thick series. This cohort for analysis included 148 (49.2%) women and 153 (50.8%) men, the mean age was 64.6 (SD, 19.9) years, and there were 100 (33.2%) positive cases and 201 (66.8%) negative cases (Online Supplemental Data). The AI model identified vasogenic edema with an AUC of 0.988 (95% CI, 0.977–0.995) (Fig 4B and Table 1). At an operating point of 0.145352, the sensitivity was 90.0% (95% CI, 84.0%–96.0%) and the specificity was 95.5% (95% CI, 92.5%–98.0%). At an assumed prevalence of 0.10, the PPV was 69.1% (95% CI, 57.1%–84.5%) and NPV was 98.9% (95% CI, 98.1%–99.5%) (Table 2). The performance was maintained in the presence or absence of a parenchymal abnormality with the model achieving a sensitivity and specificity of at least 80% for both subgroups (Table 3). The performance was broadly consistent across sex, age, ethnicity, race, and manufacturer with all subgroups with at least 2 cases having a sensitivity and specificity of at least 80% (Online Supplemental Data).
DISCUSSION
This retrospective stand-alone model performance study assessed the ability of an AI device to identify mass effect and vasogenic edema on head CT. For mass effect, the AI device achieved an AUC of 0.987 on the thin series and an AUC of 0.983 on the thick series. For vasogenic edema, it achieved AUC 0.980 on thin series and AUC 0.988 on thick series. These AUCs, as well as the lower bounds of their 95% CIs, are in excess of the benchmark AUC of 0.95 that the FDA uses for CADt devices cleared under the QFM product code.15 Both devices also had operating points that corresponded to a sensitivity and specificity of at least 89.8%. These sensitivities and specificities, as well as the lower bounds of their 95% CIs, are in excess of the benchmark sensitivity of 80% and specificity of 80% that the FDA commonly uses for CADt devices cleared under the QAS product code (which was the product code through which these 2 findings were cleared).10,11,16
The proposed benefit of CADt devices is that they are “intended to aid in prioritization and triage of radiological medical images”17 such that clinicians will be aware of abnormal studies sooner and can commence subsequent management steps. There are 2 other CADt devices that the FDA has approved for the identification of mass effect. The NinesAI device detects mass effect with a sensitivity 96.4% and a specificity 91.1%.7 The qER device detects mass effect with sensitivity 96.39% and specificity 96.00% and midline shift with a sensitivity 97.34% and specificity 95.36%.6 The current results are consistent, while noting that the cohorts for the assessment of each algorithm are different and therefore prevent direct comparison.
One of the ongoing challenges with CADt devices cleared by the FDA is that the regulation states that the “device does not mark, highlight, or direct users’ attention to a specific location in the original image.”17 This assessment was, therefore, based on only the binary identification of mass effect or vasogenic edema and did not incorporate a localization or segmentation analysis. As we have described previously, a localization output including a segmentation or heat-map could assist with explainability by demonstrating what the model has identified, especially when a user suspects the algorithm has falsely identified a finding (ie, a false-positive case).12,18,19 The growing number of head CT findings that can be identified by CADt devices paves the way for the application of AI in radiology to use cases requiring a broader identification of findings such as report writing.
This device demonstrated robust performance across sex, age, ethnicity, race, and manufacturer subgroups. It achieved a sensitivity and specificity of at least 80% whenever there were at least 8 cases within a subgroup. This performance suggests that the device is generalizable for different patient demographics and technical parameters. The device will, however, encounter new scenarios when used in the clinical environment, and its ongoing performance should continue to be monitored. The device reassuringly also appeared to differentiate between an underlying parenchymal abnormality and mass effect or vasogenic edema, as suggested by its ability to maintain a specificity of >80% even when a parenchymal abnormality was present.
As we have described for similar stand-alone model performance assessments, a key limitation of this study is that it is retrospective and outside the clinical workflow.12,18 It, therefore, establishes the accuracy of the model in identifying mass effect and vasogenic edema but does not assess its impact on the clinical workflow, including for benefit on patients’ outcomes. We view this initial step as a prerequisite to ensure that the device has the potential to provide clinical benefit. Further evaluation will be required to prove such a benefit.
CONCLUSIONS
This stand-alone model performance assessment investigated the ability of an AI device to identify mass effect and vasogenic edema on head CT. It demonstrated performance that exceeded the FDA benchmarks for CADt devices. Its use could lead to improved care and outcomes for patients with these findings.
Acknowledgments
The authors thank the broader Mass General Brigham Data Science Office and Annalise-AI teams for their assistance with this project.
Footnotes
Disclosure forms provided by the authors are available with the full text and PDF of this article at www.ajnr.org.
This study was funded by Annalise-AI. Annalise-AI were involved in the design and conduct of the study; preparation, review, or approval of the manuscript; and decision to submit the manuscript for publication. Annalise-AI were not involved in the collection, management, analysis, and interpretation of the data. I.N.C., S.F.M., J.K.C., A.G., M.A.H., A.L.M., K.B., J.C., W.A.M., S.P., S.R., K.J.D., B.C.B., J.M.H. are employees of Mass General Brigham and/or Massachusetts General Hospital, which had received institutional funding from Annalise-AI for the study.
Access to data and data analysis: J.M.H. had full access to all the data in the study and takes responsibility for the integrity of the data and the accuracy of the data analysis. S.F.M. performed the statistical analyses.
B.C. Bizzo and J.M. Hillis share senior authorship.
References
- Received February 19, 2024.
- Accepted after revision May 22, 2024.
- © 2024 by American Journal of Neuroradiology


Jump to section
Related Articles
Cited By...
- No citing articles found.