
Abstract
BACKGROUND AND PURPOSE: Following endovascular thrombectomy in patients with large-vessel occlusion stroke, successful recanalization from 1 attempt, known as the first-pass effect, has correlated favorably with long-term outcomes. Pretreatment imaging may contain information that can be used to predict the first-pass effect. Recently, applications of machine learning models have shown promising results in predicting recanalization outcomes, albeit requiring manual segmentation. In this study, we sought to construct completely automated methods using deep learning to predict the first-pass effect from pretreatment CT and MR imaging.
MATERIALS AND METHODS: Our models were developed and evaluated using a cohort of 326 patients who underwent endovascular thrombectomy at UCLA Ronald Reagan Medical Center from 2014 to 2021. We designed a hybrid transformer model with nonlocal and cross-attention modules to predict the first-pass effect on MR imaging and CT series.
RESULTS: The proposed method achieved a mean 0.8506 (SD, 0.0712) for cross-validation receiver operating characteristic area under the curve (ROC-AUC) on MR imaging and 0.8719 (SD, 0.0831) for cross-validation ROC-AUC on CT. When evaluated on the prospective test sets, our proposed model achieved a mean ROC-AUC of 0.7967 (SD, 0.0335) with a mean sensitivity of 0.7286 (SD, 0.1849) and specificity of 0.8462 (SD, 0.1216) for MR imaging and a mean ROC-AUC of 0.8051 (SD, 0.0377) with a mean sensitivity of 0.8615 (SD, 0.1131) and specificity 0.7500 (SD, 0.1054) for CT, respectively, representing the first classification of the first-pass effect from MR imaging alone and the first automated first-pass effect classification method in CT.
CONCLUSIONS: Results illustrate that both nonperfusion MR imaging and CT from admission contain signals that can predict a successful first-pass effect following endovascular thrombectomy using our deep learning methods without requiring time-intensive manual segmentation.
ABBREVIATIONS:
- AIS
- acute ischemic stroke
- DL
- deep learning
- EVT
- endovascular thrombectomy
- FPE
- first-pass effect
- IQR
- interquartile range
- LVO
- large-vessel occlusion
- ML
- machine learning
- MNT-DL
- multisequence neighborhood transformer model
- mTICI
- modified TICI
- ROC-AUC
- receiver operating characteristic area under the curve
- SSL
- self-supervised learning
SUMMARY SECTION
PREVIOUS LITERATURE:
Many studies have shown that the first-pass Effect is associated with positive long-term outcomes for acute ischemic patients with stroke who underwent endovascular thrombectomy. Recently, a few studies tried to predict FPE by using baseline imaging and clot segmentation and achieved moderate performance.
KEY FINDINGS:
Deep learning models developed in this study show promising performance in predicting FPE by using both pretreatment baseline CT and MR imaging. Clot segmentation is not necessary to restrict the input, thus saving labor costs and reducing variance from manual segmentation by different readers.
KNOWLEDGE ADVANCEMENT:
Fully automated end-to-end deep learning models can accurately model the relationship between pretreatment imaging and FPE in patients with AIS. If fully validated externally on a larger cohort, the model can provide physicians with extra information regarding outcomes before EVT for better procedure planning.
In patients with anterior circulation large-vessel occlusion (LVO) stroke, endovascular thrombectomy (EVT) has been approved as an effective therapy. It is now recommended for patients up to 24 hours from stroke onset.1,2
EVT is considered successful if blood flow is deemed completely or near-completely restored to the brain region affected by the stroke. This restoration is quantified by the modified TICI (mTICI) score, which is assessed both during the EVT procedure and on completion.3⇓-5 Clinical trials have illustrated that patients who experience near-total or total recanalization of the blood vessels typically have better outcomes, particularly if recanalization is achieved on the first attempt, known as the first-pass effect (FPE).6⇓⇓-9
Successful recanalization of EVT among patients with stroke varies despite shared and common clinical presentations and procedural factors. This issue has been the target of several investigations to elucidate the mechanisms underlying a patient’s likelihood of successful recanalization.10⇓-12 Some underlying factors include onset-to-EVT time14 and identification of penumbral tissue via MR imaging or CT, which can inform treatment outcomes. Additionally, compensatory flow from the pial collateral circulation strongly correlates with prognosis post-EVT.13,15,16 The current American Heart Association/American Stroke Association stroke guidelines weakly recommend advanced imaging to assess a patient’s collateral status.17
Machine learning (ML) and regression models have been used to predict successful recanalization with variable prediction performances.18–24 These prediction models required manual segmentation of the clot by an expert neuroradiologist.22,25–27 The time-intensive task of manual segmentation across a volume may not be compatible with current clinical guidelines such as the Target: Stroke Phase III campaign, which recommends a door-to-needle time for EVT within 90 minutes of direct admission and 60 minutes of patient transfer.28,29
In this study, we aimed to construct models that can automatically predict successful recanalization, particularly the FPE. We adopted 2 new strategies to add to the current body of literature: 1) We hypothesize that deep learning (DL) may extract helpful information from pretreatment imaging that can predict FPE without the need for manual segmentation, commonly used in other ML approach models. 2) Almost all previous models predicting FPE from pretreatment imaging have used NCCT and/or CTA. Given the multidimensional and multimodal nature of MR imaging, we explored the potential existing rich information in MR imaging that may be relevant to the success of recanalization.
We report performance metrics for 2 cohorts of patients: those who underwent CT and those with pretreatment MR imaging. We designed a framework tailored to the small sample size and the thick-section nature of pretreatment stroke imaging. We incorporated contrastive learning to pretrain the model by leveraging a larger imaging dataset of patients with acute ischemic stroke (AIS) who do not satisfy our study criteria, thus enabling the model to better generalize on a small data set. To the best of our knowledge, this is the first study to apply DL algorithms with pretreatment MR imaging and CT to predict the FPE.
MATERIALS AND METHODS
Ethical Compliance
This study was approved by the UCLA Health institutional review board No. 3 under IRB#18–000329. Patient records were collected following institutional review board and Health Insurance Portability and Accountability Act compliance standards. Informed consent was waived under Exemption 4 for retrospective data. The internal institutional data set used in this study is not publicly available due to limits set by our study institutional review board. We are willing to validate other models internally on our data as part of collaborations. The program code (preprocessing and modeling) is available at https://github.com/zhanghaoyue/DeepLearningFirstPassEffect, and derived data (eg, model weights) will be available on reasonable request.
Data Set
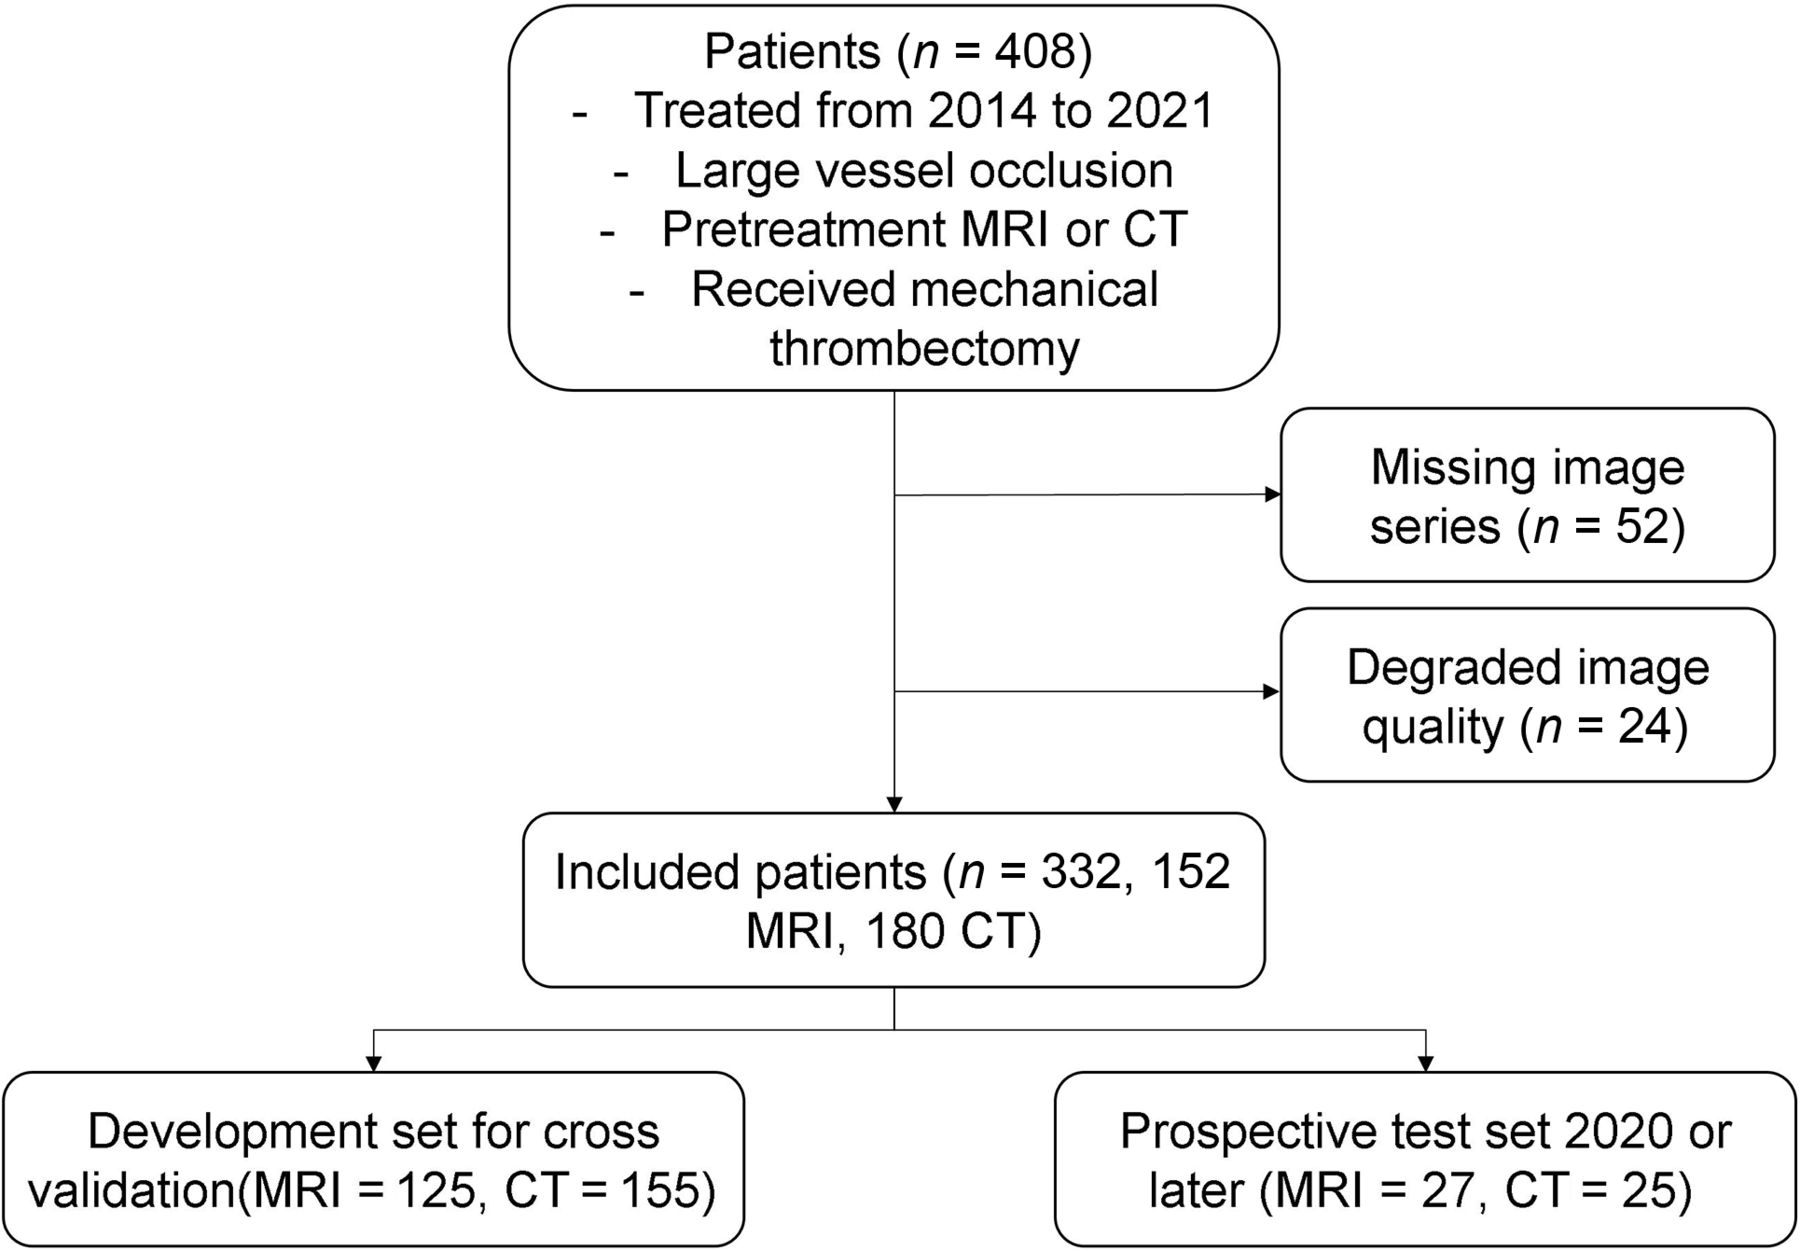
In this retrospective study, we reviewed consecutive patients with AIS who were treated at UCLA Ronald Reagan Medical Center from 2014 to 2021. Patients were included if they had the following: 1) a diagnosis of anterior circulation LVO AIS, 2) an adequate-quality pretreatment MR imaging or CT under stroke imaging protocol, and 3) EVT. Exclusion criteria were as follows: the presence of significant hemorrhage and image-registration errors resulting from significant midline shift or motion artifacts. The patient inclusion workflow diagram is shown in Fig 1.

Patient flow chart illustrating the inclusion criteria for this study.
Baseline demographic and clinical data, including age, sex, NIHSS score at admission, time from stroke onset, performance of IV thrombolysis, and grade of mTICI, were recorded for each patient in our stroke registry by board-certified neurologists and neurointerventionalists who were treating the patients with stroke. EVT was performed by our neurointerventionalists using FDA-approved thrombectomy devices at their discretion and in accordance with current technical standards. As part of the EVT protocol at UCLA Ronald Reagan Medical Center, mTICI was assessed during the procedure after each clot retrieval pass by the performing neurointerventionalist. Successful recanalization was defined as mTICI of 2b, 2c, or 3.
Comparative analysis was performed between patients who did or did not achieve FPE using the χ2 test, Student t test, and Wilcoxon rank-sum test as appropriate. All statistical analysis was performed using R software 4.1.3 (https://www.r-project.org).
MR Imaging Acquisition and Preprocessing
MR imaging was acquired on 1.5T (Avanto, Siemens, Erlangen, Germany) and 3T (Trio, Siemens, Erlangen, Germany) echo-planar MR imaging scanners with 12-channel head coils (Siemens). In the stroke MR imaging of the brain admission protocol, the DWI and FLAIR sequences were acquired using the following parameters: DWI: TR = 4000–9000 ms, TE = 78–122 ms, corresponding pixel dimensions = 0.859 × 0.859 × 6.000 to 1.850 × 1.850 × 6.500 mm; FLAIR: TR = 8000–9000 ms, TE = 88–134 ms, corresponding pixel dimensions 0.688 × 0.688× 6.000 to 0.938 × 0.938× 6.500 mm. ADC maps were calculated from DWI B0 and DWI b=1000 using the following formula:
where Sb1000 and Sb0 are the intensity values of DWI b=1000 and DWI B0 images.
From MR imaging, the series used included DWI, FLAIR, and ADC sequences. Automated preprocessing steps described in Zhang et al30 were performed to segment vascular regions for stroke. Briefly, all sequences were subjected to N4-bias field correction using the Advanced Normalization Tools (ANTs) library (http://stnava.github.io/ANTs/),22,31 intensity normalization, and histogram matching. Finally, registration to Montreal Neurological Institute space enabled the use of a vascular territory atlas for stroke-region localization.
CT Acquisition and Preprocessing
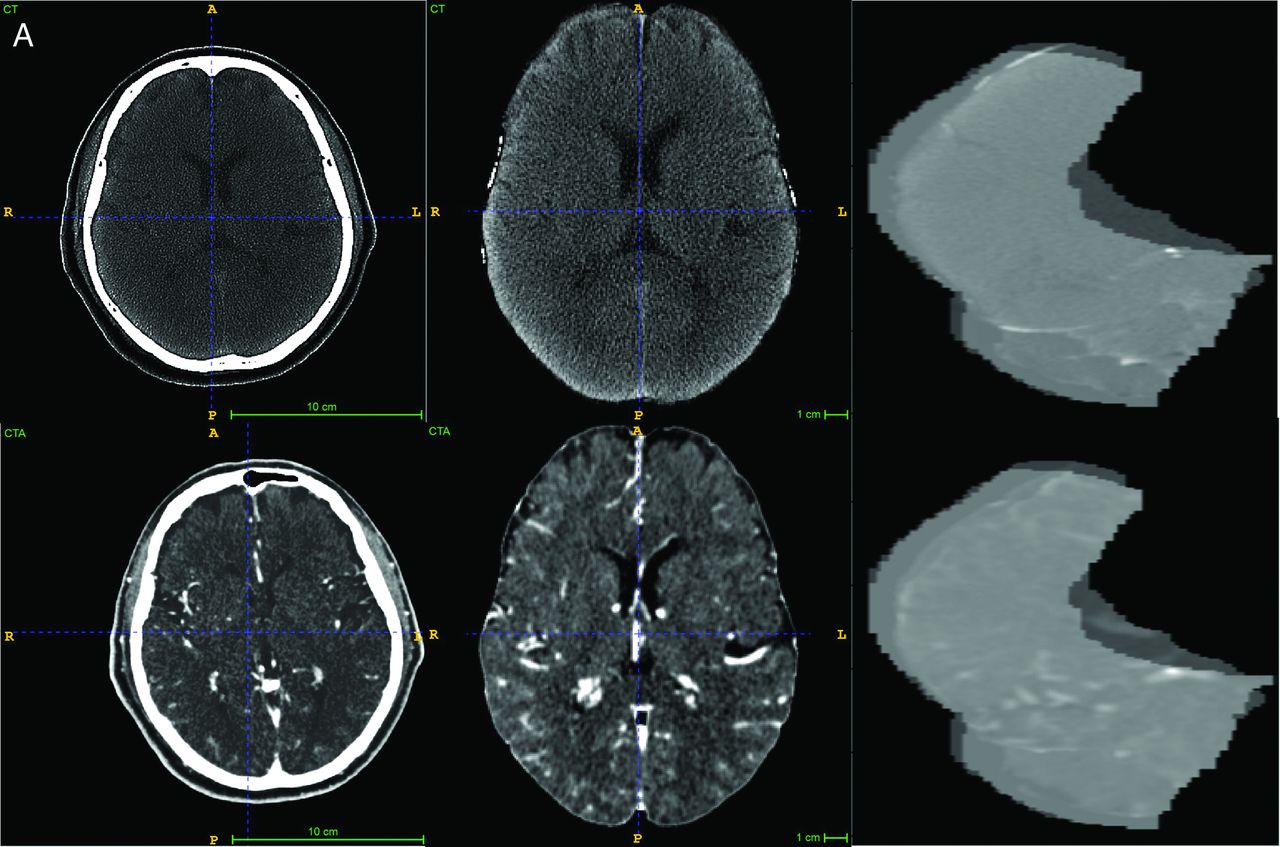
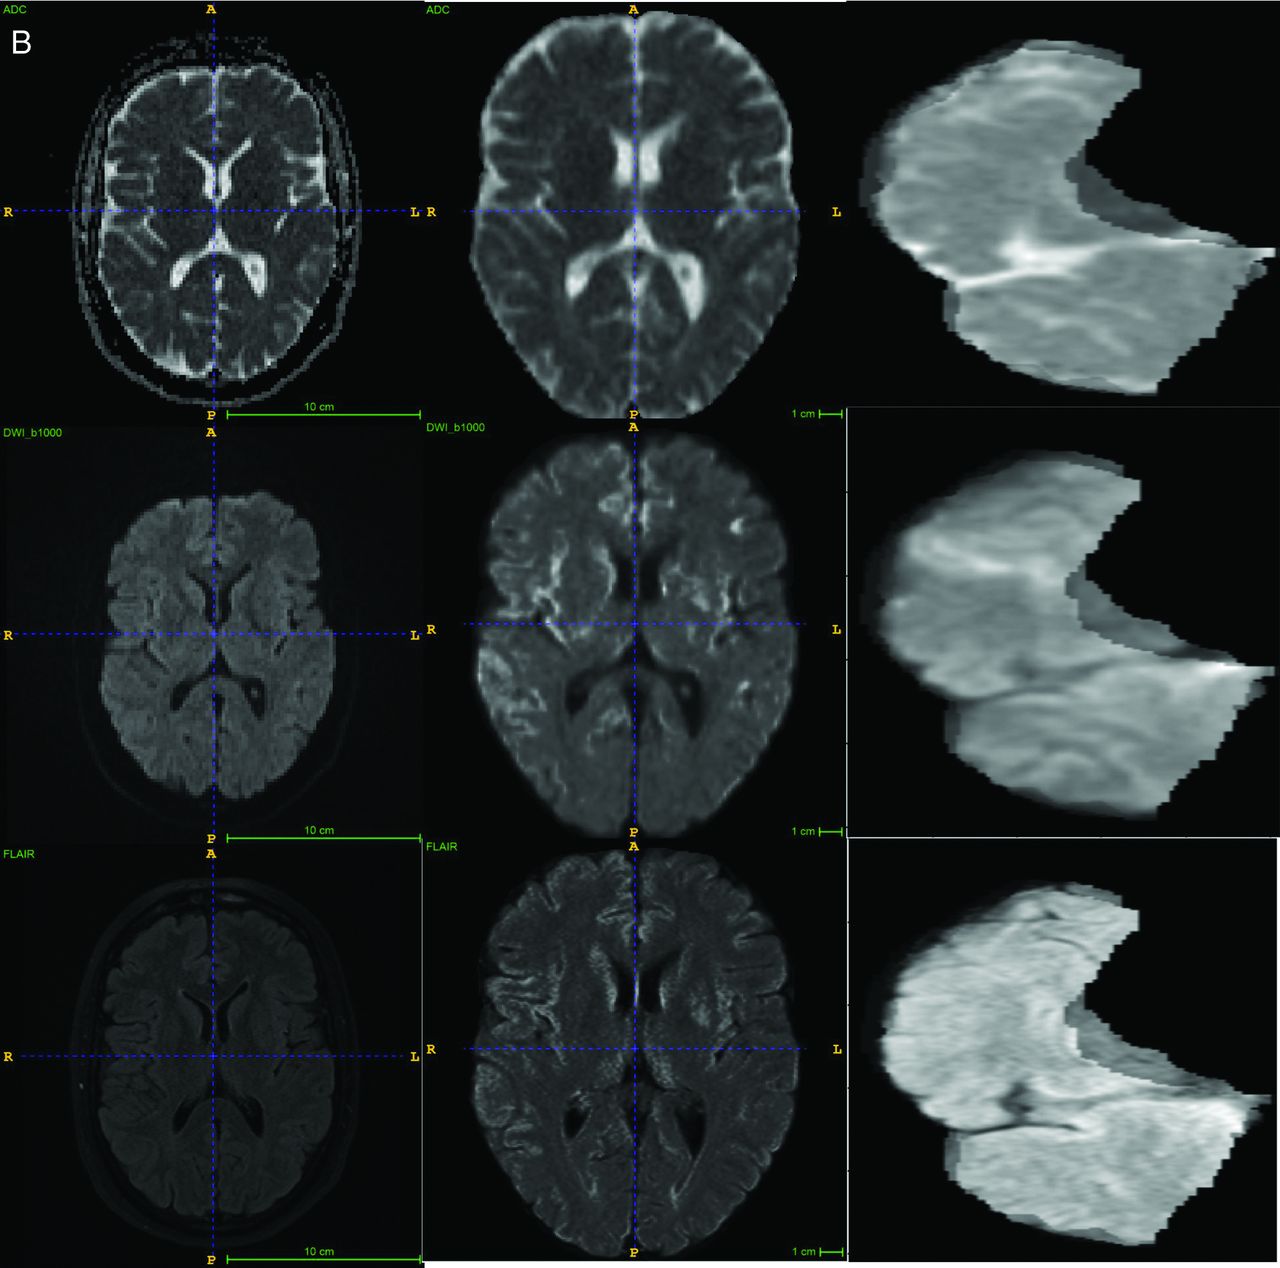
Two CT scanners, a Lightspeed VCT (GE Healthcare) and a Somatom Definition (Siemens), were used for CT. After administering 50 mL of contrast agent IV at 5 mL/s, a single-phase CTA was obtained (120 kV, 120 reference mAs, 0.3-second rotation time, 0.6 pitch, effective dose of about 3 mSv). Both NCCT and CTA series were included as input for the imaging-based models. The preprocessing protocol for CT images included field-of-view removal, skull-stripping, and registration to Montreal Neurological Institute space. Sample CT and MR imaging original images and the processed input are shown in Fig 2.


A, Examples of CT images, preprocessing, and final regional input section. B, Examples of MR images, preprocessing, and final regional input section.
DL Model Architecture
The proposed DL model is an end-to-end trainable network consisting of both convolutional and attention-based components, namely the multisequence neighborhood transformer model (MNT-DL). The MNT-DL is a hybrid transformer architecture incorporating modifications and enhancements to the widely used ResNet34 backbone. Each convolutional block is modeled after ResNet residual blocks, consisting of the following sequences: convolutional kernel, batch normalization, rectified linear unit activation function, second convolutional kernel, and second batch normalization. The first component is a global feature extractor using the first stage of ResNet, which leverages residual convolutional blocks to extract low-level features from each section. These section-level features are fed into 5 local networks from the top to bottom of the brain, which learn representations of adjacent slices and share weights during training, therefore learning regional information during training. Within this local network, a self-attention module is added to determine the salient regions within each section. The nonlocal self-attention module uses a 1 × 1 convolution on the intermediate features to generate single-head attention for each image patch, computing attention with respect to all other patches. These are aggregated using matrix multiplication and SoftMax activation. The self-attention module was included in the network for its self-contained nature, meaning that it can be inserted into existing architectures without a substantial increase in computation.
If we followed the local networks, outputs are fed into the volumetric classifier consisting of 2 modules. The first is a cross-attention module using recent advances in vision transformers. The low-level features from every section are fed into the module, which uses multi-head attention operations from basic transformer architecture to generate section-level importance. Resembling other attention modules, including nonlocal attention, multi-head attention consists of a linear layer to generate attention across several scales of the image volume. The attention operations are fused using cross-attention, wherein the features from each scale are exchanged via layer normalization and residual connection. The use of this module in the network enables the model to weigh the slices more heavily for the final prediction while adding limited computational complexity. This attention output and the output from the local networks are fed into a linear layer that serves as the final classifier, generating the volume-level prediction.
DWI-FLAIR-ADC or NCCT-CTA sequences are used as channels to input into the MNT-DL for MR imaging or CT input. Single-sequence inputs are also used to develop corresponding models (ADC-DL, DWI-DL, FLAIR-DL, NCCT-DL, CTA-DL) for ablation studies, in which the single sequences are stacked to fit into the same channel requirement for corresponding models.
Contrastive Self-Supervised Learning
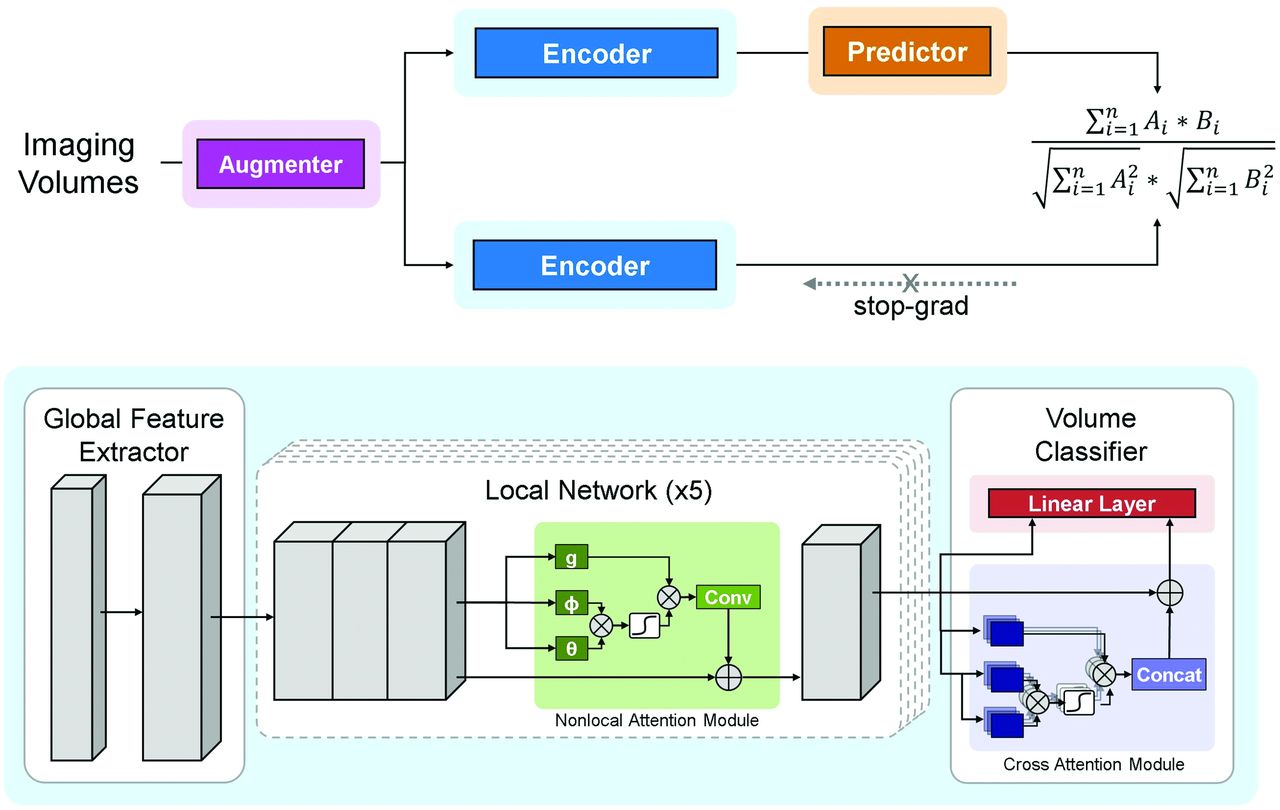
Although we use multiple model designs tailored for small sample sizes in DL training, the DL training is still limited by the labeled data for MR imaging and CT. Therefore, we adapted a contrastive self-supervised learning (SSL) approach called SimSiam (https://github.com/facebookresearch/simsiam)23 to our proposed model. SimSiam does not require a large batch size, negative sample pairs, or a momentum encoder. Under this approach, we facilitate more imaging data from our institutional stroke registry that do not meet the inclusion criteria of this study and further improve the performance of the model. The model architecture and SSL framework are shown in Fig 3.

Overview of the DL framework. The upper part represents the contrastive self-supervised learning framework. The lower part represents the proposed neighborhood transformer model and the classification head. Conv indicates convolutional block; Concat, concatenation operation.
Loss Function
The loss function used in this work was based on binary cross-entropy, defined as
 where L is binary cross-entropy loss. The fusion loss, Lfusion, denotes the loss of the final output of the global network. In addition, the loss is computed for the intermediate output of each local network Lsubnetx. The losses Lsubnet1, Lsubnet2, Lsubnet3, Lsubnet4, and Lsubnet5 are added and combined with Lfusion using the weighting factor γ. In this study, the weighting factor was set at 0.5 to give equal weights between the final output loss and the sum of local network losses.
Training and Evaluation
Models were evaluated for their ability to predict a binarized label for each patient. A patient was given a positive label if he or she had an mTICI score of 2b, 2c, or 3 after 1 pass during EVT. Patients who achieved recanalization in several attempts or who did not achieve successful recanalization were assigned a negative label. The MR imaging and CT cohorts were segmented into retrospective development and prospective evaluation groups. Patient images were included in the prospective cohort if the patient underwent EVT in 2020 or later. The development groups were each split into 5 folds for cross-validation. The model was trained for 100 epochs in each fold with early stopping using the AdamW optimizer (https://keras.io/api/optimizers/adamw/).32 The learning rate was set to 0.0005, and the weight decay33 was set to 0.05. The training was implemented using Pytorch 1.9.0 (https://pytorch.org/blog/pytorch-1.9-released/) on an NVIDIA DGX-2 (https://en.wikipedia.org/wiki/Nvidia_DGX). Following the development and hyperparameter tuning, algorithms were evaluated on the corresponding prospective evaluation cohort. Receiver operating characteristic area under the curve (ROC-AUC) was reported accordingly. Sensitivity, specificity, and accuracy were calculated using Youden J statistics34 from the ROC curve.35 All metrics were reported as mean (SD) on the evaluation set for each cohort.
RESULTS
Patient Characteristics
Among 408 patients who met the inclusion criteria, a total of 76 patients were excluded due to missing image series (n = 52) or degraded image quality preventing preprocessing (n = 24). From this final cohort of 332 patients, 152 underwent MR imaging and 180 underwent CT before EVT.
The cohort had an average age of 71.49 (SD, 15.94) years and was 54.22% women. Of this cohort, 80 patients experienced a stroke within 24 hours of the last-known-well time but had an indeterminable onset time. Among patients with a known onset time, 168 (50.60%) underwent imaging within the 4.5-hour window and 185 (55.72%) underwent contrast MR imaging or CT within 6 hours. The median NIHSS score on admission was 16 (interquartile range [IQR], 10–20). Before EVT, 96 patients (28.92%) received IV thrombolytic therapy.
The clinical, imaging, and procedural characteristics of the cohort are listed in Table 1. Additional clinical variables and differences between the MR imaging and CT cohorts are summarized in Table 1. There are no statistical differences in sex and age between the MR imaging and CT groups, but there are differences in the NIHSS score and IV thrombolysis received before EVT. Although the 2 groups have similar median IQRs for the NIHSS, the distribution skewness caused a statistically significant difference. There are more patients who received IV thrombolysis (33.89%) in the CT group than in the MR imaging group (23.03%), partially due to more cases with an unknown onset time in the MR imaging group (27.63% versus 21.11%). Higher stroke-onset-to-imaging time is observed in the MR imaging group, but the ratios of patients whose stroke-onset time is within 4.5 hours or 6 hours are similar in both the MR imaging and CT groups. The EVT outcomes are similar in both the MR imaging and CT groups, and the successful FPE to non-FPE is close to balanced (44.08% in MR imaging and 40.56% in CT) for model development.
Demographics of patients included in model development. Table 1: Clinical characteristics of patient cohorta
For the self-supervised pretraining stage, we collected 599 MR images and 475 CT scans from the UCLA Radiology Department stroke registry that met image sequence and quality requirements for the preprocessing steps in our study but did not qualify for the EVT study due to different treatment triage, missing basic clinical information, and so forth.
Model Performance
The 5-fold cross-validation performance of the DL models on MR imaging is summarized in Table 2. The ROC-AUC of the MNT-DL was higher than those of single-sequence models (ADC-DL, DWI-DL, FLAIR-DL), achieving a mean ROC-AUC of 0.7505. Adding SSL further improved the ROC-AUC to 0.8506. Similarly, as shown in Table 3, the MNT-DL for CT images achieved an ROC-AUC of 0.7801, higher than both NCCT and CTA single-sequence models (NCCT-DL and CTA-DL). SSL further improved the ROC-AUC of the MNT-DL to 0.8719. The performance of the DL models on MR imaging and CT for both prospective test sets is summarized in Table 4. When applied to the MR imaging series, the DL model achieved an average ROC-AUC of 0.7967, with an accuracy of 0.7774 on the prospective test set. The ROC curves are shown in Fig 4. The model outperformed the previous method, notably achieving near-perfect specificity across experimental replicates while maintaining high sensitivity. In the prospective CT evaluation set, the DL method performed similarly, yielding a mean ROC-AUC of 0.8051 and an accuracy of 0.8080. Compared with the literature, this model achieved slightly lower average accuracy, though with a substantially smaller confidence interval. While the accuracy was marginally lower, the model achieved a more balanced sensitivity and specificity of 0.8615 and 0.7500, respectively, compared with the previous model that achieved high specificity at the expense of very low sensitivity.

Mean ROC curve for both the MR imaging and the CT prospective test set.
Ablation study on MR imaging cross-validation folds
Ablation study on CT cross-validation folds
DL model performance on prospective MR imaging and CT test set
DISCUSSION
The FPE has been shown to correlate with improved functional outcomes for patients with AIS.9,36,–,41 Establishing a reliable predictive relationship between pretreatment imaging and FPE is crucial for better EVT strategy planning. In this study, we explored the capacity of pretreatment imaging to predict the likelihood of a FPE during EVT. This study presents the first algorithm to predict a FPE using MR imaging or CT obtained from patient pretreatment imaging by applying DL approaches.
Important information from standard diffusion MR images and CT scans before treatment is related to EVT recanalization, leading to a potential new path of investigation in pretreatment imaging and thrombectomy outcome. The use of DL algorithms in this study provides several advantages over traditional ML methods. First, our approach does not require manual segmentation of the clot, which is a time-consuming process and can delay valuable treatment time. Instead, our model automatically learns to identify relevant features from the input images without requiring manual intervention. Second, our adaptation of contrastive SSL demonstrates the high effectiveness of SSL when the training data are limited, providing helpful evidence for medical imaging training for studies under similar settings. Third, our models do not require advanced imaging techniques, such as perfusion imaging, to achieve high performance in predicting successful recanalization. Perfusion imaging is less widely available than routine NCCT, DWI, or FLAIR images, perfusion imaging often require more advanced CT or MR imaging scanners and may not be available in many stroke triage settings.
Prediction of successful recanalization following EVT has been a target of several investigations. Prior methods achieved moderate performance using clinical variables,19,20 while others relied on handcrafted or statistical features extracted from manually-segmented regions on CT.19,21,42 For example, Hofmeister et al25 used radiomics features in a ML model to predict FPE from CT, achieving high specificity but low sensitivity. Our proposed DL-based method, in contrast, requires no manual segmentation and achieves balanced sensitivity and specificity with comparable accuracy. In a prior study using pretreatment CT images, DL showed promising results for predicting EVT recanalization.43 In a recent study by Zhang et al,21 an MR imaging–based radiomics model was developed to predict final recanalization scores with moderate performance. The DL algorithm proposed in our work was developed and evaluated on cohorts who underwent either MR imaging or CT before treatment that required no manual ROI segmentation, thereby providing a path for clinical translation if its potential is realized. Specifically, one potential clinical application is to use the predictive success at the time of consent or when consoling patients’ families to help and engage them in the treatment-decision process. Moreover, this information can help treating physicians plan the treatment accordingly and devise ways to include other treatment options such as thrombolysis, neuroprotection, and blood pressure management if they know the possible outcome of thrombectomy. If the proposed method can be broadly validated, it may help with improved patient triage and proper resource allocation.
Limitations of this study include its retrospective nature, single-center data collection, and relatively small sample size. Because patients were only included in the cohort if they underwent EVT as part of the study design, this model may be subject to treatment bias introduced during treatment decision-making. An additional source of bias is that the target variables are solely dependent on the assessment of the neurointerventionalist performing the procedure. The experiences of different neurointerventionalists during the study period varied and could potentially be a confounding factor. Moreover, there is substantial discourse surrounding the use of mTICI scores and correlations with outcomes, undoubtedly introducing variability in the experts’ assessments, depending on their training and expertise. This cohort was assessed using the mTICI score. This evaluation is inherently subjective; while there is a high degree of reliability for patients who scored mTICI 2c and 3, there is high inter-reader variability for patients who scored mTICI 2b.44 This finding is likely due to the extensive range of patients within a score class, because patients with 2b can experience anywhere from 50% to 89% recanalization. This scoring metric has undergone several augmentations45 since its proposal in 2005, because of both this variability and poor correlation with functional outcomes.46
Finally, this is a proof-of-concept study from 1 institution, and the architecture has many parameters. Although effort has been made to improve the generalizability of the model by self-supervised learning, the sample size directly related to FPE is still relatively small for DL training. Registration-based preprocessing, though proved to be effective in reducing the heterogeneity of data in a cohort and letting the model focus on the inside of the brain, inevitably created population bias. Furthermore, for imaging modeling, cases with bad-quality imaging were excluded, inevitably introducing bias in the population. In future studies, imaging-enhancement algorithms should be applied to minimize the cases excluded due to quality issues. The improvement of the clot retrieval techniques during this study period could be a confounding factor that should be further investigated. Different techniques, such as stent retriever versus contact aspiration versus combined approach, could be another confounding factor. Due to the limitation of the DL model that requires a large data set, modeling against multiple confounding factors requires a larger data set to provide statistically reliable results. External validation is required to determine the applicability of these models to other hospitals and institutions. Other future directions include investigating the features in advanced imaging such as CT perfusion or MR perfusion and vessel imaging.
CONCLUSIONS
We have presented a fully automatic, end-to-end DL framework to predict FPE following EVT by using pretreatment imaging. By analyzing MR imaging or CT scans of patients with AIS before treatment, our volume-based DL network can accurately determine whether a patient will achieve successful recanalization in one attempt. These results suggest that baseline imaging, whether MR imaging or CT, contains valuable information regarding the FPE. Notably, our method outperforms existing approaches and does not require manual thrombus segmentation, highlighting the power of DL algorithms in informing treatment strategies for patients with AIS.
Footnotes
Haoyue Zhang and Jennifer S. Polson contributed equally to this article.
This work was supported by the National Institutes of Health National Institute of Neurological Disorders and Stroke, 5R01NS100806.
Disclosure forms provided by the authors are available with the full text and PDF of this article at www.ajnr.org.
References
- Received December 21, 2023.
- Accepted after revision March 1, 2024.
- © 2024 by American Journal of Neuroradiology


Jump to section
Related Articles
Cited By...
- No citing articles found.