
Graphical Abstract

Abstract
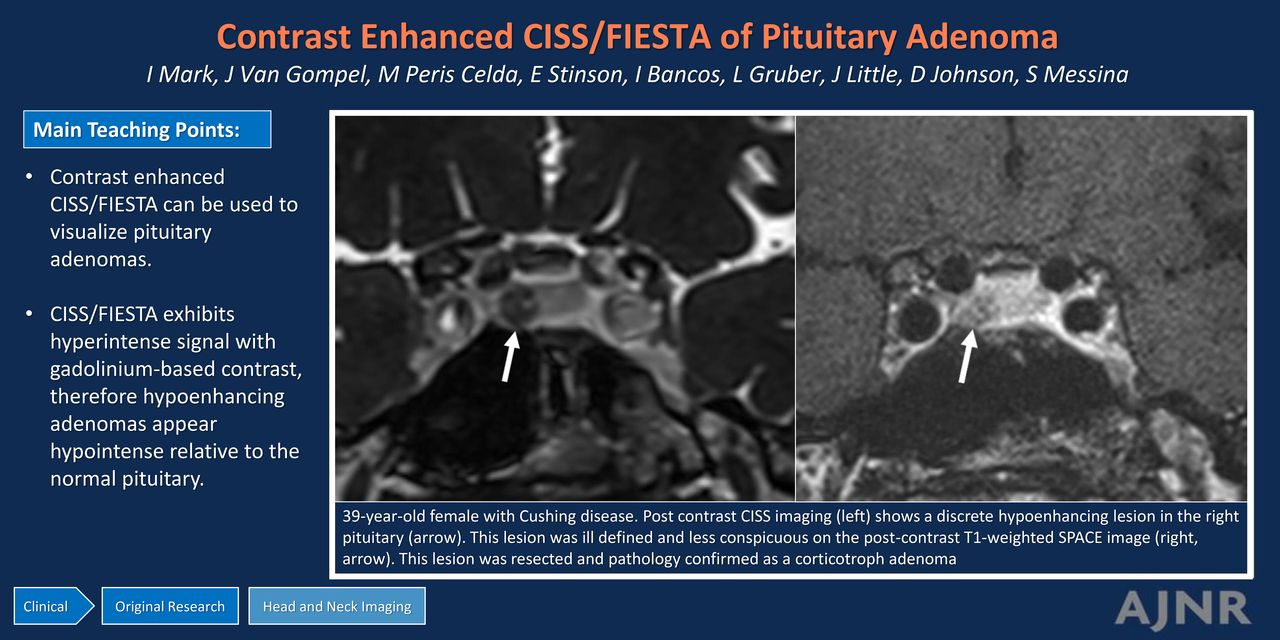
BACKGROUND AND PURPOSE: Pituitary microadenomas can be challenging to see on MRI, particularly when they are small. The detection of microadenomas commonly relies on contrast-enhanced sequences, highlighting the adenoma that demonstrates hypoenhancement relative to the native pituitary gland on T1-weighted sequences. Detecting adenomas in patients with Cushing disease is crucial because surgery is the standard of care treatment. Accurate preoperative lesion localization is directly associated with improved outcomes. The purpose of our study was to determine the utility of contrast-enhanced CISS/FIESTA with cycling (FIESTA-C) for identifying pituitary microadenomas in patients with Cushing disease.
MATERIALS AND METHODS: This cross-sectional study retrospectively reviewed pituitary MR images in patients with Cushing disease who had postcontrast CISS/FIESTA-C. Images were evaluated for lesion conspicuity (well-defined margins), as well as the signal intensity (SI) of the adenoma and native pituitary gland. The normalized SI difference was calculated by subtracting the lesion SI from the pituitary SI and dividing by the pituitary SI. Patient age, sex, and diagnosis based on intraoperative findings, pathology results, and postoperative adrenal insufficiency were recorded.
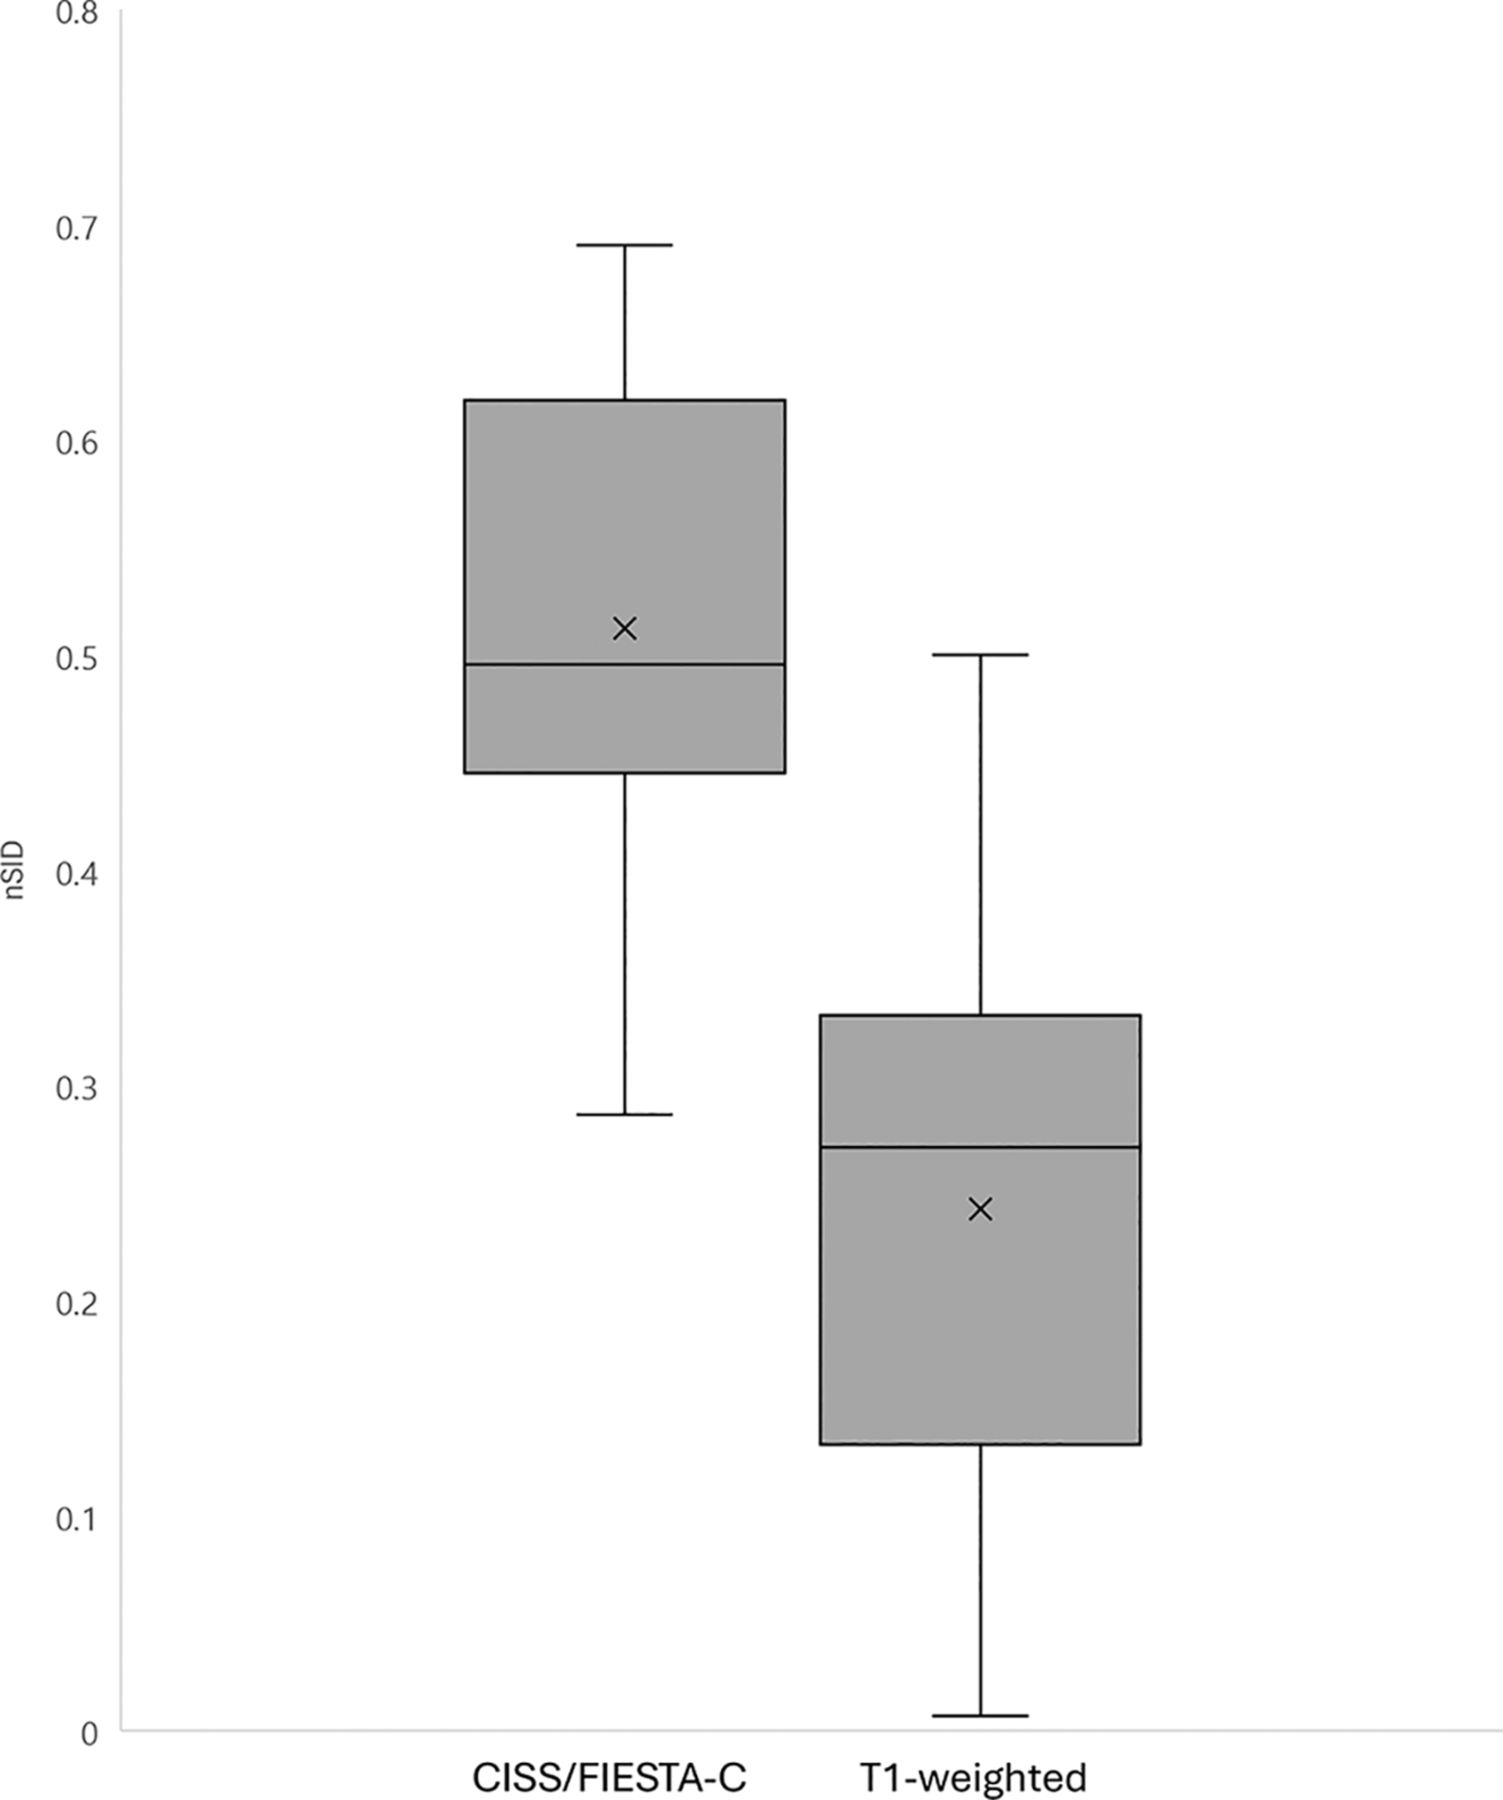
RESULTS: Seventeen patients (15 women) were included in this study. Sixteen (94%) adenomas were discrete on CISS/FIESTA-C compared with 11 (65%) on T1-weighted imaging. The mean adenoma normalized SI difference with CISS/FIESTA-C was 0.512 (SD, 0.12), relative to 0.242 (SD, 0.15) on T1-weighted imaging (P < .001).
CONCLUSIONS: In comparison with MR T1-weighted images, contrast-enhanced CISS/FIESTA-C imaging detects a higher number of pituitary microadenomas with superior conspicuity. Because up to 50% of patients with Cushing disease present without a pituitary lesion detected on MRI, postcontrast CISS/FIESTA-C may be especially valuable as an additional sequence in this population.
ABBREVIATIONS:
- bSSFP
- balanced steady state free precession
- FIESTA-C
- FIESTA with cycling
- nSID
- normalized signal intensity difference
- SI
- signal intensity
SUMMARY
PREVIOUS LITERATURE:
Prior studies have assessed various types of 3D T1-weighted imaging to identify pituitary microadenomas in patients with Cushing disease. CISS/FIESTA-C is typically used as a noncontrast sequence to increase tissue contrast and exaggerate the difference between hyper- and hypointense structures. Although primarily considered a T2-weighted sequence, CISS/FIESTA-C imaging exhibits hyperintense signal with gadolinium-based contrast. Our study aimed to explore whether pituitary adenomas causing Cushing disease are more conspicuous on contrast-enhanced CISS/FIESTA-C compared with T1-weighted imaging.
KEY FINDINGS:
We found that contrast-enhanced CISS/FIESTA-C imaging of the sella has increased conspicuity of pituitary microadenomas relative to T1-weighted imaging in patients with Cushing disease.
KNOWLEDGE ADVANCEMENT:
Postcontrast CISS/FIESTA-C imaging is an easily accessible sequence, acquired in approximately 3 minutes, and can be added on to pituitary MRI protocols as an additional sequence to identify microadenomas.
The identification of pituitary adenomas on MRI is challenging, particularly when imaging microadenomas. Specific to pituitary-dependent Cushing disease, MRI is unable to detect an adenoma in up to one-half of cases.1,2 The basis for identifying pituitary adenomas lies in the contrast differential between an adenoma and a normal pituitary gland, with the adenoma often displaying relative hypoenhancement on delayed postcontrast imaging.3 Cross-sectional imaging of the pituitary gland is a crucial step because surgical resection is the standard of care in Cushing disease and successful preoperative tumor localization is related to better outcomes.4 Recognizing the importance of accurate preoperative adenoma detection, previous studies have shown the benefit of adding 3D T1-weighted sequences, including spoiled gradient-echo 3D T1 sequences, for pituitary adenoma identification.5,6
CISS and FIESTA with cycling (FIESTA-C) are multiacquisition phase-cycled balanced steady state free precession (bSSFP) techniques7 that acquire multiple bSSFP runs, each with different phase cycling of the radiofrequency pulses. As a result, the banding artifacts are shifted to different locations in each image, and an artifact-free image can be created by combining the images. CISS and FIESTA-C are used most frequently as noncontrast sequences to outline CSF in the spine8 and basal cisterns, including the cranial nerves,9 as a means of accentuating the difference between hyper- and hypointense structures. The same technique can also be used to depict gadolinium-enhancing tissue as hyperintense and has previously been used to highlight enhancement of cranial nerves.10 We hypothesize that the high contrast of CISS/FIESTA-C can be leveraged to accentuate hypoenhancing pituitary adenomas from the enhancing pituitary gland. The purpose of our study was to use contrast-enhanced CISS/FIESTA-C imaging for the identification of pituitary microadenomas in patients with Cushing disease.
MATERIALS AND METHODS
Patients with Cushing disease who underwent pituitary MRI with postcontrast CISS or FIESTA-C imaging from January 2023 to June 2024 were included in this retrospective internal review board–approved study. Their MR images were retrospectively reviewed for imaging details that included the field strength, use of CISS or FIESTA-C, and associated protocol details (slice thickness, field of view, flip angle, and sequence order). The protocol details of the contrast-enhanced T1-weighted sequences were also recorded (sequence used and slice thickness).
All patients were imaged on 3T MRI (Magnetom Skyra, Magnetom Verio, Magnetom Vida [Siemens], and PrismA and Premier [GE Healthcare]), but the protocols were heterogeneous. Thirteen patients had postcontrast CISS, and 4 had postcontrast FIESTA-C imaging. The acquisition time of a coronal CISS/FIESTA-C sequence was approximately 3 minutes. Eight patients (47%) had CISS/FIESTA-C before the postcontrast T1. The field of view ranged from 120 to 200 mm. The flip angle ranged from 29° to 50°. Thirteen (76%) protocols were acquired with a CISS/FIESTA-C imaging slice thickness of ≤1 mm, with the remainder at 1.5–1.6 mm. Fourteen protocols (82%) were obtained in the coronal plane, with the remainder acquired in the sagittal plane. All examinations also included postcontrast T1-weighted 3D fast spin-echo sequences, 4 of which (24%) were Cube (GE Healthcare) and 13 of which (76%) were sampling perfection with application-optimized contrasts using different flip angle evolution (SPACE sequence; Siemens) (Fig 1).

A 39-year-old woman with Cushing disease. Postcontrast CISS imaging (A) shows a discrete hypoenhancing lesion in the right pituitary gland (arrow). This lesion was ill-defined and less conspicuous on the postcontrast T1-weighted SPACE image (B, arrow). It was resected, and pathologically confirmed it as a corticotroph adenoma.
Images were evaluated by a single neuroradiologist (I.T.M.) who evaluated the contrast-enhanced CISS/FIESTA-C and T1-weighted images for adenoma size (maximum diameter), adenoma conspicuity (defined as discrete margins), signal intensity (SI) of the adenoma, and SI of the pituitary gland. The normalized SI difference between the normal pituitary tissue and an adenoma was calculated using normalized SI difference ( Therefore, a greater ratio indicates a greater enhancement difference between the pituitary gland and adenoma. The nSID of CISS/FIESTA-C and T1-weighted images was compared using a Student t test. Interpretation of pituitary MRI can be quite subjective; therefore, we chose these variables to quantify our evaluation. Patient demographics including age, sex, prior pituitary surgery, and pathology results were also recorded.
RESULTS
Of the 17 patients included in this study (Table), 15 (88%) were women and 3 were evaluated by the endocrinology department and had confirmed postoperative adrenal insufficiency compatible with surgical remission of pituitary Cushing disease.
| Sex | Age (yr) | Size (mm) | ST | T1 Discrete | nSID |
|---|---|---|---|---|---|
| F | 44 | 5 | 1 | Y | 0.376 |
| F | 54 | 5 | 1 | Y | 0.285 |
| F | 23 | 6 | 0.7 | Y | 0.354 |
| F | 69 | 6 | 1 | Y | 0.302 |
| M | 39 | 5 | 0.7 | N | 0.271 |
| F | 38 | 4 | 1 | Y | 0.500 |
| F | 55 | 6 | 0.6 | N | 0.017 |
| F | 49 | 4 | 1 | Y | 0.470 |
| F | 66 | 6 | 0.6 | Y | 0.163 |
| F | 67 | 2 | 0.8 | N | 0.299 |
| F | 48 | 5 | 1 | Y | 0.246 |
| F | 35 | 7 | 1 | Y | 0.187 |
| M | 18 | 7 | 0.8 | Y | 0.196 |
| F | 56 | 3 | 1 | N | 0.007 |
| F | 47 | 3 | 0.8 | Y | 0.311 |
| F | 63 | 7 | 0.7 | N | 0.035 |
| F | 38 | 3 | 9 | N | 0.103 |
Note:—ST indicates slice thickness; Y, yes; N, no; F, female; M, male.
Patient-specific details
Representative imaging results are shown in Figs 1, 3, and 4. CISS/FIESTA-C identified discrete pituitary lesions in 16 (94%) patients compared with 11 (65%) on the contrast-enhanced T1-weighted images. The pituitary-to-lesion nSID (Fig 2) was greater on CISS/FIESTA-C (mean, 0.512 [SD, 0.115]) relative to T1-weighted imaging (mean, 0.242 [SD 0.15]), a statistically significant difference (P < .001). The mean maximum lesion diameter was 4.9 mm (range, 2–7 mm). The separate T2-weighted sequence demonstrated SI characteristics as follows: 5 (29%) homogeneously hypointense, 10 (59%) homogeneously isointense, and 2 (12%) with microcystic changes.

When one compares the nSID of contrast-enhanced CISS/FIESTA-C with T1-weighted imaging (P < .001), a higher nSID indicates a greater enhancement difference between the adenoma and pituitary gland.
Of the 5 adenomas that were well-defined on contrast-enhanced CISS/FIESTA-C but not on T1-weighted imaging, the mean diameter was 4.6 mm (range 2–7 mm). Four were hypointense on T2-weighted imaging, while one was isointense.
DISCUSSION
Pituitary adenomas, particularly when small, are not always seen on MRI. Typically, they are identified as hypoenhancing relative to the normal pituitary gland. We showed that postcontrast CISS and FIESTA-C imaging can identify pituitary microadenomas, and they are more conspicuous relative to 3D T1-weighted sequences. This is an important clinically-available adjunct sequence, with an approximately 3-minute acquisition time, that can be applied to pituitary MRI protocols to help increase the conspicuity of microadenomas, especially when hormone excess is a concern.
While bSSFP with multiple acquisitions with phase cycling is used to remove the banding artifacts, at their core CISS and FIESTA-C are bSSFP sequences,11 with signal proportional to the ratio of T2 to T1. The T2/T1 ratio is comparatively large for fat tissue and free fluid such as CSF, making their signals bright compared with other tissues. Thus, CISS and FIESTA-C have been used successfully for imaging the spine8 and cisternal spaces12 to distinguish the CSF from other tissues. Likewise, when a T1-shortening contrast agent (such as a gadolinium-based contrast agent) is administered, the T2/T1 ratio is increased and the signal in CISS/FIESTA-C is increased, an effect that has previously been leveraged to evaluate contrast enhancement of the cranial nerves.13
Prior studies have assessed CISS/FIESTA of the pituitary gland, but they primarily differ by concentrating on the noncontrast imaging appearance or evaluating adenoma involvement of the cavernous sinus. Lang et al14 evaluated CISS to identify pituitary adenomas in Cushing disease; however, their study differed from ours in several ways. They imaged patients with postcontrast CISS at 1.5T and identified pituitary adenomas as hyperintense lesions, meaning that they identified cystic adenomas. They did not use CISS to highlight lesion hypoenhancement, and in fact, they stated that the benefit of CISS is that it can be performed without IV contrast. Their technique resulted in Cushing adenoma detection in 6/12 (50%) cases. Our study differs in that it used 3T MRI to identify pituitary adenomas as hypoenhancing relative to the pituitary gland (Fig 3); therefore, it is only performed after the administration of IV contrast. Braileanu et al15 also used postcontrast CISS imaging to evaluate 34 functioning pituitary adenomas. Their study was predominantly performed on 1.5T MRI, and they focused on the extent of cavernous sinus invasion. All patients in our study underwent 3T MR imaging. The higher field strength of 3T MRI has demonstrated superior efficacy in detecting pituitary adenomas compared with 1.5T MRI.16⇓–18

A 44-year-old woman with Cushing disease. One year prior, the patient underwent pituitary lesion resection and radiation treatment at an outside institution; now she has persistent symptoms and laboratory values compatible with persistent Cushing disease. A, Postcontrast SPACE imaging shows hypoenhancement in the same area that was present but less conspicuous (arrow). Postcontrast coronal (B) and sagittal (C) CISS imaging show a hypoenhancing lesion in the left inferior pituitary (arrows). This lesion was resected and pathologically confirmed as a corticotroph adenoma.
Tong et al19 used CISS at 3T to evaluate macroadenoma extension into the cavernous sinuses and concluded that SPACE was more useful than postcontrast CISS for evaluating lateral invasion. The pituitary lesions in our study were microadenomas; therefore, we did not evaluate cavernous sinus involvement.
Given the lack of data that compare CISS and FIESTA-C with traditional T1-weighted sequences, we believe that it should be performed in conjunction, rather than as a replacement. Pituitary MRI protocols often have shorter gradient times compared with standard brain MRI protocols, and it is potentially feasible to include both CISS/FIESTA-C and T1-weighted postcontrast sequences. However, further studies should be performed to compare the 2 sequences and determine if CISS and FIESTA-C could replace traditional postcontrast T1-weighted sequences.
Our study has limitations, starting with the retrospective nature. Our patients, predominantly women as is typical in Cushing disease, were imaged with heterogeneous protocols. Consequently, this variability precluded the identification of a single optimal technique regarding slice thickness or flip angle. Development and optimization of a harmonized protocol are the subject of a future study. Additionally, CISS and FIESTA-C were compared with only postcontrast T1-weighted 3D fast spin-echo sequences (SPACE and Cube) and we did not evaluate other types of T1-weighted sequences, including MPRAGE, BRAVO (GE Healthcare), or volumetric interpolated brain examination (VIBE).20 This omission is a result of our standard clinical protocol, which does not include those techniques. We did not compare our technique with other dynamic postcontrast T1-weighted sequences,21 3D T1-weighted sequences,5 postcontrast inversion recovery,22,23 or photon-counting detector CT. CISS/FIESTA-C at 3T does have increased artifacts from sphenoid sinus pneumatization (Fig 4), which can limit evaluation, and our study did not evaluate CISS/FIESTA-C at 1.5T MRI, which would have fewer sphenoid sinus artifacts. Finally, the subjective identification of pituitary adenomas can have high interrater variability; therefore, to address this potential pitfall, we focused on the nSID, which is an objective measure of lesion conspicuity.

An 18-year-old man with clinical symptoms and endocrine laboratory values compatible with Cushing disease. Postcontrast FIESTA-C imaging (A) demonstrates a hypoenhancing lesion in the right lateral pituitary gland (arrow) with corresponding hypoenhancement on the contrast-enhanced Cube that was less conspicuous (B, arrow). This lesion was a pathologically-confirmed corticotroph adenoma. The FIESTA-C image does show artifacts related to aeration of the sphenoid sinus (A, broken arrow). Representative circles are shown to demonstrate how the SI was measured.
CONCLUSIONS
Our study used contrast-enhanced CISS/FIESTA-C imaging to identify pituitary microadenomas in patients with Cushing disease and found superior lesion conspicuity relative to T1-weighted sequences. This is a potentially helpful postcontrast sequence for the identification of pituitary microadenomas and could be considered as an additional sequence to pituitary MRI protocols.
Footnotes
Disclosure forms provided by the authors are available with the full text and PDF of this article at www.ajnr.org.
Indicates open access to non-subscribers at www.ajnr.org
References
- Received September 2, 2024.
- Accepted after revision November 13, 2024.
- © 2025 by American Journal of Neuroradiology


Jump to section
Related Articles
Cited By...
- No citing articles found.