Advertisement

Main menu

  • Home
  • Content
    • Current Issue
    • Accepted Manuscripts
    • Article Preview
    • Past Issue Archive
    • Video Articles
    • AJNR Case Collection
    • Case of the Week Archive
    • Case of the Month Archive
    • Classic Case Archive
  • Special Collections
    • AJNR Awards
    • Low-Field MRI
    • Alzheimer Disease
    • ASNR Foundation Special Collection
    • Photon-Counting CT
    • View All
  • Multimedia
    • AJNR Podcasts
    • AJNR SCANtastic
    • Trainee Corner
    • MRI Safety Corner
    • Imaging Protocols
  • For Authors
    • Submit a Manuscript
    • Submit a Video Article
    • Submit an eLetter to the Editor/Response
    • Manuscript Submission Guidelines
    • Statistical Tips
    • Fast Publishing of Accepted Manuscripts
    • Graphical Abstract Preparation
    • Imaging Protocol Submission
    • Author Policies
  • About Us
    • About AJNR
    • Editorial Board
    • Editorial Board Alumni
  • More
    • Become a Reviewer/Academy of Reviewers
    • Subscribers
    • Permissions
    • Alerts
    • Feedback
    • Advertisers
    • ASNR Home

User menu

  • Alerts
  • Log in

Search

  • Advanced search
American Journal of Neuroradiology

American Journal of Neuroradiology

ASHNR American Society of Functional Neuroradiology ASHNR American Society of Pediatric Neuroradiology ASSR
  • Alerts
  • Log in

Advanced Search

  • Home
  • Content
    • Current Issue
    • Accepted Manuscripts
    • Article Preview
    • Past Issue Archive
    • Video Articles
    • AJNR Case Collection
    • Case of the Week Archive
    • Case of the Month Archive
    • Classic Case Archive
  • Special Collections
    • AJNR Awards
    • Low-Field MRI
    • Alzheimer Disease
    • ASNR Foundation Special Collection
    • Photon-Counting CT
    • View All
  • Multimedia
    • AJNR Podcasts
    • AJNR SCANtastic
    • Trainee Corner
    • MRI Safety Corner
    • Imaging Protocols
  • For Authors
    • Submit a Manuscript
    • Submit a Video Article
    • Submit an eLetter to the Editor/Response
    • Manuscript Submission Guidelines
    • Statistical Tips
    • Fast Publishing of Accepted Manuscripts
    • Graphical Abstract Preparation
    • Imaging Protocol Submission
    • Author Policies
  • About Us
    • About AJNR
    • Editorial Board
    • Editorial Board Alumni
  • More
    • Become a Reviewer/Academy of Reviewers
    • Subscribers
    • Permissions
    • Alerts
    • Feedback
    • Advertisers
    • ASNR Home
  • Follow AJNR on Twitter
  • Visit AJNR on Facebook
  • Follow AJNR on Instagram
  • Join AJNR on LinkedIn
  • RSS Feeds

AJNR Awards, New Junior Editors, and more. Read the latest AJNR updates

Research ArticleUltra-High-Field MRI/Imaging of Epilepsy/Demyelinating Diseases/Inflammation/Infection

Diffusion- and Tractography-Based Characterization of Tissue Damage Within and Surrounding Paramagnetic Rim Lesions in Multiple Sclerosis

Maryam Mohebbi, Jack A. Reeves, Dejan Jakimovski, Alexander Bartnik, Niels Bergsland, Fahad Salman, Ferdinand Schweser, Bianca Weinstock-Guttman, Robert Zivadinov and Michael G. Dwyer
American Journal of Neuroradiology March 2025, 46 (3) 611-619; DOI: https://doi.org/10.3174/ajnr.A8524
Maryam Mohebbi
aFrom the Buffalo Neuroimaging Analysis Center (M.M., J.A.R., D.J., A.B., N.B., F.Salman, F.Schweser, R.Z., M.G.D.), Department of Neurology, Jacobs School of Medicine and Biomedical Sciences, University at Buffalo, State University of New York, Buffalo, New York
  • Find this author on Google Scholar
  • Find this author on PubMed
  • Search for this author on this site
Jack A. Reeves
aFrom the Buffalo Neuroimaging Analysis Center (M.M., J.A.R., D.J., A.B., N.B., F.Salman, F.Schweser, R.Z., M.G.D.), Department of Neurology, Jacobs School of Medicine and Biomedical Sciences, University at Buffalo, State University of New York, Buffalo, New York
  • Find this author on Google Scholar
  • Find this author on PubMed
  • Search for this author on this site
Dejan Jakimovski
aFrom the Buffalo Neuroimaging Analysis Center (M.M., J.A.R., D.J., A.B., N.B., F.Salman, F.Schweser, R.Z., M.G.D.), Department of Neurology, Jacobs School of Medicine and Biomedical Sciences, University at Buffalo, State University of New York, Buffalo, New York
  • Find this author on Google Scholar
  • Find this author on PubMed
  • Search for this author on this site
  • ORCID record for Dejan Jakimovski
Alexander Bartnik
aFrom the Buffalo Neuroimaging Analysis Center (M.M., J.A.R., D.J., A.B., N.B., F.Salman, F.Schweser, R.Z., M.G.D.), Department of Neurology, Jacobs School of Medicine and Biomedical Sciences, University at Buffalo, State University of New York, Buffalo, New York
  • Find this author on Google Scholar
  • Find this author on PubMed
  • Search for this author on this site
Niels Bergsland
aFrom the Buffalo Neuroimaging Analysis Center (M.M., J.A.R., D.J., A.B., N.B., F.Salman, F.Schweser, R.Z., M.G.D.), Department of Neurology, Jacobs School of Medicine and Biomedical Sciences, University at Buffalo, State University of New York, Buffalo, New York
  • Find this author on Google Scholar
  • Find this author on PubMed
  • Search for this author on this site
  • ORCID record for Niels Bergsland
Fahad Salman
aFrom the Buffalo Neuroimaging Analysis Center (M.M., J.A.R., D.J., A.B., N.B., F.Salman, F.Schweser, R.Z., M.G.D.), Department of Neurology, Jacobs School of Medicine and Biomedical Sciences, University at Buffalo, State University of New York, Buffalo, New York
  • Find this author on Google Scholar
  • Find this author on PubMed
  • Search for this author on this site
Ferdinand Schweser
aFrom the Buffalo Neuroimaging Analysis Center (M.M., J.A.R., D.J., A.B., N.B., F.Salman, F.Schweser, R.Z., M.G.D.), Department of Neurology, Jacobs School of Medicine and Biomedical Sciences, University at Buffalo, State University of New York, Buffalo, New York
bCenter for Biomedical Imaging at the Clinical Translational Science Institute (F.Schweser, R.Z.), University at Buffalo, State University of New York, Buffalo, New York
  • Find this author on Google Scholar
  • Find this author on PubMed
  • Search for this author on this site
  • ORCID record for Ferdinand Schweser
Bianca Weinstock-Guttman
cJacobs Neurological Institute (B.W.-G.), Buffalo, New York
  • Find this author on Google Scholar
  • Find this author on PubMed
  • Search for this author on this site
  • ORCID record for Bianca Weinstock-Guttman
Robert Zivadinov
aFrom the Buffalo Neuroimaging Analysis Center (M.M., J.A.R., D.J., A.B., N.B., F.Salman, F.Schweser, R.Z., M.G.D.), Department of Neurology, Jacobs School of Medicine and Biomedical Sciences, University at Buffalo, State University of New York, Buffalo, New York
bCenter for Biomedical Imaging at the Clinical Translational Science Institute (F.Schweser, R.Z.), University at Buffalo, State University of New York, Buffalo, New York
  • Find this author on Google Scholar
  • Find this author on PubMed
  • Search for this author on this site
  • ORCID record for Robert Zivadinov
Michael G. Dwyer
aFrom the Buffalo Neuroimaging Analysis Center (M.M., J.A.R., D.J., A.B., N.B., F.Salman, F.Schweser, R.Z., M.G.D.), Department of Neurology, Jacobs School of Medicine and Biomedical Sciences, University at Buffalo, State University of New York, Buffalo, New York
  • Find this author on Google Scholar
  • Find this author on PubMed
  • Search for this author on this site
  • ORCID record for Michael G. Dwyer
  • Article
  • Figures & Data
  • Info & Metrics
  • Responses
  • References
  • PDF
Loading

Article Figures & Data

Figures

  • Tables
  • Figure
    • Download figure
    • Open in new tab
    • Download powerpoint
  • FIG 1.
    • Download figure
    • Open in new tab
    • Download powerpoint
    FIG 1.

    Examples of PRL (pink) and non-PRL T2 (light green) lesions on QSM and FLAIR images from 2 different pwMS.

  • FIG 2.
    • Download figure
    • Open in new tab
    • Download powerpoint
    FIG 2.

    Diffusion-based fiber tractography, specifically highlighting the tracts located within a 10-mm radius of the lesions (A and B are PRL tracts and C is non-PRL tracts). A, Colors represent the direction of diffusion—blue for superior-inferior, green for anterior-posterior, and red for left-right. B, Notably, tracts closer to the lesions correspond to lower FA values, as indicated by the accompanying color bar.
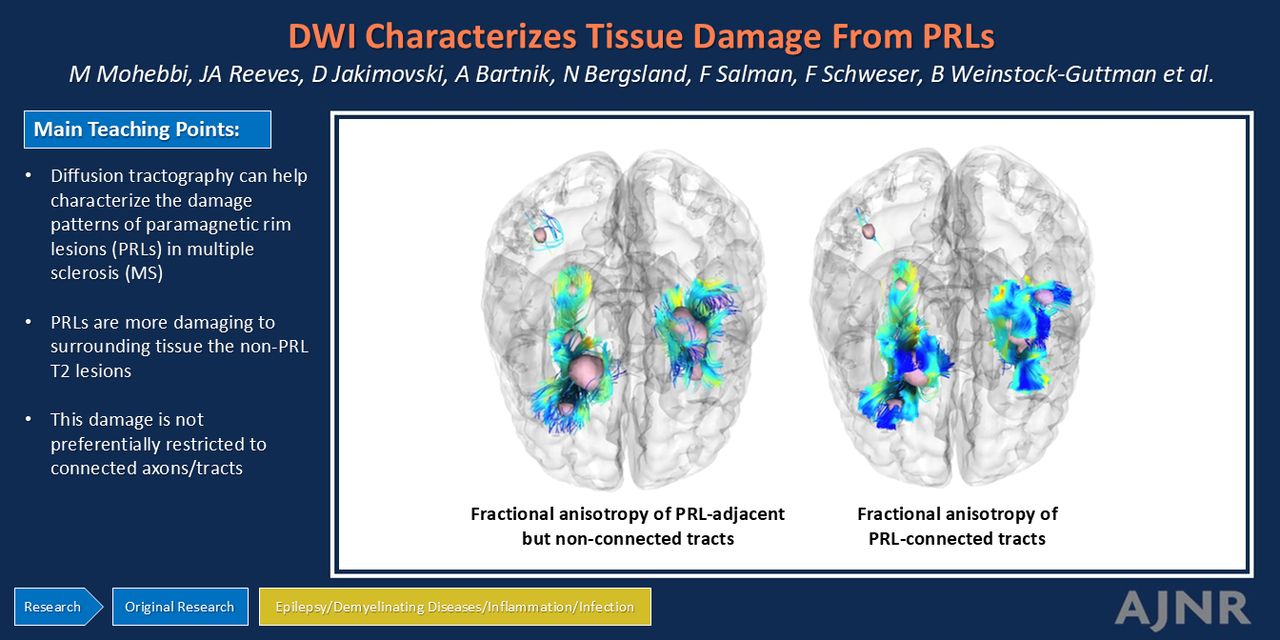
  • FIG 3.
    • Download figure
    • Open in new tab
    • Download powerpoint
    FIG 3.

    The result of tractography of PRL-connected tracts versus PRL-nonconnected tracts through the selection of different region types as presented in the Supplemental Data. A, PRL-nonconnected tracts along with ROIs and without the ROIs (a), which clearly shows a holelike area of the ROIs that are terminative regions, restricting the tracts from entering the regions. B, The PRL-connected tracts with and without ROIs (b). C, The same tracts from the coronal view. The color bar shows the FA value.

Tables

  • Figures
    • View popup
    Table 1:

    Demographic and clinical characteristics of the study population

    AllPRL−PRL +
    Overall (n = 115)Overall (n = 66)Overall (n = 49)
    PRL number, mean ± SD0.65 ± 1.90–1.52 ± 2.92
    T2 LN, mean ± SD19.5 ± 11.1218.32 ± 12.620.85 ± 9.05
    T2 LVa, mean ± SD, mL10.94 ± 13.648.35 ± 10.5913.92 ± 16.06
    Sex
     Female88 (76.5%)55 (83.3%)33 (67.3%)
     Male27 (23.5%)11 (16.7%)16 (32.6%)
    Age (yrs)
     Mean ± SD52.9 ± 11.854.4 ± 11.150.5 ± 12.6
     Median [min, max]53.2 [23.2, 75.2]53.6 [23.2, 73.4]52.2 [24.2, 75.2]
    Disease (type of MS)
     RRMS78 (67.8%)46 (69.7%)33 (67.3%)
     PMS37 (32.1%)20 (30.3%)16 (32.6%)
    Disease duration in years
     Mean ± SD19.5 ± 10.120.2 ± 9.8118.5 ± 10.6
     Median [min, max]17.0 [5.00, 47.0]18.0 [5.00, 47.0]17.0 [5.00, 40.0]
    EDSS
     Mean ± SD3.44 ± 2.053.19 ± 1.843.71 ± 2.27
     Median [min, max]3.00 [0, 9.00]2.50 [0, 7.00]3.00 [0, 9.00]
     Missing3 (2.6%)2 (3.0%)1 (2.1%)
    • ↵a Overall T2 LVs before excluding non-PRLs within close vicinity of PRLs by using double-threshold.

    • Note:—LN indicates lesion number; EDSS = Expanded Disability Status Scale; PMS = progressive MS.

    • View popup
    Table 2:

    Comparison of the diffusion parameters within the nearby tracts connected to all lesions (PRLs and non-PRLs) versus within the lesions themselvesa

    MetricsTractsWithin-LesionCohen dP Valueq-Value
    FA, mean ± SD0.383 ± 0.0540.296 ± 0.0521.38<.0010.001
    QA, mean ± SD0.326 ± 0.0620.290 ± 0.0580.76<.0010.001
    MD, mean ± SD1.092 ± 0.1471.232 ± 0.218−0.70<.0010.001
    AD, mean ± SD1.539 ± 0.1841.572 ± 0.206−0.24.020.02
    RD, mean ± SD0.869 ± 0.1401.018 ± 0.195−0.89<.0010.001
    Iso, mean ± SD0.789 ± 0.2260.836 ± 0.255−0.77<.0010.001
    RDI, mean ± SD0.519 ± 0.0940.535 ± 0.111−0.41<.0010.001
    • ↵a Paired t-tests and effect sizes were calculated within subjects who had at least 1 PRL (n = 49), P < .05 considered statistically significant. q-value represents the Benjamini-Hochberg FDR corrected P value at the table level.

    • View popup
    Table 3:

    Comparison of diffusion parameters between PRLs versus non-PRLs, within the lesionsa

    MetricsPRLsNon-PRLsCohen dP Valueq-Value
    Total LV,b mean ± SD, mL0.459 ± 1.258.33 ± 11.03–<.0010.008
    FA, mean ± SD0.279 ± 0.0470.302 ± 0.056−0.30.040.16
    QA, mean ± SD0.283 ± 0.0670.219 ± 0.056−0.13.380.43
    MD, mean ± SD1.232 ± 0.2181.186 ± 0.1120.16.260.35
    AD, mean ± SD1.581 ± 0.2651.560 ± 0.1350.07.630.63
    RD, mean ± SD1.058 ± 0.2000.999 ± 0.1150.20.150.26
    Iso, mean ± SD0.855 ± 0.2570.818 ± 0.2200.28.090.24
    RDI, mean ± SD0.542 ± 0.1120.529 ± 0.0860.22.160.26
    • ↵a Paired t-test was calculated within subjects who had at least 1 PRL (n = 49), P < .05 considered statistically significant. q-value represents the Benjamini-Hochberg FDR corrected P value at the table level.

    • ↵b Non-PRL T2 LVs after excluding non-PRL T2 lesions overlapping or confluent with PRLs.

    • View popup
    Table 4:

    Comparison of diffusion metrics between PRL-connected and non-PRL T2-lesion connected tracts near lesionsa

    MetricsPRL ConnectedNon-PRL T2 Lesion ConnectedCohen dP Valueq-Value
    Total LV,b mean ± SD, mL0.459 ± 1.258.33 ± 11.03–< .0010.004
    FA, mean ± SD0.354 ± 0.0470.391 ± 0.056–0.56< .0010.004
    QA, mean ± SD0.315 ± 0.0670.328 ± 0.056–0.17.270.36
    MD, mean ± SD1.092 ± 0.2181.101 ± 0.112–0.04.750.75
    AD, mean ± SD1.496 ± 0.2651.562 ± 0.135–0.23.100.16
    RD, mean ± SD0.890 ± 0.2000.871 ± 0.1150.09.510.58
    Iso, mean ± SD0.814 ± 0.2570.766 ± 0.2200.43.0070.02
    RDI, mean ± SD0.534 ± 0.1120.508 ± 0.0860.37.020.04
    • ↵a Paired t-test was calculated within subjects who had at least 1 PRL (n = 49), P < .05 considered statistically significant. q-value represents the Benjamini-Hochberg FDR corrected P value at the table level.

    • ↵b Non-PRL T2 LVs after excluding non-PRL T2 lesions adjacent to PRLs.

    • View popup
    Table 5:

    Comparison of diffusion metrics in PRL-connected versus PRL-nonconnected tracts (surrounding white matter)a

    MetricsPRL ConnectedPRL Nonconnected Surrounding TractsCohen dP Valueq-Value
    FA, mean ± SD0.354 ± 0.0470.354 ± 0.0480.00.980.98
    QA, mean ± SD0.315 ± 0.0670.298 ± 0.0620.44.0030.02
    MD, mean ± SD1.092 ± 0.2181.077 ± 0.2250.11.450.63
    AD, mean ± SD1.496 ± 0.2651.467 ± 0.2560.19.210.46
    RD, mean ± SD0.890 ± 0.2000.881 ± 0.2130.06.680.79
    Iso, mean ± SD0.814 ± 0.2570.799 ± 0.2480.39.260.46
    RDI, mean ± SD0.534 ± 0.1120.523 ± 0.1070.41.210.46
    • ↵a Paired t-test was calculated within subjects who had at least 1 PRL (n = 49), P < .05 considered statistically significant. q-value represents the Benjamini-Hochberg FDR corrected P value at the table level.

PreviousNext
Back to top

In this issue

American Journal of Neuroradiology: 46 (3)
American Journal of Neuroradiology
Vol. 46, Issue 3
1 Mar 2025
  • Table of Contents
  • Index by author
  • Complete Issue (PDF)
Advertisement
Print
Download PDF
Email Article

Thank you for your interest in spreading the word on American Journal of Neuroradiology.

NOTE: We only request your email address so that the person you are recommending the page to knows that you wanted them to see it, and that it is not junk mail. We do not capture any email address.

Enter multiple addresses on separate lines or separate them with commas.
Diffusion- and Tractography-Based Characterization of Tissue Damage Within and Surrounding Paramagnetic Rim Lesions in Multiple Sclerosis
(Your Name) has sent you a message from American Journal of Neuroradiology
(Your Name) thought you would like to see the American Journal of Neuroradiology web site.
CAPTCHA
This question is for testing whether or not you are a human visitor and to prevent automated spam submissions.
Cite this article
Maryam Mohebbi, Jack A. Reeves, Dejan Jakimovski, Alexander Bartnik, Niels Bergsland, Fahad Salman, Ferdinand Schweser, Bianca Weinstock-Guttman, Robert Zivadinov, Michael G. Dwyer
Diffusion- and Tractography-Based Characterization of Tissue Damage Within and Surrounding Paramagnetic Rim Lesions in Multiple Sclerosis
American Journal of Neuroradiology Mar 2025, 46 (3) 611-619; DOI: 10.3174/ajnr.A8524

Citation Manager Formats

  • BibTeX
  • Bookends
  • EasyBib
  • EndNote (tagged)
  • EndNote 8 (xml)
  • Medlars
  • Mendeley
  • Papers
  • RefWorks Tagged
  • Ref Manager
  • RIS
  • Zotero
0 Responses
Respond to this article
Share
Bookmark this article
Tissue Damage Characterization in MS Using DWI
Maryam Mohebbi, Jack A. Reeves, Dejan Jakimovski, Alexander Bartnik, Niels Bergsland, Fahad Salman, Ferdinand Schweser, Bianca Weinstock-Guttman, Robert Zivadinov, Michael G. Dwyer
American Journal of Neuroradiology Mar 2025, 46 (3) 611-619; DOI: 10.3174/ajnr.A8524
del.icio.us logo Twitter logo Facebook logo Mendeley logo
  • Tweet Widget
  • Facebook Like
  • Google Plus One
Purchase

Jump to section

  • Article
    • Graphical Abstract
    • Abstract
    • ABBREVIATIONS:
    • MATERIALS AND METHODS
    • RESULTS
    • DISCUSSION
    • CONCLUSIONS
    • Footnotes
    • References
  • Figures & Data
  • Info & Metrics
  • Responses
  • References
  • PDF

Related Articles

  • No related articles found.
  • PubMed
  • Google Scholar

Cited By...

  • No citing articles found.
  • Crossref
  • Google Scholar

This article has not yet been cited by articles in journals that are participating in Crossref Cited-by Linking.

More in this TOC Section

  • Automated Lesion Segmentation Software in MS
  • DL Image Reconstruction in T2-Weighted TSE at 7T
  • 7T MRI vasculitis imaging
Show more Ultra-High-Field MRI/Imaging of Epilepsy/Demyelinating Diseases/Inflammation/Infection

Similar Articles

Advertisement

Indexed Content

  • Current Issue
  • Accepted Manuscripts
  • Article Preview
  • Past Issues
  • Editorials
  • Editor's Choice
  • Fellows' Journal Club
  • Letters to the Editor
  • Video Articles

Cases

  • Case Collection
  • Archive - Case of the Week
  • Archive - Case of the Month
  • Archive - Classic Case

More from AJNR

  • Trainee Corner
  • Imaging Protocols
  • MRI Safety Corner
  • Book Reviews

Multimedia

  • AJNR Podcasts
  • AJNR Scantastics

Resources

  • Turnaround Time
  • Submit a Manuscript
  • Submit a Video Article
  • Submit an eLetter to the Editor/Response
  • Manuscript Submission Guidelines
  • Statistical Tips
  • Fast Publishing of Accepted Manuscripts
  • Graphical Abstract Preparation
  • Imaging Protocol Submission
  • Evidence-Based Medicine Level Guide
  • Publishing Checklists
  • Author Policies
  • Become a Reviewer/Academy of Reviewers
  • News and Updates

About Us

  • About AJNR
  • Editorial Board
  • Editorial Board Alumni
  • Alerts
  • Permissions
  • Not an AJNR Subscriber? Join Now
  • Advertise with Us
  • Librarian Resources
  • Feedback
  • Terms and Conditions
  • AJNR Editorial Board Alumni

American Society of Neuroradiology

  • Not an ASNR Member? Join Now

© 2025 by the American Society of Neuroradiology All rights, including for text and data mining, AI training, and similar technologies, are reserved.
Print ISSN: 0195-6108 Online ISSN: 1936-959X

Powered by HighWire