Advertisement

Main menu

  • Home
  • Content
    • Current Issue
    • Accepted Manuscripts
    • Article Preview
    • Past Issue Archive
    • Video Articles
    • AJNR Case Collection
    • Case of the Week Archive
    • Case of the Month Archive
    • Classic Case Archive
  • Special Collections
    • AJNR Awards
    • Low-Field MRI
    • Alzheimer Disease
    • ASNR Foundation Special Collection
    • Photon-Counting CT
    • View All
  • Multimedia
    • AJNR Podcasts
    • AJNR SCANtastic
    • Trainee Corner
    • MRI Safety Corner
    • Imaging Protocols
  • For Authors
    • Submit a Manuscript
    • Submit a Video Article
    • Submit an eLetter to the Editor/Response
    • Manuscript Submission Guidelines
    • Statistical Tips
    • Fast Publishing of Accepted Manuscripts
    • Graphical Abstract Preparation
    • Imaging Protocol Submission
    • Author Policies
  • About Us
    • About AJNR
    • Editorial Board
    • Editorial Board Alumni
  • More
    • Become a Reviewer/Academy of Reviewers
    • Subscribers
    • Permissions
    • Alerts
    • Feedback
    • Advertisers
    • ASNR Home

User menu

  • Alerts
  • Log in

Search

  • Advanced search
American Journal of Neuroradiology

American Journal of Neuroradiology

ASHNR American Society of Functional Neuroradiology ASHNR American Society of Pediatric Neuroradiology ASSR
  • Alerts
  • Log in

Advanced Search

  • Home
  • Content
    • Current Issue
    • Accepted Manuscripts
    • Article Preview
    • Past Issue Archive
    • Video Articles
    • AJNR Case Collection
    • Case of the Week Archive
    • Case of the Month Archive
    • Classic Case Archive
  • Special Collections
    • AJNR Awards
    • Low-Field MRI
    • Alzheimer Disease
    • ASNR Foundation Special Collection
    • Photon-Counting CT
    • View All
  • Multimedia
    • AJNR Podcasts
    • AJNR SCANtastic
    • Trainee Corner
    • MRI Safety Corner
    • Imaging Protocols
  • For Authors
    • Submit a Manuscript
    • Submit a Video Article
    • Submit an eLetter to the Editor/Response
    • Manuscript Submission Guidelines
    • Statistical Tips
    • Fast Publishing of Accepted Manuscripts
    • Graphical Abstract Preparation
    • Imaging Protocol Submission
    • Author Policies
  • About Us
    • About AJNR
    • Editorial Board
    • Editorial Board Alumni
  • More
    • Become a Reviewer/Academy of Reviewers
    • Subscribers
    • Permissions
    • Alerts
    • Feedback
    • Advertisers
    • ASNR Home
  • Follow AJNR on Twitter
  • Visit AJNR on Facebook
  • Follow AJNR on Instagram
  • Join AJNR on LinkedIn
  • RSS Feeds

AJNR Awards, New Junior Editors, and more. Read the latest AJNR updates

Research ArticleUltra-High-Field MRI/Imaging of Epilepsy/Demyelinating Diseases/Inflammation/Infection

MR Imaging Findings in Anti-Leucine-Rich Glioma Inactivated Protein 1 Encephalitis: A Systematic Review and Meta-analysis

Francisco C. Almeida, Ana I. Pereira, Catarina Mendes-Pinto, Joana Lopes, João Moura, José Maria Sousa, Gonçalo Videira, Raquel Samões and Tiago Gil Oliveira
American Journal of Neuroradiology July 2024, 45 (7) 977-986; DOI: https://doi.org/10.3174/ajnr.A8256
Francisco C. Almeida
aFrom the Department of Neuroradiology (F.C.A., A.I.P., C.M.-P.), Centro Hospitalar Universitário de Santo António, Porto, Portugal
bLife and Health Sciences Research Institute (F.C.A., T.G.O.), School of Medicine, University of Minho, Braga, Portugal
cLife and Health Sciences Research Institute/3B’s-PT Government Associate Laboratory (F.C.A., T.G.O.), Braga/Guimarães, Portugal
  • Find this author on Google Scholar
  • Find this author on PubMed
  • Search for this author on this site
  • ORCID record for Francisco C. Almeida
Ana I. Pereira
aFrom the Department of Neuroradiology (F.C.A., A.I.P., C.M.-P.), Centro Hospitalar Universitário de Santo António, Porto, Portugal
  • Find this author on Google Scholar
  • Find this author on PubMed
  • Search for this author on this site
Catarina Mendes-Pinto
aFrom the Department of Neuroradiology (F.C.A., A.I.P., C.M.-P.), Centro Hospitalar Universitário de Santo António, Porto, Portugal
  • Find this author on Google Scholar
  • Find this author on PubMed
  • Search for this author on this site
Joana Lopes
dDepartment of Neurology (J.L., J.M., G.V., R.S.), Centro Hospitalar Universitário de Santo António, Porto, Portugal
  • Find this author on Google Scholar
  • Find this author on PubMed
  • Search for this author on this site
João Moura
dDepartment of Neurology (J.L., J.M., G.V., R.S.), Centro Hospitalar Universitário de Santo António, Porto, Portugal
  • Find this author on Google Scholar
  • Find this author on PubMed
  • Search for this author on this site
José Maria Sousa
eDepartment of Neuroradiology (J.M.S.), Centro Hospitalar Universitário de São João, Porto, Portugal
  • Find this author on Google Scholar
  • Find this author on PubMed
  • Search for this author on this site
Gonçalo Videira
dDepartment of Neurology (J.L., J.M., G.V., R.S.), Centro Hospitalar Universitário de Santo António, Porto, Portugal
  • Find this author on Google Scholar
  • Find this author on PubMed
  • Search for this author on this site
Raquel Samões
dDepartment of Neurology (J.L., J.M., G.V., R.S.), Centro Hospitalar Universitário de Santo António, Porto, Portugal
fUnit for Multidisciplinary Research in Biomedicine (R.S.), Instituto de Ciências Biomédicas de Abel Salazar da Universidade do Porto, Porto, Portugal
  • Find this author on Google Scholar
  • Find this author on PubMed
  • Search for this author on this site
  • ORCID record for Raquel Samões
Tiago Gil Oliveira
bLife and Health Sciences Research Institute (F.C.A., T.G.O.), School of Medicine, University of Minho, Braga, Portugal
cLife and Health Sciences Research Institute/3B’s-PT Government Associate Laboratory (F.C.A., T.G.O.), Braga/Guimarães, Portugal
gDepartment of Neuroradiology (T.G.O.), Hospital de Braga, Braga, Portugal
  • Find this author on Google Scholar
  • Find this author on PubMed
  • Search for this author on this site
  • ORCID record for Tiago Gil Oliveira
  • Article
  • Figures & Data
  • Supplemental
  • Info & Metrics
  • Responses
  • References
  • PDF
Loading

Abstract

BACKGROUND: Antibodies against leucine-rich glioma inactivated protein 1 (LGI1) constitute a common form of autoimmune encephalitis. On MR imaging, it may show T2 FLAIR hyperintensities of the medial temporal lobe (T2 FLAIR-MTL), involve the basal ganglia, or be unremarkable.

PURPOSE: We performed a systematic review and meta-analysis to obtain prevalence estimates of abnormal findings on MR imaging in anti-LGI1 encephalitis. A human brain map of the LGI1 microarray gene expression was derived from the Allen Human Brain Atlas.

DATA SOURCES: PubMed and Web of Science were searched with the terms “LGI1” and “encephalitis” from inception to April 7, 2022.

STUDY SELECTION: Thirty-one research publications, encompassing case series and retrospective cohort and case-control studies, with >10 patients with anti-LGI1 encephalitis and MR imaging data were included.

DATA ANALYSIS: Pooled prevalence estimates were calculated using Freeman-Tukey double-arcsine transformation. Meta-analysis used DerSimonian and Laird random effects models.

DATA SYNTHESIS: Of 1318 patients in 30 studies, T2 FLAIR-MTL hyperintensities were present in 54% (95% CI, 0.48–0.60; I2 = 76%). Of 394 patients in 13 studies, 27% showed bilateral (95% CI, 0.19–0.36; I2 = 71%) and 24% unilateral T2 FLAIR-MTL abnormalities (95% CI, 0.17–0.32; I2 = 61%). Of 612 patients in 15 studies, basal ganglia abnormalities were present in 10% (95% CI, 0.06–0.15; I2 = 67%). LGI1 expression was highest in the amygdala, hippocampus, and caudate nucleus.

LIMITATIONS: Only part of the spectrum of MR imaging abnormalities in anti-LGI1 encephalitis could be included in a meta-analysis. MR imaging findings were not the main outcomes in most studies, limiting available information. I2 values ranged from 62% to 76%, representing moderate-to-large heterogeneity.

CONCLUSIONS: T2 FLAIR-MTL hyperintensities were present in around one-half of patients with anti-LGI1. The prevalence of unilateral and bilateral presentations was similar, suggesting unilaterality should raise the suspicion of this disease in the appropriate clinical context. Around 10% of patients showed basal ganglia abnormalities, indicating that special attention should be given to this region. LGI1 regional expression coincided with the most frequently reported abnormal findings on MR imaging. Regional specificity might be partially determined by expression levels of the target protein.

ABBREVIATIONS:

ADAM
a disintegrin and metalloprotease domain
AIE
autoimmune encephalitis
AMPA
α-amino-3-hydroxy-5-methyl-4-isoxazolepropionic acid
BG
basal ganglia
CASPR2
contactin-associated protein-like 2
EEG
electroencephalogram
FBDS
faciobrachial dystonic seizures
LGI1
leucine-rich glioma inactivated protein 1
MTL
medial temporal lobe

Antibodies against leucine-rich glioma inactivated protein 1 (LGI1) characterize the second most common form of autoimmune encephalitis (AIE).1 These antibodies were first described in 2010 and were previously clustered within voltage-gated potassium channel antibodies, which included contactin-associated protein-like 2 (CASPR2) along with LGI1.2 The LGI1 protein is widely expressed in the CNS and particularly in neurons, where it forms a trans-synaptic protein complex that regulates ion channel and synaptic activity.3,4

This disease typically presents with subacute cognitive impairment and epilepsy, but faciobrachial dystonic seizures (FBDS) are the most distinctive clinical feature. Although presenting across a wide variety of ages, it is thought to be most common in those older than 60 years of age.3 The clinical presentation thus leads to a vast differential diagnosis, in which clinical suspicion plays an important role.5,6 MR imaging is relevant in supporting the diagnosis of AIE and excluding alternative diagnoses. Characteristically, it involves medial temporal lobe (MTL) hyperintensities on T2 FLAIR sequences, which represent a criterion for a definite diagnosis of AIE when observed bilaterally (Fig 1A).7,8 This laterality issue is because in the absence of antibody confirmation, unilateral hippocampal/MTL abnormalities have a wider radiologic differential diagnosis.7,9 The main diagnostic considerations in this imaging presentation include seizure-related MR imaging abnormalities;10 viral encephalitis, particularly herpes simplex virus 1 and 2 and human herpesvirus 6;11 neurosyphilis;12 Whipple disease,13 temporal lobe glioma,14 and acute posterior circulation ischemic infarction.15

FIG 1.
  • Download figure
  • Open in new tab
  • Download powerpoint
FIG 1.

Illustrative examples of signal abnormalities in 2 cases of confirmed anti-LGI1 encephalitis, one with medial temporal lobe T2-FLAIR hyperintensities (A) and another with right BG T2-FLAIR hyperintensity (B).

However, not all cases of anti-LGI1 encephalitis present with MTL abnormalities at the time of MR imaging. MR imaging can also be unremarkable or show basal ganglia (BG) involvement (Fig 1B).16 Moreover, given the relatively recent description of the wide range of antibodies causing AIE, MR imaging findings are not yet thoroughly described for each antibody group.8,17 It is, therefore, important to provide prevalence estimates of MR imaging abnormalities in the literature for each type of antibody-mediated encephalitis. Indeed, given the wide clinical and brain imaging differential diagnoses involved in these cases, detailing the prevalence of specific patterns of abnormal findings on MR imaging for each encephalitis might aid the radiologist in providing a narrower differential while waiting for laboratory results.

Furthermore, abnormalities on MR imaging are likely reflective of pathophysiologic mechanisms. Characterizing the topography of the most frequently reported abnormalities may shed light on the underlying causative pathology. Although most studies have focused on LGI1 expression in rodent models derived from immunohistochemistry or patient-derived antibodies,3,4 a human brain map of the LGI1 gene might reveal why selective brain areas are impacted in this disease.

In this study, we performed a systematic review and meta-analysis of the proportion of MTL and BG MR imaging signal abnormalities in LGI1 encephalitis. Moreover, we used the publicly accessible Allen Human Brain Atlas (https://human.brain-map.org) to derive a LGI1 gene expression map of the human brain, which can provide potential hints as to why LGI1 encephalitis preferentially affects certain brain regions.

MATERIALS AND METHODS

This systematic review and meta-analysis was conducted in accordance with the PRISMA guidelines.18

Search Strategy and Selection Criteria

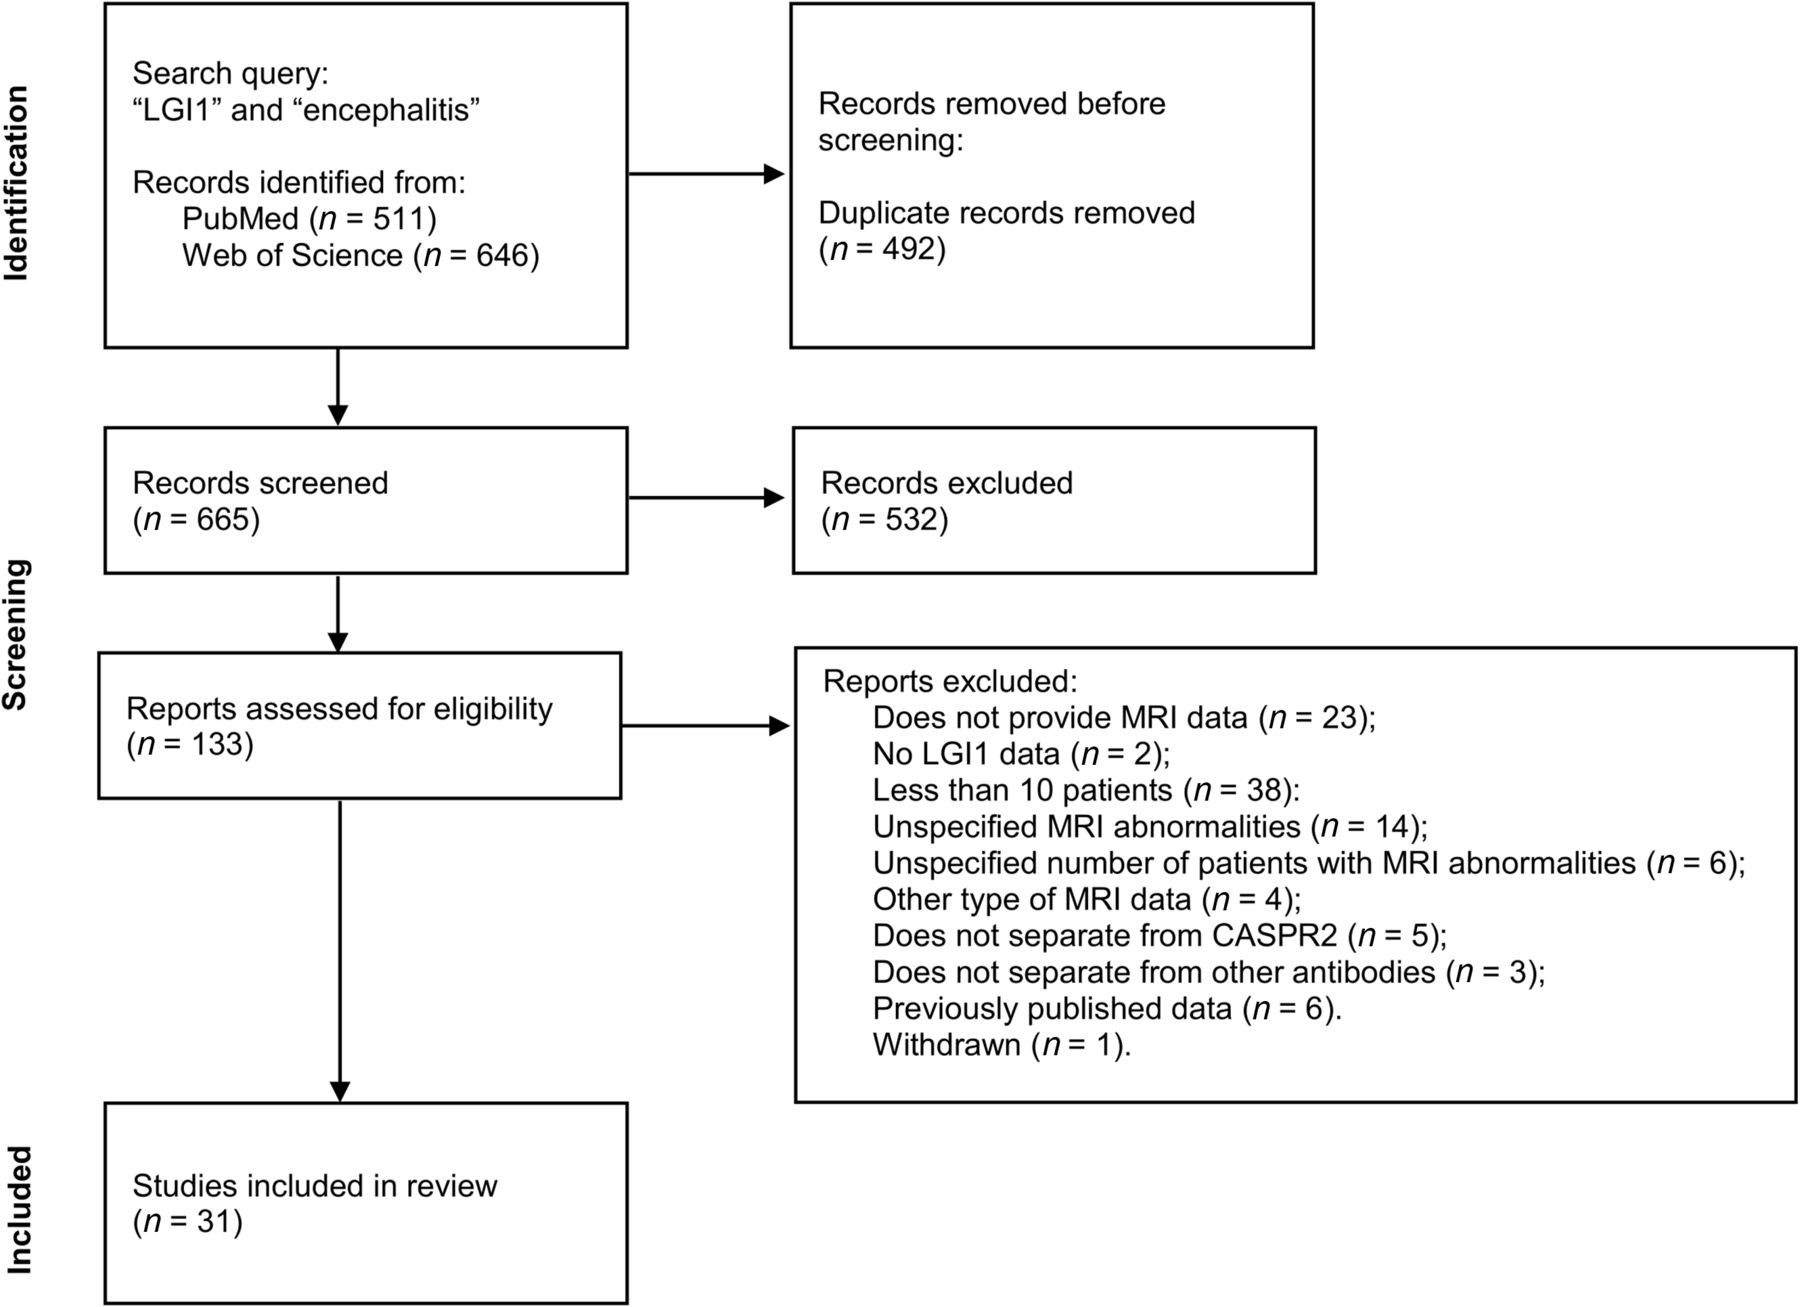
We searched PubMed and the Web of Science from inception to April 7, 2022, using the search terms “LGI1” and “encephalitis.” PubMed had 511 publications and the Web of Science had 646 publications. Bibliographic sources from selected articles were also used to assess research publications for eligibility. Original research articles, including case series, retrospective or prospective cohort studies, and case-control studies were considered for selection. Case reports, systematic reviews, meta-analyses, review articles, and other nonoriginal research publications were excluded during screening. Only studies conducted with human participants and published in English were considered. The number of each article type found during screening is provided in the Online Supplemental Data.

Inclusion and Exclusion Criteria

Research publications were eligible if they included a clinical population of LGI1 encephalitis and reported >10 cases, when revealed in the abstract. The clinical definition of LGI1 encephalitis was then confirmed on inspection of the publications to comply with definite autoimmune encephalitis, requiring detection of anti-LGI1 antibodies on CSF and/or serum.7 Exclusion criteria after retrieval were the following: the study did not present MR imaging data, did not clearly specify the MR imaging abnormalities/brain location/MR imaging sequence used, did not use T2-FLAIR sequences or used other types of MR imaging data not widely used in clinical practice, had ≤10 patients with LGI1 encephalitis, did not separate LGI1 from CASPR2 encephalitis or from other autoantibodies; and the data were previously published in other research publications, there was no accessibility of the full text, or the article had low manuscript quality.

Data Extraction

Two authors independently screened titles and abstracts and assessed the full text for eligibility (F.C.A., A.I.P). Discrepancies were solved after discussion between the 2 authors. Clinical data (J.L., J.M.), electroencephalogram (EEG) data (G.V., F.C.A.), and neuroimaging data (F.C.A., C.M.-P.) were extracted independently by 2 authors. When necessary, discrepancies were solved by a third party (clinical: R.S.; neuroimaging: T.G.O.). The quality of the studies was assessed independently by 2 authors (F.C.A. and A.I.P.) on the basis of a previously published tool for prevalence studies.19 This tool consists of 10 items consisting of 4 external validity and 6 internal validity items, the sum score of which provides a summary assessment of the risk of bias.

Data Analysis

Pooled prevalence estimates of neuroimaging findings were calculated using Freeman-Tukey double-arcsine transformation. Meta-analysis was conducted using DerSimonian and Laird random-effects models. Heterogeneity was calculated using I2 statistics, and the Cochran Q test was used to assess statistical significance. The metaprop package in R (https://www.rdocumentation.org/packages/meta/versions/6.2-1/topics/metaprop) was used for this analysis.

Metaregression analysis was conducted to assess modifiers of prevalence. Clinical symptoms and CSF antibody positivity were used in univariate models to assess the effects on the prevalence of both T2 MTL hyperintensities and BG signal abnormalities (T2 hyperintensities and T1 hypo- and hyperintensities). Studies with missing data on modifier variables were excluded. R2 was used to assess the proportion of the heterogeneity explained by the modifier, the P value of the Quantitative Methods statistics was used for statistical significance, and I2, for residual heterogeneity left unexplained. The Meta package in R was used for this analysis (https://cran.r-project.org/web/packages/meta/index.html).

Publication bias was assessed with visual inspection of funnel plots and assessed for statistical significance using the Egger weighted linear regression test. The meta package in R was used for this analysis.

LGI1 Gene Brain-Expression Map

Regional microarray expression data were obtained from 6 postmortem brains (1 woman; age range, 24.0–57.0 years; mean age, 42.50 [SD, 13.38] years) provided by the Allen Human Brain Atlas.20 Data were processed with the abagen toolbox (version 0.1.3; https://github.com/rmarkello/abagen) using an 83-region volumetric atlas in Montreal Neurological Institute space. First, microarray probes were reannotated using data provided by Arnatkeviciute et al.21 Probes not matched to a valid Entrez ID were discarded. Next, probes were filtered on the basis of their expression intensity relative to background noise22 so that probes with intensity less than the background in ≥50% of samples across donors were discarded, yielding 31,569 probes. When multiple probes indexed the expression of the same gene, we selected and used the probe with the most consistent pattern of regional variation across donors (ie, differential stability23). Here, regions correspond to the structural designations provided in the ontology from the Allen Human Brain Atlas. The Montreal Neurological Institute coordinates of tissue samples were updated to those generated via nonlinear registration using the Advanced Normalization Tools (ANTs; http://stnava.github.io/ANTs/). Samples were assigned to brain regions in the provided atlas if their Montreal Neurological Institute coordinates were within 2 mm of a given parcel.

To reduce the potential for misassignment, sample-to-region matching was constrained by hemisphere and gross structural divisions (ie, cortex, subcortex/brainstem, and cerebellum, such that for example, a sample in the left cortex could only be assigned to an atlas parcel in the left cortex21). All tissue samples not assigned to a brain region in the provided atlas were discarded. Intersubject variation was addressed by normalizing tissue sample expression values across genes using a robust sigmoid function.24 Normalized expression values were then rescaled to the unit interval. Gene expression values were then normalized across tissue samples using an identical procedure. Samples assigned to the same brain region were averaged separately for each donor and then across donors, yielding a regional expression matrix with 83 rows corresponding to brain regions and 15,633 columns corresponding to the retained genes. Normalized gene expression values were then plotted in a brain map using the ggseg R package (https://cran.r-project.org/web/packages/ggseg/index.html)25 with a Desikan-Killiany atlas.

Data Availability

Data used in this meta-analysis will be provided at request.

RESULTS

Study and Clinical Characteristics

In this study, we included 31 research publications (Fig 2).5,16,26-54 Two studies reported partially on the same patients but focused on different neuroimaging findings.16,50 For summary statistics regarding each of the clinical and neuroimaging findings, we excluded the publication with fewer patients. In total, the sample was composed of 1409 patients with anti-LGI1 encephalitis. The mean quality-assessment score of the research publications was 3, indicating overall good quality (Online Supplemental Data).

FIG 2.
  • Download figure
  • Open in new tab
  • Download powerpoint
FIG 2.

Study selection flow chart.18 PubMed and Web of Science were searched for the terms “LGI1” and “encephalitis.” Of 665 records screened, 133 were assessed for eligibility, resulting in 31 included publications.

Most of the studies were retrospective and based on clinical cohorts, with some studies drawing their sample from EEG or PET cohorts. Case definition was mostly based on criteria for definite AIE,7 with 3 studies basing their definition on FBDS and LGI1 antibody positivity.16,43,49

Table 1 reports summary statistics for the whole study population. The mean age was 61.4 years, and 64% of patients were men. Seventy-eight percent of the patients presented with cognitive impairment (1095 of 1409). For FBDS, 27 studies presented data, totaling 1252 patients, among whom 639 (51%) had FBDS at any point in time. Twenty-eight studies reported seizures other than FBDS, totaling 1368 patients, of whom 989 (72%) were affected. Twenty-four studies, encompassing 1146 patients included data on hyponatremia, among whom 512 (45%) patients presented with low serum sodium. Consciousness impairment was evaluated in 12 studies with 574 patients and was present in 180 (31%). Autonomic dysfunction was present in 155 patients of 812 (19%) in 15 studies. Sleep disorder was present in 417 patients of 1166 (36%) in the 21 studies that reported data on this symptom. Of 1203 patients, 612 in 25 studies presented with psychiatric symptoms (51%). Hallucinations were present in 80 of 493 patients (16%) in 9 studies. Personality changes and psychosis (unspecified) were among other symptoms reported in the included literature. In 14 studies with 713 patients, CSF antibody positivity was found in 457 (64%). In 19 studies with data on EEG, 508 of 698 patients (73%) presented with abnormal findings.

View this table:
  • View inline
  • View popup
Table 1:

Summary statistics for the whole study population

Neuroimaging Findings

Of the whole sample of 1409 patients, 1318 had reported data on MR imaging. Thirty studies reported data on T2 or T2 FLAIR-MTL hyperintensities. Meta-analysis of the proportion of patients with T2 FLAIR-MTL revealed that this finding was present in 54% of patients (Fig 3; 95% CI, 0.48–0.60; I2 = 76%). Thirteen studies reported T2 FLAIR-MTL laterality with a total of 394 patients. Meta-analysis revealed 27% with bilateral T2-MTL findings (Fig 4A; 95% CI, 0.19–0.36; I2 = 71%) and 24% with unilateral abnormalities (Fig 4B; 95% CI, 0.17–0.32; I2 = 61%) of the whole population (ie, with and without T2-MTL abnormalities).

FIG 3.
  • Download figure
  • Open in new tab
  • Download powerpoint
FIG 3.

Forest plot showing the prevalence of T2 FLAIR-MTL hyperintensities. Of 1318 patients in 30 studies, 54% presented with this signal abnormality.

FIG 4.
  • Download figure
  • Open in new tab
  • Download powerpoint
FIG 4.

Forest plots showing the prevalence of bilateral T2 FLAIR-MTL hyperintensities (27% of 394 patients in 13 studies) (A) and unilateral MTL T2 FLAIR-MTL hyperintensities (24% of 394 patients in 13 studies) (B).

Fifteen studies encompassing 612 patients reported data on BG MR imaging signal abnormalities, which included T2 hyperintensities and T1 hypo- and hyperintensities. Altogether, meta-analysis of proportions revealed these signal abnormalities to be present in 10% of patients (Fig 5; 95% CI, 0.06–0.15; I2 = 67%).

FIG 5.
  • Download figure
  • Open in new tab
  • Download powerpoint
FIG 5.

Forest plot showing the prevalence of BG signal abnormalities (T2-FLAIR hyperintensities and T1 hypo- and hyperintensities with 10% of 612 patients having these abnormalities).

Inspection of funnel plots and linear regression testing for funnel asymmetry did not reveal a significant potential for publication bias (Online Supplemental Data).

Although not reported frequently enough to undergo meta-analysis, studies showed anti-LGI1 encephalitis with other regional and MR abnormalities.26,-,38,40,41,43,45⇓⇓-48,51,54 Amygdala, insula, and other neocortical T2-FLAIR hyperintensities were found in around 10%, 8%, and 18% of patients, respectively (Table 2). Two patients presented with cortical diffusion restriction (2%). Leptomeningeal gadolinium enhancement was described in 3 patients (5%). MTL swelling was reported in 18 patients (15%), and atrophy, in 55 patients (16%), whereas gadolinium enhancement was found in 5 patients (3%). In the studies with available longitudinal follow-up, 46% of patients of 154 in 6 studies developed atrophy or mesial temporal sclerosis. BG atrophy was reported in 3 patients (3%). Neocortical and cerebellum gadolinium enhancement was described in 1 patient each in 1 study.27 Diffusion restriction in the basal ganglia was reported in 1 study.16

View this table:
  • View inline
  • View popup
Table 2:

Other MR imaging abnormalities associated with anti-LGI1 encephalitis

Given the high heterogeneity found in the meta-analysis of these neuroimaging findings, we performed meta-regression analysis for T2-MTL and BG signal abnormalities with clinical predictors (Online Supplemental Data). We did not find any statistically significant modifiers of the proportion of MR imaging signal abnormalities.

LGI1 Gene Expression Map of the Human Brain

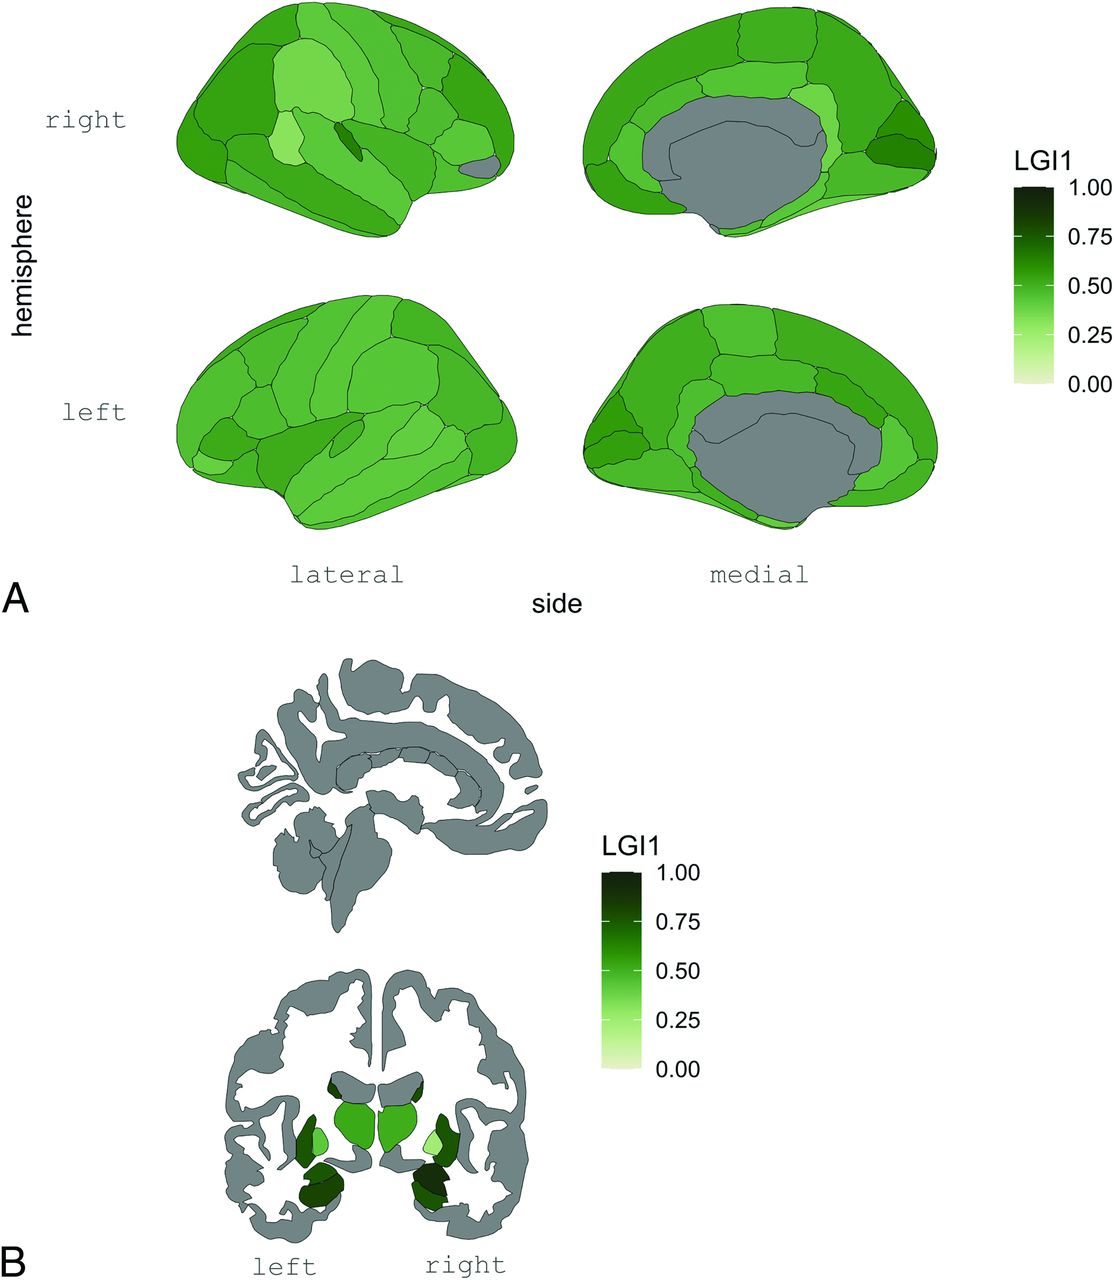
To assess whether the LGI1 gene is differentially expressed in the selective regions affected on MR imaging, we next used publicly available data from the Allen Human Brain Atlas to create a gene-expression brain map. We found that LGI1 is expressed widely across the cortex but is particularly predominant in subcortical regions, namely, the amygdala, hippocampus, and caudate nucleus (Fig 6A,-B; and Online Supplemental Data).

FIG 6.
  • Download figure
  • Open in new tab
  • Download powerpoint
FIG 6.

LGI1 gene expression in the cortical (A) and subcortical (B) regions derived from the Allen Human Brain Atlas. In this figure, LGI1 gene expression is shown to be higher in the MTLs and BG, concordant with the main MR imaging signal abnormality findings, suggesting that regional brain susceptibility in anti-LGI1 encephalitis might be mediated by the relative levels of brain regional expression of this gene.

DISCUSSION

In this systematic review and meta-analysis, we focused on neuroimaging findings of anti-LGI1 encephalitis. We included 31 studies and 1409 patients. Our studied population had a mean age of 61.4 years and a mild predominance of male patients (64%). The most frequently reported symptoms were cognitive impairment, seizures other than FBDS, followed by FBDS and psychiatric symptoms. These clinical and demographic characteristics are in agreement with those in previous studies.55

We found that 54% of patients presented with T2-FLAIR hyperintensities of the MTL (Fig 3). This finding reinforces the idea that a negative MR imaging in anti-LGI1 encephalitis is frequent. In a subgroup analysis, unilateral and bilateral presentations were similar, with a prevalence of 24% and 27%, respectively (Fig 4A, -B). This finding suggests that in the appropriate clinical context, the presence of unilateral MTL abnormalities on MR imaging should raise the possibility of AIE, namely anti-LGI1 encephalitis, and may aid in therapeutic decisions while awaiting antibody confirmation. A common imaging differential diagnosis for T2 FLAIR-MTL hyperintensities frequently associated with volume expansion includes other autoimmune/paraneoplastic encephalitis cases, among which the neuronal-surface antigen group includes NMDAR,56 CASPR2,57,58 GABA-B,59,60 Neurexin-3a,61 AMPAR,62,63 mGluR5,64 GlyR,65,66 AK5,67 and DPPX6,68 and in the intracellular antigen group includes GAD65,69 Hu,8 amphiphysin,70 and Ma2.71 Viral encephalitis,11 neurosyphilis,12 Whipple disease,13 glioma,14 ictal changes,9 and posterior circulation stroke15 are among other important diagnostic considerations. Depending on the time of imaging, anti-LGI1 encephalitis might already have presented with hippocampal atrophy, in which case neurodegenerative diseases, including Alzheimer disease,72,73 frontotemporal dementia,74 and limbic-predominant age-related TDP-43 encephalopathy,75 as well as medial temporal sclerosis of other causes, are to be included in the differential diagnosis. Other causes to consider, depending on clinical presentation and other associated signal changes, include metabolic and mitochondrial disorders.76

Notably, BG signal abnormalities, encompassing both T2 and T1 hyperintensities and T1 hypointensities, were reported in around 10% of patients (Fig 5). The available number of studies providing information regarding the BG was substantially smaller than that for the MTL. However, these changes can be the sole signal alteration observed on MR imaging and might be unilateral16 (Fig 1B), suggesting that this brain region deserves detailed attention when suspecting AIE. In fact, LGI1 expression is high in the BG in humans (Fig 6B), and [18F] fluorodeoxyglucose PET studies have repeatedly shown metabolic alterations in these regions.27,39,41 Most important, these lesions can present with diffusion restriction,16 the cause of which is unknown. Ischemic infarction is thus an important differential diagnosis, and attention to clinical presentation is crucial.

The nature of T1 hyperintensities of the BG is also not yet understood. Underlying causes of T1 relaxation time shortening included blood, fat, high paramagnetic substances such as iron, and high protein content. In anti-LGI1 encephalitis, BG T1-hyperintensities are sometimes preceded by T2-hyperintensities and have been shown to remain for a longer time than the latter before resolving.16 A putative explanation might be the accumulation of proteins at the site of antibody engagement, which persists after initial inflammatory changes. A parallel explanation has been drawn for T1 pallidal hyperintensities in Creutzfeldt-Jakob disease, where accumulation of prion protein, confirmed at neuropathology, was correlated with this MR imaging signal abnormality.77 Signal alterations in the BG have a vast differential diagnosis, which includes toxic and metabolic disorders,78 among which hepatic failure and Wilson disease are important considerations, Creutzfledt-Jakob disease,79 other autoimmune encephalitis (eg, CV2/collapsin response mediated protein 5),80 viral encephalitis,11 and arterial and venous infarction, among others.81

Other brain regions were found to be altered in LGI1 encephalitis, namely, the amygdala, insula, cerebellum, and different regions of the neocortex, with signal abnormalities across T1 with gadolinium enhancement, T2 and diffusion MR imaging, as well as leptomeningeal gadolinium enhancement. This finding suggests that LGI1 AIE can present with a widespread variety of signal abnormalities across multiple brain regions and multiple MR imaging sequences. Moreover, the under-reporting of altered signal beyond the MTL indicates that there is a need for further research in systematizing MR imaging signal abnormalities in LGI1 encephalitis across the whole brain.

In the studies that included a follow-up period, 46% of patients went on to develop hippocampal atrophy or mesial temporal sclerosis (Table 2). These results support the concept that anti-LGI1 encephalitis might induce a neurodegenerative process in a large proportion of patients, which might be associated with remaining cognitive deficits.82 Detection of these imaging findings by the radiologist in serial scans provides useful information for the clinician.

To assess qualitatively whether MR imaging abnormalities tend to occur at brain regions most enriched for LGI1 gene expression, we generated a brain map using the publicly available Allen Human Brain Atlas. Regions with the highest expression were the amygdala, hippocampus, and caudate (Fig 6), suggesting that at least partially, the selective appearance of abnormalities on MR imaging might be due to the relative expression of LGI1. The LGI1 protein is expressed at the synapse, where binding presynaptic a disintegrin and metalloprotease domain 23 (ADAM23) and postsynaptic ADAM22 forms a trans-synaptic tether that couples presynaptic voltage-gated potassium channels and postsynaptic AMPA (α-amino-3-hydroxy-5-methyl-4-isoxazolepropionic acid) receptors, thereby regulating synaptic activity.3 Evidence from animal models has shown that patient-derived anti-LGI1 antibodies induce important impairment of synaptic plasticity,83,84 neuronal excitability85 and memory in rodents.83,84 This evidence supports the pathogenicity of the antibody and the hypothesis that higher expression of the target antigen might be a contributing factor to explain brain regional susceptibility in these diseases. The accessibility of the antibodies to these brain regions is also a putative contributing factor. Many patients presenting without MR imaging signal abnormalities suggests that only in certain cases is the underlying pathophysiologic mechanism capable of generating a detectable change on MR imaging. The reasons are still to be explored. PET imaging approaches might unravel promising biologic markers of disease activity in the acute phase.86

While these results provide the first estimate of neuroimaging signal abnormalities reported in the literature for LGI1 encephalitis, this study has important limitations. Even though MR imaging signal abnormality is likely to be present at the time of symptom onset, we were unable to report any analysis on this parameter. Moreover, neuroimaging findings were not the main outcome in most studies. While we did not find any clinical modifiers on the prevalence of these neuroimaging findings, not all studies provided data for all subjects who underwent MR imaging. More research is needed to establish whether signal abnormalities on MR imaging correlate with clinical presentation or other auxiliary tests. Finally, the specific MR imaging sequence parameters and magnetic field strength of the scanner were not taken into account in the analyses.

Most important, a considerable number of studies were excluded due to incomplete reporting on MR imaging data (Fig 2). These results lead us to highlight the need to include detailed MR imaging descriptions in a disease that can present with a variety of signal abnormalities across various MR imaging sequences.

CONCLUSIONS

This study presents a first approach to estimate the main findings of anti-LGI1 AIE on MR imaging and underlines the importance of considering this diagnosis in the context of unilateral signal abnormalities of the MTL, while also calling for detailed attention to the BG with suspicion of this disease. Most interesting, these regions express the LGI1 gene at high levels, thus lending support to the hypothesis that the regions affected by autoimmunity might be at least partially determined by the expression levels of the target protein.

Acknowledgments

We thank Dr Alexandra Rodrigues from the Neuroradiology Department of Centro Hospitalar Universitário de São José for her valuable input.

Footnotes

  • ↵† Raquel Samões and Tiago Gil Oliveira contributed equally to this work.

  • Disclosure forms provided by the authors are available with the full text and PDF of this article at www.ajnr.org.

References

  1. 1.↵
    1. Hébert J,
    2. Riche B,
    3. Vogrig A, et al
    . Epidemiology of paraneoplastic neurologic syndromes and autoimmune encephalitides in France. Neurol Neuroimmunol Neuroinflamm 2020;7:e883 doi:10.1212/NXI.0000000000000883 pmid:32847939
    Abstract/FREE Full Text
  2. 2.↵
    1. Irani SR,
    2. Alexander S,
    3. Waters P, et al
    . Antibodies to Kv1 potassium channel-complex proteins leucine-rich, glioma inactivated 1 protein and contactin-associated protein-2 in limbic encephalitis, Morvan’s syndrome and acquired neuromyotonia. Brain 2010;133:2734–48 doi:10.1093/brain/awq213 pmid:20663977
    CrossRefPubMed
  3. 3.↵
    1. Baudin P,
    2. Cousyn L,
    3. Navarro V
    . The LGI1 protein: molecular structure, physiological functions and disruption-related seizures. Cell Mol Life Sci 2021;79:16 doi:10.1007/s00018-021-04088-y pmid:34967933
    CrossRefPubMed
  4. 4.↵
    1. Fels E,
    2. Muñiz-Castrillo S,
    3. Vogrig A, et al
    . Role of LGI1 protein in synaptic transmission: from physiology to pathology. Neurobiol Dis 2021;160:105537 doi:10.1016/j.nbd.2021.105537 pmid:34695575
    CrossRefPubMed
  5. 5.↵
    1. Bastiaansen AE,
    2. van Steenhoven RW,
    3. de Bruijn MA, et al
    . Autoimmune encephalitis resembling dementia syndromes. Neurol Neuroimmunol Neuroinflamm 2021;8:e1039 doi:10.1212/NXI.0000000000001039 pmid:34341093
    Abstract/FREE Full Text
  6. 6.↵
    1. Costa D,
    2. Sardoeira A,
    3. Carneiro P, et al
    . Autoimmune encephalitis: suspicion in clinical practice and mimics. J Neuroimmunol 2022;365:577824 doi:10.1016/j.jneuroim.2022.577824 pmid:35202952
    CrossRefPubMed
  7. 7.↵
    1. Graus F,
    2. Titulaer MJ,
    3. Balu R, et al
    . A clinical approach to diagnosis of autoimmune encephalitis. Lancet Neurol 2016;15:391–404 doi:10.1016/S1474-4422(15)00401-9 pmid:26906964
    CrossRefPubMed
  8. 8.↵
    1. Kelley BP,
    2. Patel SC,
    3. Marin HL, et al
    . Autoimmune encephalitis: pathophysiology and imaging review of an overlooked diagnosis. AJNR Am J Neuroradiol 2017;38:1070–78 doi:10.3174/ajnr.A5086 pmid:28183838
    Abstract/FREE Full Text
  9. 9.↵
    1. Alves IS,
    2. Coutinho AM,
    3. Vieira AP, et al
    . Imaging aspects of the hippocampus. Radiographics 2022;42:822–40 doi:10.1148/rg.210153 pmid:35213261
    CrossRefPubMed
  10. 10.↵
    1. Kim SE,
    2. Lee BI,
    3. Shin KJ, et al
    . Characteristics of seizure-induced signal changes on MRI in patients with first seizures. Seizure 2017;48:62–68 doi:10.1016/j.seizure.2017.04.005 pmid:28419949
    CrossRefPubMed
  11. 11.↵
    1. Ramli NM,
    2. Bae YJ
    . Structured imaging approach for viral encephalitis. Neuroimaging Clin N Am 2023;33:43–56 doi:10.1016/j.nic.2022.07.002 pmid:36404046
    CrossRefPubMed
  12. 12.↵
    1. Abdelerahman KT,
    2. Santamaria DD,
    3. Rakocevic G
    . Pearls and oy-sters: neurosyphilis presenting as mesial temporal encephalitis. Neurology 2012;79:e206–08 doi:10.1212/WNL.0b013e318278b5a1 pmid:23233688
    Abstract/FREE Full Text
  13. 13.↵
    1. Black DF,
    2. Aksamit AJ,
    3. Morris JM
    . MR imaging of central nervous system Whipple disease: a 15-year review. AJNR Am J Neuroradiol 2010;31:1493–97 doi:10.3174/ajnr.A2089 pmid:20395395
    Abstract/FREE Full Text
  14. 14.↵
    1. Zoccarato M,
    2. Valeggia S,
    3. Zuliani L, et al
    . Conventional brain MRI features distinguishing limbic encephalitis from mesial temporal glioma. Neuroradiology 2019;61:853–60 doi:10.1007/s00234-019-02212-1 pmid:31028423
    CrossRefPubMed
  15. 15.↵
    1. Salerno A,
    2. Strambo D,
    3. Nannoni S, et al
    . Patterns of ischemic posterior circulation strokes: aclinical, anatomical, and radiological review. Int J Stroke 2022;17:714–22 doi:10.1177/17474930211046758 pmid:34581223
    CrossRefPubMed
  16. 16.↵
    1. Flanagan EP,
    2. Kotsenas AL,
    3. Britton JW, et al
    . Basal ganglia T1 hyperintensity in LGI1-autoantibody faciobrachial dystonic seizures. Neurol Neuroimmunol Neuroinflamm 2015;2:e161 doi:10.1212/NXI.0000000000000161 pmid:26468474
    Abstract/FREE Full Text
  17. 17.↵
    1. Dalmau J,
    2. Graus F
    . Antibody-mediated encephalitis. N Engl J Med 2018;378:840–51 doi:10.1056/NEJMra1708712 pmid:29490181
    CrossRefPubMed
  18. 18.↵
    1. Moher D,
    2. Liberati A,
    3. Tetzlaff J, et al
    ; PRISMA Group. Preferred reporting items for systematic reviews and meta-analyses: the PRISMA statement. PLoS Med 2009;6:e1000097 doi:10.1371/journal.pmed.1000097 pmid:19621072
    CrossRefPubMed
  19. 19.↵
    1. Hoy D,
    2. Brooks P,
    3. Woolf A, et al
    . Assessing risk of bias in prevalence studies: modification of an existing tool and evidence of interrater agreement. J Clin Epidemiol 2012;65:934–39 doi:10.1016/j.jclinepi.2011.11.014 pmid:22742910
    CrossRefPubMed
  20. 20.↵
    1. Hawrylycz MJ,
    2. Lein ES,
    3. Guillozet-Bongaarts AL, et al
    . An anatomically comprehensive atlas of the adult human brain transcriptome. Nature 2012;489:391–99 doi:10.1038/nature11405 pmid:22996553
    CrossRefPubMed
  21. 21.↵
    1. Arnatkeviciute A,
    2. Fulcher BD,
    3. Fornito A
    . A practical guide to linking brain-wide gene expression and neuroimaging data. NeuroImage 2019;189:353–67 doi:10.1016/j.neuroimage.2019.01.011 pmid:30648605
    CrossRefPubMed
  22. 22.↵
    1. Quackenbush J
    . Microarray data normalization and transformation. Nat Genet 2002;32(Suppl):496–501 doi:10.1038/ng1032 pmid:12454644
    CrossRefPubMed
  23. 23.↵
    1. Hawrylycz M,
    2. Miller JA,
    3. Menon V, et al
    . Canonical genetic signatures of the adult human brain. Nat Neurosci 2015;18:1832–44 doi:10.1038/nn.4171 pmid:26571460
    CrossRefPubMed
  24. 24.↵
    1. Fulcher BD,
    2. Little MA,
    3. Jones NS
    . Highly comparative time-series analysis: the empirical structure of time series and their methods. J R Soc Interface 2013;10:20130048 doi:10.1098/rsif.2013.0048 pmid:23554344
    CrossRefPubMed
  25. 25.↵
    1. Mowinckel AM,
    2. Vidal-Piñeiro D
    . Visualization of brain statistics with R packages ggseg and ggseg3d. Advances in Methods and Practices in Psychological Science 2020;3:466–83 doi:10.1177/2515245920928009
    CrossRef
  26. 26.↵
    1. Guo K,
    2. Liu X,
    3. Lin J, et al
    . Clinical characteristics, long-term functional outcomes and relapse of anti-LGI1/Caspr2 encephalitis: a prospective cohort study in Western China. Ther Adv Neurol Disord 2022;15:17562864211073203 doi:10.1177/17562864211073203 pmid:35069805
    CrossRefPubMed
  27. 27.↵
    1. Rissanen E,
    2. Carter K,
    3. Cicero S, et al
    . Cortical and subcortical dysmetabolism are dynamic markers of clinical disability and course in anti-LGI1 encephalitis. Neurol Neuroimunol Neuroinflamm 2022;9:e1136 doi:10.1212/NXI.0000000000001136 pmid:35091466
    Abstract/FREE Full Text
  28. 28.↵
    1. Yang M,
    2. Lian Y
    . Clinical features and early recognition of 242 cases of autoimmune encephalitis. Front Neurol 2021;12:803752 doi:10.3389/fneur.2021.803752 pmid:35095744
    CrossRefPubMed
  29. 29.↵
    1. Cui L,
    2. Boltze J,
    3. Zhang Y
    . Positive LGI1 antibodies in CSF and relapse relate to worse outcome in anti-LGI1 encephalitis. Front Immunol 2021;12:772096 doi:10.3389/fimmu.2021.772096 pmid:34975858
    CrossRefPubMed
  30. 30.↵
    1. Nissen MS,
    2. Ryding M,
    3. Nilsson AC, et al
    . CSF-neurofilament light chain levels in NMDAR and LGI1 encephalitis: a national cohort study. Front Immunol 2021;12:719432 doi:10.3389/fimmu.2021.719432 pmid:34975832
    CrossRefPubMed
  31. 31.↵
    1. Zhao X,
    2. Zhao S,
    3. Chen Y, et al
    . Subcortical hypermetabolism associated with cortical hypometabolism is a common metabolic pattern in patients with anti-leucine-rich glioma-inactivated 1 antibody encephalitis. Front Immunol 2021;12:672846 doi:10.3389/fimmu.2021.672846 pmid:34616389
    CrossRefPubMed
  32. 32.↵
    1. Chen W,
    2. Wang M,
    3. Gao L, et al
    . Neurofunctional outcomes in patients with anti-leucine-rich glioma inactivated 1 encephalitis. Acta Neurol Scand 2021;144:632–39 doi:10.1111/ane.13503 pmid:34314015
    CrossRefPubMed
  33. 33.↵
    1. Lin N,
    2. Liu Q,
    3. Chen J, et al
    . Long-term seizure outcomes in patients with anti-leucine-rich glioma-inactivated 1 encephalitis. Epilepsy Behav 2021;122:108159 doi:10.1016/j.yebeh.2021.108159 pmid:34229158
    CrossRefPubMed
  34. 34.↵
    1. Li TR,
    2. Zhang YD,
    3. Wang Q, et al
    . Clinical characteristics and long-term prognosis of anti-lgi1 encephalitis: a single-center cohort study in Beijing, China. Front Neurol 2021;12:674368 doi:10.3389/fneur.2021.674368 pmid:34168612
    CrossRefPubMed
  35. 35.↵
    1. Lardeux P,
    2. Fourier A,
    3. Peter E, et al
    . Core cerebrospinal fluid biomarker profile in anti-LGI1 encephalitis. J Neurol 2022;269:377–88 doi:10.1007/s00415-021-10642-2 pmid:34104991
    CrossRefPubMed
  36. 36.↵
    1. Muñiz-Castrillo S,
    2. Haesebaert J,
    3. Thomas L, et al
    . Clinical and prognostic value of immunogenetic characteristics in anti-LGI1 encephalitis. Neurol Neuroimmunol Neuroinflamm 2021;8:e974 doi:10.1212/NXI.0000000000000974 pmid:33848259
    Abstract/FREE Full Text
  37. 37.↵
    1. Zhao Q,
    2. Sun L,
    3. Zhao D, et al
    . Clinical features of anti-leucine-rich glioma-inactivated 1 encephalitis in northeast China. Clin Neurol Neurosurg 2021;203:106542 doi:10.1016/j.clineuro.2021.106542 pmid:33706063
    CrossRefPubMed
  38. 38.↵
    1. Shao X,
    2. Fan S,
    3. Luo H, et al
    . Brain magnetic resonance imaging characteristics of anti-leucine-rich glioma-inactivated 1 encephalitis and their clinical relevance: a single-center study in China. Front Neurol 2020;11:618109 doi:10.3389/fneur.2020.618109 pmid:33510707
    CrossRefPubMed
  39. 39.↵
    1. Liu X,
    2. Shan W,
    3. Zhao X, et al
    . The clinical value of 18F-FDG-PET in autoimmune encephalitis associated with LGI1 antibody. Front Neurol 2020;11:418 doi:10.3389/fneur.2020.00418 pmid:32581996
    CrossRefPubMed
  40. 40.↵
    1. Liu X,
    2. Han Y,
    3. Yang L, et al
    . The exploration of the spectrum of motor manifestations of anti-LGI1 encephalitis beyond FBDS. Seizure 2020;76:22–27 doi:10.1016/j.seizure.2019.12.023 pmid:31972532
    CrossRefPubMed
  41. 41.↵
    1. Jang Y,
    2. Lee ST,
    3. Bae JY, et al
    . LGI1 expression and human brain asymmetry: insights from patients with LGI1-antibody encephalitis. J Neuroinflammation 2018;15:279 doi:10.1186/s12974-018-1314-2 pmid:30253786
    CrossRefPubMed
  42. 42.
    1. Feyissa AM,
    2. Lamb C,
    3. Pittock SJ, et al
    . Antiepileptic drug therapy in autoimmune epilepsy associated with antibodies targeting the leucine-rich glioma-inactivated protein 1. Epilepsia Open 2018;3:348–56 doi:10.1002/epi4.12226 pmid:30187005
    CrossRefPubMed
  43. 43.↵
    1. Thompson J,
    2. Bi M,
    3. Murchison AG, et al
    ; Faciobrachial Dystonic Seizures Study Group. The importance of early immunotherapy in patients with faciobrachial dystonic seizures. Brain 2017;141:348–56 doi:10.1093/brain/awx323 pmid:29272336
    CrossRefPubMed
  44. 44.
    1. Celicanin M,
    2. Blaabjerg M,
    3. Maersk-Moller C, et al
    . Autoimmune encephalitis associated with voltage-gated potassium channels-complex and leucine-rich glioma-inactivated 1 antibodies: a national cohort study. Eur J Neurol 2017;24:999–1005 doi:10.1111/ene.13324 pmid:28544133
    CrossRefPubMed
  45. 45.↵
    1. Kim TJ,
    2. Lee ST,
    3. Moon J, et al
    . Anti-LGI1 encephalitis is associated with unique HLA subtypes. Ann Neurol 2017;81:183–92 doi:10.1002/ana.24860 pmid:28026029
    CrossRefPubMed
  46. 46.↵
    1. Finke C,
    2. Prüss H,
    3. Heine J, et al
    . Evaluation of cognitive deficits and structural hippocampal damage in encephalitis with leucine-rich, glioma-inactivated 1 antibodies. JAMA Neurol 2017;74:50–59 doi:10.1001/jamaneurol.2016.4226 pmid:27893017
    CrossRefPubMed
  47. 47.↵
    1. van Sonderen A,
    2. Thijs RD,
    3. Coenders EC, et al
    . Anti-LGI1 encephalitis: clinical syndrome and long-term follow-up. Neurology 2016;87:1449–56 doi:10.1212/WNL.0000000000003173 pmid:27590293
    CrossRefPubMed
  48. 48.↵
    1. Navarro V,
    2. Kas A,
    3. Apartis E, et al
    ; collaborators. Motor cortex and hippocampus are the two main cortical targets in LGI1-antibody encephalitis. Brain 2016;139:1079–93 doi:10.1093/brain/aww012 pmid:26945884
    CrossRefPubMed
  49. 49.↵
    1. Irani SR,
    2. Michell AW,
    3. Lang B, et al
    . Faciobrachial dystonic seizures precede LGI1 antibody limbic encephalitis. Ann Neurol 2011;69:892–900 doi:10.1002/ana.22307 pmid:21416487
    CrossRefPubMed
  50. 50.↵
    1. Gadoth A,
    2. Pittock SJ,
    3. Dubey D, et al
    . Expanded phenotypes and outcomes among 256 LGI1/CASPR2-IgG–positive patients. Ann Neurol 2017;82:79–92 doi:10.1002/ana.24979 pmid:28628235
    CrossRefPubMed
  51. 51.↵
    1. Cousyn L,
    2. Lambrecq V,
    3. Houot M, et al
    . Seizures in autoimmune encephalitis: specific features based on a systematic comparative study. Epileptic Disord 2021;23:879–92 doi:10.1684/epd.2021.1355 pmid:34704941
    CrossRefPubMed
  52. 52.
    1. Kambadja B,
    2. Marion H,
    3. Cousyn L, et al
    . When should we test patients with epilepsy for autoimmune antibodies? Results from a French retrospective single center study. J Neurol 2022;269:3109–3118 doi:10.1007/s00415-021-10894-y pmid:34816332
    CrossRefPubMed
  53. 53.
    1. Sola-Valls N,
    2. Ariño H,
    3. Escudero D, et al
    . Telemedicine assessment of long-term cognitive and functional status in anti-leucine-rich, glioma-inactivated 1 encephalitis. Neurol Neuroimmunol Neuroinflamm 2019;7:e652 doi:10.1212/NXI.0000000000000652 pmid:31848230
    Abstract/FREE Full Text
  54. 54.↵
    1. Huang X,
    2. Fan C,
    3. Gao L, et al
    . Clinical features, immunotherapy, and outcomes of anti-leucine-rich glioma-inactivated-1 encephalitis. J Neuropsychiatry Clin Neurosci 2022;34:141–48 doi:10.1176/appi.neuropsych.20120303 pmid:34794327
    CrossRefPubMed
  55. 55.↵
    1. Teng Y,
    2. Li T,
    3. Yang Z, et al
    . Clinical features and therapeutic effects of anti-leucine-rich glioma inactivated 1 encephalitis: a systematic review. Front Neurol 2021;12:791014 doi:10.3389/fneur.2021.791014 pmid:35095736
    CrossRefPubMed
  56. 56.↵
    1. Zhang T,
    2. Duan Y,
    3. Ye J, et al
    . Brain MRI characteristics of patients with anti-N-methyl-D-aspartate receptor encephalitis and their associations with 2-year clinical outcome. AJNR Am J Neuroradiol 2018;39:824–29 doi:10.3174/ajnr.A5593 pmid:29567651
    Abstract/FREE Full Text
  57. 57.↵
    1. Joubert B,
    2. Saint-Martin M,
    3. Noraz N, et al
    . Characterization of a subtype of autoimmune encephalitis with anti-contactin-associated protein-like 2 antibodies in the cerebrospinal fluid, prominent limbic symptoms, and seizures. JAMA Neurol 2016;73:1115–24 doi:10.1001/jamaneurol.2016.1585 pmid:27428927
    CrossRefPubMed
  58. 58.↵
    1. Moura J,
    2. Samões R,
    3. Cardoso M, et al
    . Distinct phenotypes in a cohort of anti-CASPR2 associated neurological syndromes. Clin Neurol Neurosurg 2023;234:107994 doi:10.1016/j.clineuro.2023.107994 pmid:37797365
    CrossRefPubMed
  59. 59.↵
    1. Zhu F,
    2. Shan W,
    3. Lv R, et al
    . Clinical characteristics of anti-GABA-B receptor encephalitis. Front Neurol 2020;11:403 doi:10.3389/fneur.2020.00403 pmid:32508739
    CrossRefPubMed
  60. 60.↵
    1. Höftberger R,
    2. Titulaer MJ,
    3. Sabater L, et al
    . Encephalitis and GABAB receptor antibodies: novel findings in a new case series of 20 patients. Neurology 2013;81:1500–06 doi:10.1212/WNL.0b013e3182a9585f pmid:24068784
    Abstract/FREE Full Text
  61. 61.↵
    1. Gresa-Arribas N,
    2. Planagumà J,
    3. Petit-Pedrol M, et al
    . Human neurexin-3α antibodies associate with encephalitis and alter synapse development. Neurology 2016;86:2235–42 doi:10.1212/WNL.0000000000002775 pmid:27170573
    CrossRefPubMed
  62. 62.↵
    1. Höftberger R,
    2. van Sonderen A,
    3. Leypoldt F, et al
    . Encephalitis and AMPA receptor antibodies: novel findings in a case series of 22 patients. Neurology 2015;84:2403–12 doi:10.1212/WNL.0000000000001682 pmid:25979696
    CrossRefPubMed
  63. 63.↵
    1. Joubert B,
    2. Kerschen P,
    3. Zekeridou A, et al
    . Clinical spectrum of encephalitis associated with antibodies against the α-amino-3-hydroxy-5-methyl-4-isoxazolepropionic acid receptor: case series and review of the literature. JAMA Neurol 2015;72:1163–69 doi:10.1001/jamaneurol.2015.1715 pmid:26280228
    CrossRefPubMed
  64. 64.↵
    1. Spatola M,
    2. Sabater L,
    3. Planagumà J, et al
    . Encephalitis with mGluR5 antibodies: symptoms and antibody effects. Neurology 2018;90:e1964–72 doi:10.1212/WNL.0000000000005614 pmid:29703767
    Abstract/FREE Full Text
  65. 65.↵
    1. Carvajal-González A,
    2. Leite MI,
    3. Waters P, et al
    . Glycine receptor antibodies in PERM and related syndromes: characteristics, clinical features and outcomes. Brain 2014;137:2178–92 doi:10.1093/brain/awu142 pmid:24951641
    CrossRefPubMed
  66. 66.↵
    1. Swayne A,
    2. Tjoa L,
    3. Broadley S, et al
    . Antiglycine receptor antibody related disease: a case series and literature review. Eur J Neurol 2018;25:1290–98 doi:10.1111/ene.13721 pmid:29904974
    CrossRefPubMed
  67. 67.↵
    1. Muñiz-Castrillo S,
    2. Hedou JJ,
    3. Ambati A, et al
    . Distinctive clinical presentation and pathogenic specificities of anti-AK5 encephalitis. Brain 2021;144:2709–21 doi:10.1093/brain/awab153 pmid:33843981
    CrossRefPubMed
  68. 68.↵
    1. Xiao J,
    2. Fu PC,
    3. Li ZJ
    . Clinical and imaging analysis to evaluate the response of patients with anti-DPPX encephalitis to immunotherapy. BMC Neurol 2022;22:129 doi:10.1186/s12883-022-02649-7 pmid:35382765
    CrossRefPubMed
  69. 69.↵
    1. Fredriksen JR,
    2. Carr CM,
    3. Koeller KK, et al
    . MRI findings in glutamic acid decarboxylase associated autoimmune epilepsy. Neuroradiology 2018;60:239–45 doi:10.1007/s00234-018-1976-6 pmid:29353399
    CrossRefPubMed
  70. 70.↵
    1. Sun Y,
    2. Qin X,
    3. Huang D, et al
    . Anti-amphiphysin encephalitis: expanding the clinical spectrum. Front Immunol 2023;14:1084883 doi:10.3389/fimmu.2023.1084883 pmid:37090693
    CrossRefPubMed
  71. 71.↵
    1. Dalmau J,
    2. Graus F,
    3. Villarejo A, et al
    . Clinical analysis of anti-Ma2-associated encephalitis. Brain 2004;127:1831–44 doi:10.1093/brain/awh203 pmid:15215214
    CrossRefPubMed
  72. 72.↵
    1. Quintas-Neves M,
    2. Teylan MA,
    3. Morais-Ribeiro R, et al
    . Divergent magnetic resonance imaging atrophy patterns in Alzheimer’s disease and primary age-related tauopathy. Neurobiol Aging 2022;117:1–11 doi:10.1016/j.neurobiolaging.2022.04.013 pmid:35640459
    CrossRefPubMed
  73. 73.↵
    1. Pinho J,
    2. Almeida FC,
    3. Araújo JM, et al
    . Sex-specific patterns of cerebral atrophy and enlarged perivascular spaces in patients with cerebral amyloid angiopathy and dementia. AJNR Am J Neuroradiol 2023;44:792–98 doi:10.3174/ajnr.A7900 pmid:37290817
    Abstract/FREE Full Text
  74. 74.↵
    1. Preiß D,
    2. Billette OV,
    3. Schneider A, et al
    . The atrophy pattern in Alzheimer-related PPA is more widespread than that of the frontotemporal lobar degeneration associated variants. NeuroImage Clin 2019;24:101994 doi:10.1016/j.nicl.2019.101994 pmid:31505368
    CrossRefPubMed
  75. 75.↵
    1. Nelson PT,
    2. Dickson DW,
    3. Trojanowski JQ, et al
    . Limbic-predominant age-related TDP-43 encephalopathy (LATE): consensus working group report. Brain 2019;142:1503–27 doi:10.1093/brain/awz099 pmid:31039256
    CrossRefPubMed
  76. 76.↵
    1. Eran A,
    2. Hodes A,
    3. Izbudak I
    . Bilateral temporal lobe disease: looking beyond herpes encephalitis. Insights Imaging 2016;7:265–74 doi:10.1007/s13244-016-0481-x pmid:26911968
    CrossRefPubMed
  77. 77.↵
    1. de Priester JA,
    2. Jansen GH,
    3. de Kruijk JR, et al
    . New MRI findings in Creutzfeldt-Jakob disease: high signal in the globus pallidus on T1-weighted images. Neuroradiology 1999;41:265–68 doi:10.1007/s002340050744 pmid:10344511
    CrossRefPubMed
  78. 78.↵
    1. de Oliveira AM,
    2. Paulino MV,
    3. Vieira AP, et al
    . Imaging patterns of toxic and metabolic brain disorders. Radiographics 2019;39:1672–95 doi:10.1148/rg.2019190016 pmid:31589567
    CrossRefPubMed
  79. 79.↵
    1. Fragoso DC,
    2. Gonçalves Filho AL,
    3. Pacheco FT, et al
    . Imaging of Creutzfeldt-Jakob disease: imaging patterns and their differential diagnosis. Radiographics 2017;37:234–57 doi:10.1148/rg.2017160075 pmid:28076012
    CrossRefPubMed
  80. 80.↵
    1. Vakrakou A,
    2. Constantinides VC,
    3. Velonakis G, et al
    . Paraneoplastic basal ganglia encephalitis associated with anti-CV2/CRMP-5 and anti-Yo antibodies in a patient with non-small-cell lung cancer. Neurol Sci 2020;41:2649–51 doi:10.1007/s10072-020-04399-1 pmid:32307664
    CrossRefPubMed
  81. 81.↵
    1. Hegde AN,
    2. Mohan S,
    3. Lath N, et al
    . Differential diagnosis for bilateral abnormalities of the basal ganglia and thalamus. Radiographics 2011;31:5–30 doi:10.1148/rg.311105041 pmid:21257930
    CrossRefPubMed
  82. 82.↵
    1. Miller TD,
    2. Chong TT,
    3. Aimola Davies AM, et al
    . Focal CA3 hippocampal subfield atrophy following LGI1 VGKC-complex antibody limbic encephalitis. Brain 2017;140:1212–19 doi:10.1093/brain/awx070 pmid:28369215
    CrossRefPubMed
  83. 83.↵
    1. Petit-Pedrol M,
    2. Sell J,
    3. Planagumà J, et al
    . LGI1 antibodies alter Kv1.1 and AMPA receptors changing synaptic excitability, plasticity and memory. Brain 2018;141:3144–59 doi:10.1093/brain/awy253 pmid:30346486
    CrossRefPubMed
  84. 84.↵
    1. Ramberger M,
    2. Berretta A,
    3. Tan JM, et al
    . Distinctive binding properties of human monoclonal LGI1 autoantibodies determine pathogenic mechanisms. Brain 2020;143:1731–45 doi:10.1093/brain/awaa104 pmid:32437528
    CrossRefPubMed
  85. 85.↵
    1. Kornau HC,
    2. Kreye J,
    3. Stumpf A, et al
    . Human cerebrospinal fluid monoclonal lgi1 autoantibodies increase neuronal excitability. Ann Neurol 2020;87:405–18 doi:10.1002/ana.25666 pmid:31900946
    CrossRefPubMed
  86. 86.↵
    1. Sadaghiani MS,
    2. Roman S,
    3. Diaz-Arias LA, et al
    . Comparison of quantitative FDG-PET and MRI in anti-LGI1 autoimmune encephalitis. Neuroradiology 2023;65:1225–38 doi:10.1007/s00234-023-03165-2 pmid:37264220
    CrossRefPubMed
  • Received November 14, 2023.
  • Accepted after revision February 14, 2024.
  • © 2024 by American Journal of Neuroradiology
PreviousNext
Back to top

In this issue

American Journal of Neuroradiology: 45 (7)
American Journal of Neuroradiology
Vol. 45, Issue 7
1 Jul 2024
  • Table of Contents
  • Index by author
  • Complete Issue (PDF)
Advertisement
Print
Download PDF
Email Article

Thank you for your interest in spreading the word on American Journal of Neuroradiology.

NOTE: We only request your email address so that the person you are recommending the page to knows that you wanted them to see it, and that it is not junk mail. We do not capture any email address.

Enter multiple addresses on separate lines or separate them with commas.
MR Imaging Findings in Anti-Leucine-Rich Glioma Inactivated Protein 1 Encephalitis: A Systematic Review and Meta-analysis
(Your Name) has sent you a message from American Journal of Neuroradiology
(Your Name) thought you would like to see the American Journal of Neuroradiology web site.
CAPTCHA
This question is for testing whether or not you are a human visitor and to prevent automated spam submissions.
Cite this article
Francisco C. Almeida, Ana I. Pereira, Catarina Mendes-Pinto, Joana Lopes, João Moura, José Maria Sousa, Gonçalo Videira, Raquel Samões, Tiago Gil Oliveira
MR Imaging Findings in Anti-Leucine-Rich Glioma Inactivated Protein 1 Encephalitis: A Systematic Review and Meta-analysis
American Journal of Neuroradiology Jul 2024, 45 (7) 977-986; DOI: 10.3174/ajnr.A8256

Citation Manager Formats

  • BibTeX
  • Bookends
  • EasyBib
  • EndNote (tagged)
  • EndNote 8 (xml)
  • Medlars
  • Mendeley
  • Papers
  • RefWorks Tagged
  • Ref Manager
  • RIS
  • Zotero
0 Responses
Respond to this article
Share
Bookmark this article
MR Imaging in Anti-LGI1 Encephalitis: Review
Francisco C. Almeida, Ana I. Pereira, Catarina Mendes-Pinto, Joana Lopes, João Moura, José Maria Sousa, Gonçalo Videira, Raquel Samões, Tiago Gil Oliveira
American Journal of Neuroradiology Jul 2024, 45 (7) 977-986; DOI: 10.3174/ajnr.A8256
del.icio.us logo Twitter logo Facebook logo Mendeley logo
  • Tweet Widget
  • Facebook Like
  • Google Plus One
Purchase

Jump to section

  • Article
    • Abstract
    • ABBREVIATIONS:
    • MATERIALS AND METHODS
    • RESULTS
    • DISCUSSION
    • CONCLUSIONS
    • Acknowledgments
    • Footnotes
    • References
  • Figures & Data
  • Supplemental
  • Info & Metrics
  • Responses
  • References
  • PDF

Related Articles

  • PubMed
  • Google Scholar

Cited By...

  • No citing articles found.
  • Crossref
  • Google Scholar

This article has not yet been cited by articles in journals that are participating in Crossref Cited-by Linking.

More in this TOC Section

  • Automated Lesion Segmentation Software in MS
  • DL Image Reconstruction in T2-Weighted TSE at 7T
  • 7T MRI vasculitis imaging
Show more Ultra-High-Field MRI/Imaging of Epilepsy/Demyelinating Diseases/Inflammation/Infection

Similar Articles

Advertisement

Indexed Content

  • Current Issue
  • Accepted Manuscripts
  • Article Preview
  • Past Issues
  • Editorials
  • Editor's Choice
  • Fellows' Journal Club
  • Letters to the Editor
  • Video Articles

Cases

  • Case Collection
  • Archive - Case of the Week
  • Archive - Case of the Month
  • Archive - Classic Case

More from AJNR

  • Trainee Corner
  • Imaging Protocols
  • MRI Safety Corner
  • Book Reviews

Multimedia

  • AJNR Podcasts
  • AJNR Scantastics

Resources

  • Turnaround Time
  • Submit a Manuscript
  • Submit a Video Article
  • Submit an eLetter to the Editor/Response
  • Manuscript Submission Guidelines
  • Statistical Tips
  • Fast Publishing of Accepted Manuscripts
  • Graphical Abstract Preparation
  • Imaging Protocol Submission
  • Evidence-Based Medicine Level Guide
  • Publishing Checklists
  • Author Policies
  • Become a Reviewer/Academy of Reviewers
  • News and Updates

About Us

  • About AJNR
  • Editorial Board
  • Editorial Board Alumni
  • Alerts
  • Permissions
  • Not an AJNR Subscriber? Join Now
  • Advertise with Us
  • Librarian Resources
  • Feedback
  • Terms and Conditions
  • AJNR Editorial Board Alumni

American Society of Neuroradiology

  • Not an ASNR Member? Join Now

© 2025 by the American Society of Neuroradiology All rights, including for text and data mining, AI training, and similar technologies, are reserved.
Print ISSN: 0195-6108 Online ISSN: 1936-959X

Powered by HighWire