
Article Figures & Data
Figures
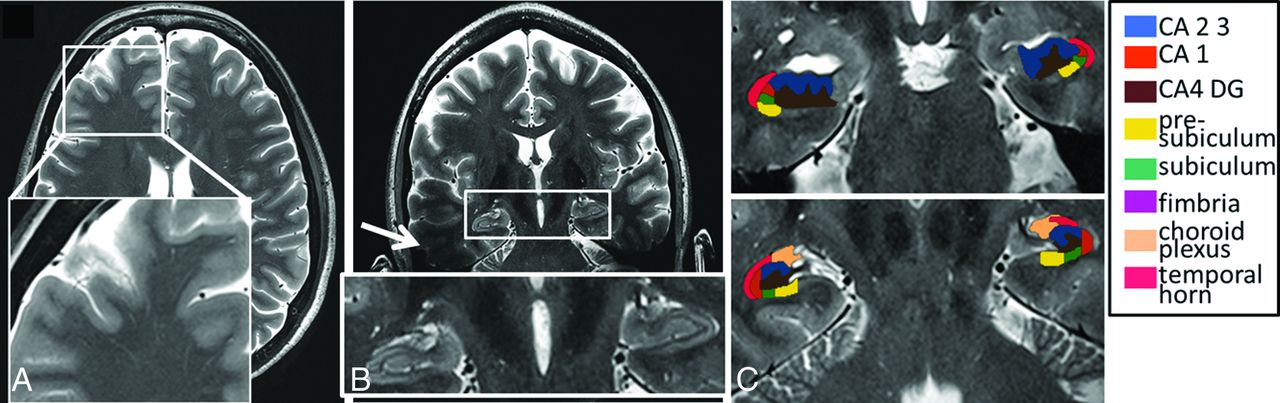
- Fig 1.
High-resolution axial (A) and coronal oblique (B) images of the brain obtained at 7T. The 450-μm in-plane resolution enables visualization of the hippocampus in fine detail. C, Effective hippocampal subfield segmentation may be performed on a 7T TSE image. Subfields were manually traced courtesy of Dr Jason Bini on high-resolution coronal TSE images on OsiriX Image Viewing Software (http://www.osirix-viewer.com) by using the segmentation work by Van Leemput et al102 as a guide. Scanner: whole-body 7T MR imaging (Magnetom; Siemens). RF coil: Nova 32-channel head coil (Nova Medical, Wilmington, Massachusetts). Scan parameters: number of sections = 25, section thickness = 2 mm, FOV = 23 cm, grid size = 512 × 512, resolution = 0.44 × 0.44 × 2 mm3, scanning time = 6 minutes and 30 seconds.
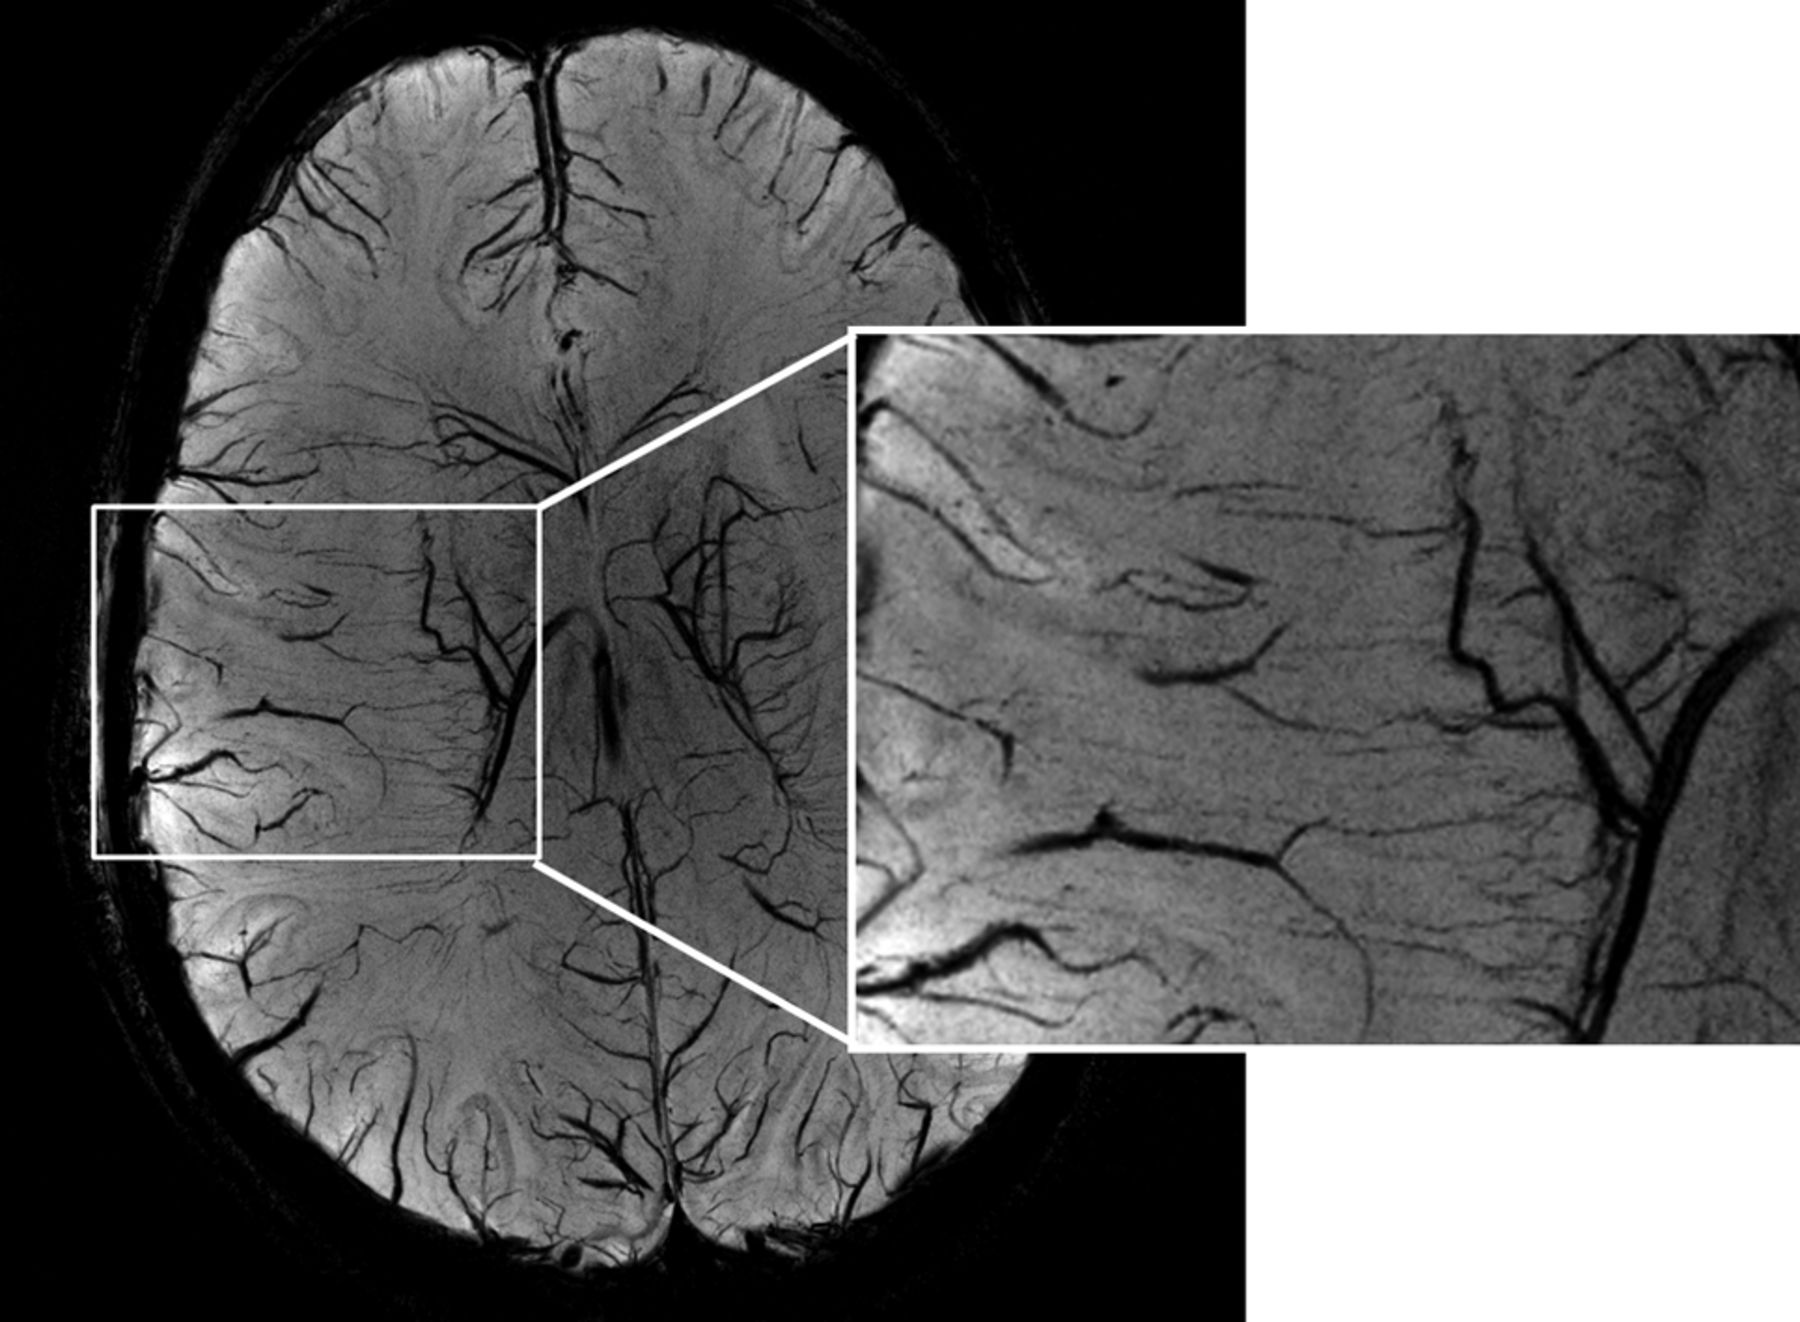
- Fig 2.
MIP of a 7T susceptibility-weighted image of the brain of a healthy volunteer revealing tiny venules in the cortex. Scanner: whole-body 7T MR imaging (Magnetom; Siemens). RF coil: Nova 32-channel head coil. Scan parameters: resolution = 0.2 × 0.2 × 1.5 mm3, MIP thickness = 12 mm over the set of sections, scanning time = 6 minutes and 2 seconds.
- Fig 3.
Time-of-flight angiography performed on a healthy volunteer at 7T. Axial and sagittal MIP of TOF images are shown. Scanner: whole-body 7T MR imaging (Magnetom; Siemens). RF coil: Nova 32-channel head coil. Scan parameters: resolution = 0.26 × 0.26 × 0.4 mm3, scan time = 7 minutes and 56 seconds.
- Fig 4.
In vivo brain spectra acquired on a healthy volunteer by using a CT-PRESS sequence at 7T. Spectrum is courtesy of Drs Dirk Mayer and Daniel Spielman, Stanford University, Stanford, California. Plotted below the in vivo data are simulated spectra of individual metabolites, as generated by the CT-PRESS acquisitions.103 Metabolites shown are: phosphocreatine (PCr), creatine (Cr), myo-inositol (mI), scyllo-inositol (sI), N-acetylaspartate (NAA), N-acetyl aspartylglutamate (NAAG), alanine (Ala), aspartate (Asp), glutamate (Glu), glutamine (Gln), Choline (Cho), gamma-aminobutyric acid (GABA), glutathione (GSH), phosphoethanolamine (PE), glucose (Glc), taurine (Tau). Scanner: 7T whole-body scanner (MR950; GE Healthcare, Milwaukee, Wisconsin). RF coil: Nova head coil. Scan parameters: resolution = 2 × 2 × 2 cm3; voxel centrally located in the supertentorial brain, scanning time = 5 minutes.
- Fig 5.
Tractography performed by using diffusion imaging at 7T with readout-segmented EPI and parallel imaging. Image courtesy of Dr Robin Heidemann, Max Planck Institute for Human Cognitive and Brain Sciences, Leipzig, Germany. Scanner: whole-body 7T MR imaging (Magnetom; Siemens). RF coil: Nova 24-channel head coil. Scan parameters: b-value of 1000 s/mm2, resolution = 1 × 1 × 1 mm3, 30 diffusion directions, generalized autocalibrating partially parallel acquisition acceleration factor = 3, TE/TR = 60/11,000 ms, scanning time = 75 minutes.
- Fig 6.
Sodium brain image of a healthy volunteer obtained at 7T using a 3D attenuation-adapted projection reconstruction. Images courtesy of Dr Armin Nagel, the German Cancer Research Center, Heidelberg, Germany. Scanner: whole-body 7T MR imaging (Magnetom; Siemens). RF coil: double-resonant (1H = 297.2 MHz; 23Na = 78.6 MHz) quadrature birdcage coil (Rapid Biomed, Rimpar, Germany). Scan parameters: resolution = 2 × 2 × 2 mm3, scanning time = 20 minutes.
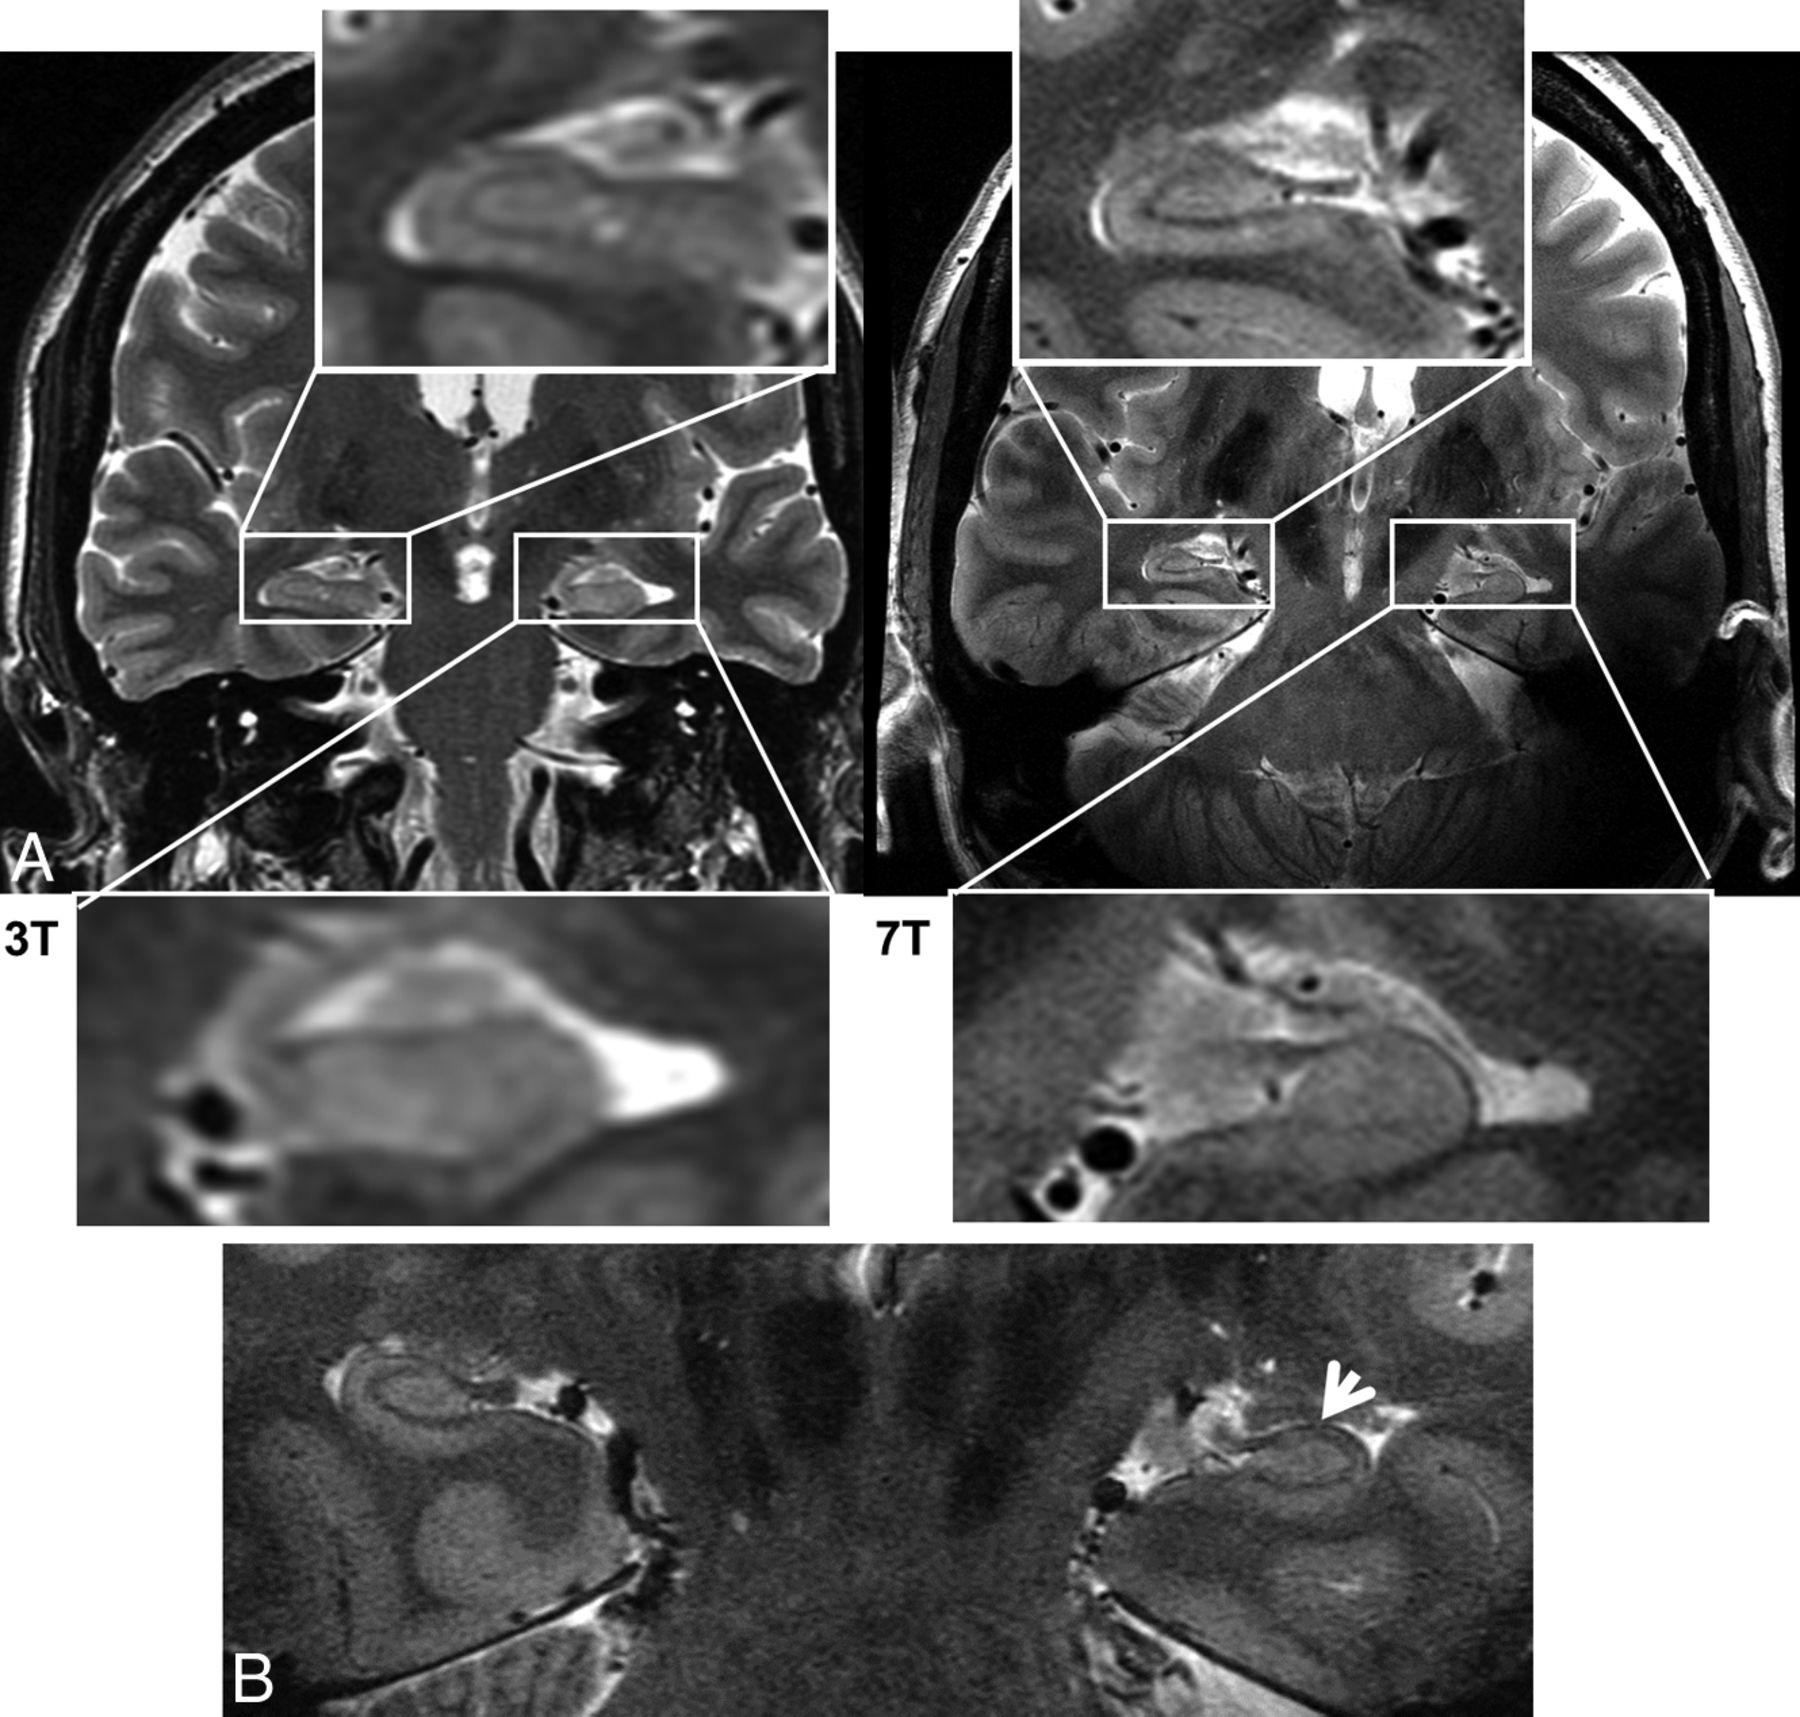
- Fig 7.
A, 3T and 7T coronal FSE images obtained for a patient with mesial temporal lobe epilepsy. Subtle left hippocampal abnormalities are visualized in greater detail in the 7T image. B, In a second patient with mesial temporal lobe epilepsy, loss of gray matter in the left hippocampus is detected at 7T (white arrow), after no abnormalities were reported at 3T. Images are courtesy of Drs Michael Zeineh, Manoj Saranathan, and Brian Rutt, Stanford University, Stanford, California. Scanners: whole-body 3T and 7T MR imaging (MR950; GE Healthcare). RF coils: standard 3T head coil (GE Healthcare) and Nova 7T head coil. Scan parameters: section thickness = 2 mm, resolution = 0.22 × 0.22 × 2 mm3, scanning time = 10 minutes.
- Fig 8.
A–C, Images of total sodium content for a patient with a glioblastoma of the mesial frontal lobe. Total sodium signal is elevated in tumor tissue. D–F, Images of relaxation-weighted sodium signal of the same patient. This provides sodium levels from a different tissue compartment and is only elevated in the central portion of the tumor. Images are courtesy of Drs Armin Nagel and Armin Biller, German Cancer Research Center, Heidelberg, Germany. Scanner: whole-body 7T MR imaging (Magnetom; Siemens). RF coil: rapid double-resonant (1H = 297.2 MHz; 23Na = 78.6 MHz) quadrature birdcage coil. Scan parameters: resolution = 2.5 × 2.5 × 2.5 mm3, scanning time = 13 minutes (A–C); resolution = 5.5 × 5.5 × 5.5 mm3, scanning time = 10 minutes (D–F).
- Fig 9.
A, High-resolution TSE image of a left temporal glioblastoma. B, 7T SWI provides improved depiction of intratumoral vessels and hemorrhages (white arrow) compared with SWI at 3T (C). Images are provided by Dr Alexander Radbruch, Heidelberg University Hospital and German Cancer Research Center, Heidelberg, Germany. Scanner: whole-body 7T MR imaging (Magnetom; Siemens). RF coil: Nova 32-channel head coil. Scan parameters: resolution = 0.3 × 0.3 × 2 mm3, scanning time = 4 minutes and 13 seconds (A); resolution = 0.7 × 0.7 × 2.5 mm3, scanning time = 3 minutes and 18 seconds (B); resolution = 0.4 × 0.4 × 0.4 mm3, scanning time = 6 minutes and 17 seconds (C).
- Fig 10.
7T SWI of a patient with MS. MS plaques (white and yellow arrows) and tiny veins within MS plaques (yellow arrows) become visible with the high resolution and enhanced contrast afforded by the 7T scanner. Images courtesy of Professor Siegfried Trattnig and Dr Günther Grabner, Medical University of Vienna, Vienna, Austria. Scanner: whole-body 7T MR imaging (Magnetom; Siemens). RF coil: Nova 32-channel head coil. Scan parameters: SWI sequence: resolution = 0.3 × 0.3 × 1.2 mm3, scanning time = 10 minutes.
- Fig 11.
Left hippocampus imaged at 7T across aged-matched patient populations. Healthy control (A), amnestic mild cognitive impairment (B), and probable Alzheimer disease (C). Images courtesy of Drs Jeffrey Bernstein, Brian Rutt, and Geoffrey Kerchner, Stanford University, Stanford, California. Scanner: whole-body 7T MR imaging (MR950; GE Healthcare). RF coil: Nova 32-channel head coil. Scan parameters: FSE sequence: section orientation = coronal oblique intersecting perpendicular to longitudinal axis of hippocampus, TE/TR = 49/6000 ms, 16 sections, section thickness = 1.5 mm, resolution = 0.22 × 0.22 × 1.5 mm3, scanning time = 13 minutes.
- Fig 12.
Differences between the transmitted B1 fields and the specific absorption rates at 3T and 7T. A, Model of a human head placed in a simple quadrature-driven birdcage head coil. B and C, Simulated transmitted B1 field (B1+) for 3T (B) and 7T (C). At 7T, wave-propagation effects cause more severe variation of the B1 field than is seen at 3T. D and E, Simulated SAR in the head model for 3T and 7T (in Watts per kilogram). SAR simulations show increased RF power deposition and greater spatial heterogeneity at 7T than at 3T. At 7T, one must contend with 2 physical limitations, the greater inhomogeneity in the transmit B1 field and the increased SAR deposition. These simulations were performed by Dr Bei Zhang at the Icahn School of Medicine, Mount Sinai, New York. A commercial finite-difference time domain software, CST Microwave Studio (Computer Simulation Technology, Darmstadt, Germany), was used to simulate electric and magnetic fields within the head for “Donna” in the Computer Simulation Technology virtual family. The B1 map was obtained by using 1W for the input power. The resolution of Donna is 1.875 × 1.875 × 2 mm3.


Tables
Relationship of imaging parameters and main magnetic field strength
Imaging Property Relationship with Main Magnetic Field Strength Observed Trend in Practice SNR SNR α B0 SNR increases linearly with B0; however, a linear increase may not be achievable in the presence of inhomogeneity and changing tissue relaxation4,5 Resolution Resolution α n0.33
When B0 is increased by a factor of nIn practice, further increases in resolution may be achieved because of improvements in detector and gradient design and enhanced contrast-to-noise ratio for some types of imaging sequences acting in conjunction with increased field strength T1 (in sec) T1 = 1/(0.35 + 0.64 × B0−0.7) This is a heuristic approximation (in SI units) for cortical gray matter4; generally T1 values for different tissues lengthen and converge with field strength T2* (in sec) T2* = 1/(7 + 3.5 × B0) This is a heuristic approximation (in SI units) for cortical gray matter4,97,98 Apparent T2 Decrease with B0 Theoretically, field strength has little effect on the spin-spin relaxation governing intrinsic T299; however, due to effects such as spins diffusing through susceptibility microgradients, apparent T2 shortens for some spin-echo sequences98,100,101 Sensitivity to susceptibility Δϕ α B0 × TE In practice, higher B0 enables the use of shorter TEs to maintain the same phase effect; coupled with higher SNR, this results in improved resolution and speed Spectral resolution in MRSI ΔF α B0 Although the separation of spectral peaks increases with field strength, increased B0 inhomogeneity within a voxel will cause broadening of peaks, counteracting this benefit; better shimming and smaller voxel volumes are required to prevent peak broadening CSL error CSL α B0 × section thickness/(RF bandwidth) In MRSI, this results in substantial shifts in selected volumes for metabolites resonating at different frequencies; high bandwidth RF pulses, such as adiabatic pulses can mitigate CSL error Note:—Δϕ indicates the phase difference between 2 tissues; ΔF, frequency separation between metabolite peaks; CSL, chemical shift localization; SI, International System of Units.


Jump to section
Related Articles
Cited By...
- High-Field 7T MRI in a drug-resistant paediatric epilepsy cohort: image comparison and radiological outcomes
- MULTIMODAL GRADIENTS UNIFY LOCAL AND GLOBAL CORTICAL ORGANIZATION
- Phenotyping Superagers Using Resting-State fMRI
- Application of 7T MRS to High-Grade Gliomas
- Cortical Depth-Dependent Modeling of Visual Hemodynamic Responses
- Emerging Use of Ultra-High-Field 7T MRI in the Study of Intracranial Vascularity: State of the Field and Future Directions
- Ultra-high field MRI reveals mood-related circuit disturbances in depression: A comparison between 3-Tesla and 7-Tesla
- Investigating resting-state functional connectivity in the cervical spinal cord at 3T
- 7T MRI for neurodegenerative dementias in vivo: a systematic review of the literature