
Article Figures & Data
Figures
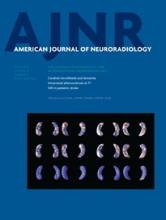
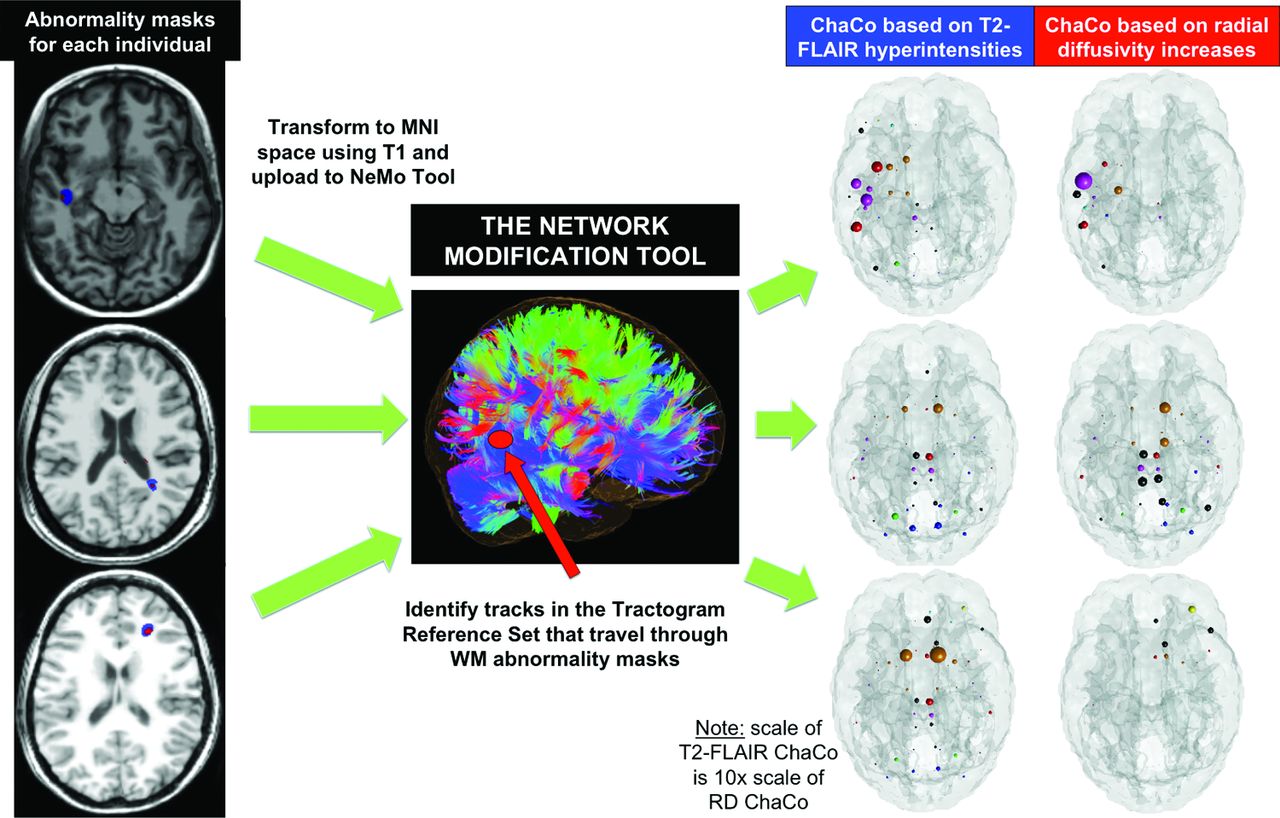
- Fig 1.
The workflow for the NeMo Tool and some examples. T2 FLAIR lesion (blue) and RD abnormality masks (red) were created and normalized to Montreal Neurological Institute space (left). The NeMo Tool was used to calculate the Change in Connectivity score that quantifies the effect of those areas of abnormality on regional structural connectivity (middle). ChaCo scores are shown for the T2 FLAIR lesions and RD abnormality masks for 3 particular individuals via the glass brain display (right). Each region in the atlas is represented by a sphere at its center whose color denotes functional membership (blue indicates visual; magenta, somatomotor; green, dorsal attention; red, ventral attention; cyan, limbic; yellow, frontoparietal; black, default mode; orange, cerebellar/subcortical) and whose size indicates the amount of connectivity abnormalities (larger indicates more connectivity abnormalities). Note that the T2 FLAIR WM lesion-based ChaCo spheres are at a scale that is 10 times that of the RD-based ChaCo spheres for visibility.
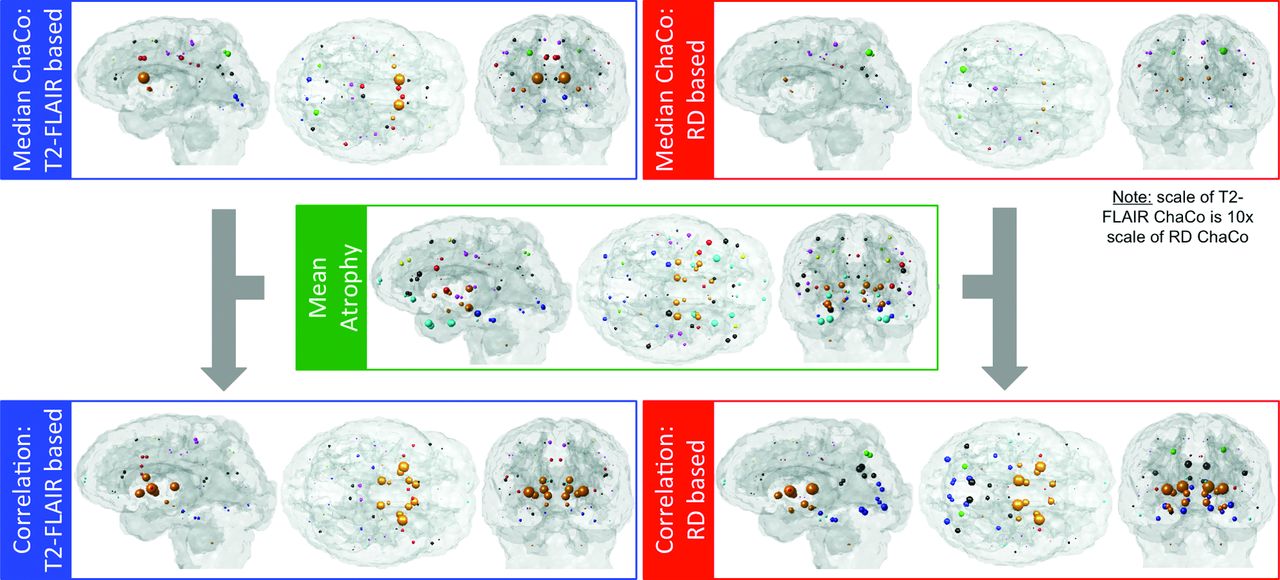
- Fig 2.
Median ChaCo for the 2 abnormality masks (T2 FLAIR lesions and RD abnormalities), mean atrophy, and corresponding correlation over 121 patients with MS. Each sphere indicates the center of a given gray matter region, while the color denotes functional network membership (blue indicates visual; magenta, somatomotor; green, dorsal attention; red, ventral attention; cyan, limbic; yellow, frontoparietal; black, default mode; orange, cerebellar/subcortical). Larger spheres indicate more connectivity abnormalities, more atrophy, or higher correlation, respectively. Note that the T2 FLAIR WM lesion-based ChaCo spheres are at a scale that is 10 times that of the RD-based ChaCo spheres for visibility.
- Fig 3.
Partial least-squares regression results. A, The predicted versus actual normalized SDMT scores for the 2 models (T2 FLAIR lesion-based ChaCo and RD abnormality–based ChaCo), along with the R2 value in the legend. The red line represents perfect prediction (x = y). B, Glass brain displays show regression coefficients for the ChaCo scores (top row) and atrophy (bottom row) of each gray matter region for the T2 FLAIR–based PLSR model. Sphere color denotes that the regression coefficient was the following: 1) nonzero and positive (blue), 2) nonzero and negative (red), or 3) not significantly different from zero (black). Sphere size is proportional to the mean of the bootstrapped sample of the regression coefficient. C, Same plot as in B, but for the RD abnormality–based PLSR model.


Tables
Demographics (mean ± standard deviation) for the early MS cohort and the healthy control group
All Subjects with MS Subgroup of Subjects with MS with SDMT Healthy Controls Total No. 121 66 15 Female 77 44 9 Age (yr) 37.5 ± 9.8 36.5 ± 9.3 36.3 ± 13.2 Disease duration 2.1 ± 1.5 1.6 ± 1.5 NA SDMT N/A 49.8 ± 10.5 NA EDSS 1.2 ± 1.4 1.04 ± 1.06 NA Note:—EDSS indicates Expanded Disability Status Scale; NA, not applicable.


Jump to section
Related Articles
Cited By...
- The sequence of regional structural disconnectivity due to multiple sclerosis lesions
- Validating atlas-based lesion disconnectomics in multiple sclerosis: a retrospective multi-centric study
- Estimated connectivity networks outperform observed connectivity networks when classifying people with multiple sclerosis into disability groups
- Structural and functional connectomes in people with multiple sclerosis
- Structural disconnectivity from quantitative susceptibility mapping rim+ lesions is related to disability in people with multiple sclerosis
- Impact of Focal White Matter Damage on Localized Subcortical Gray Matter Atrophy in Multiple Sclerosis: A 5-Year Study