
Article Figures & Data
Figures
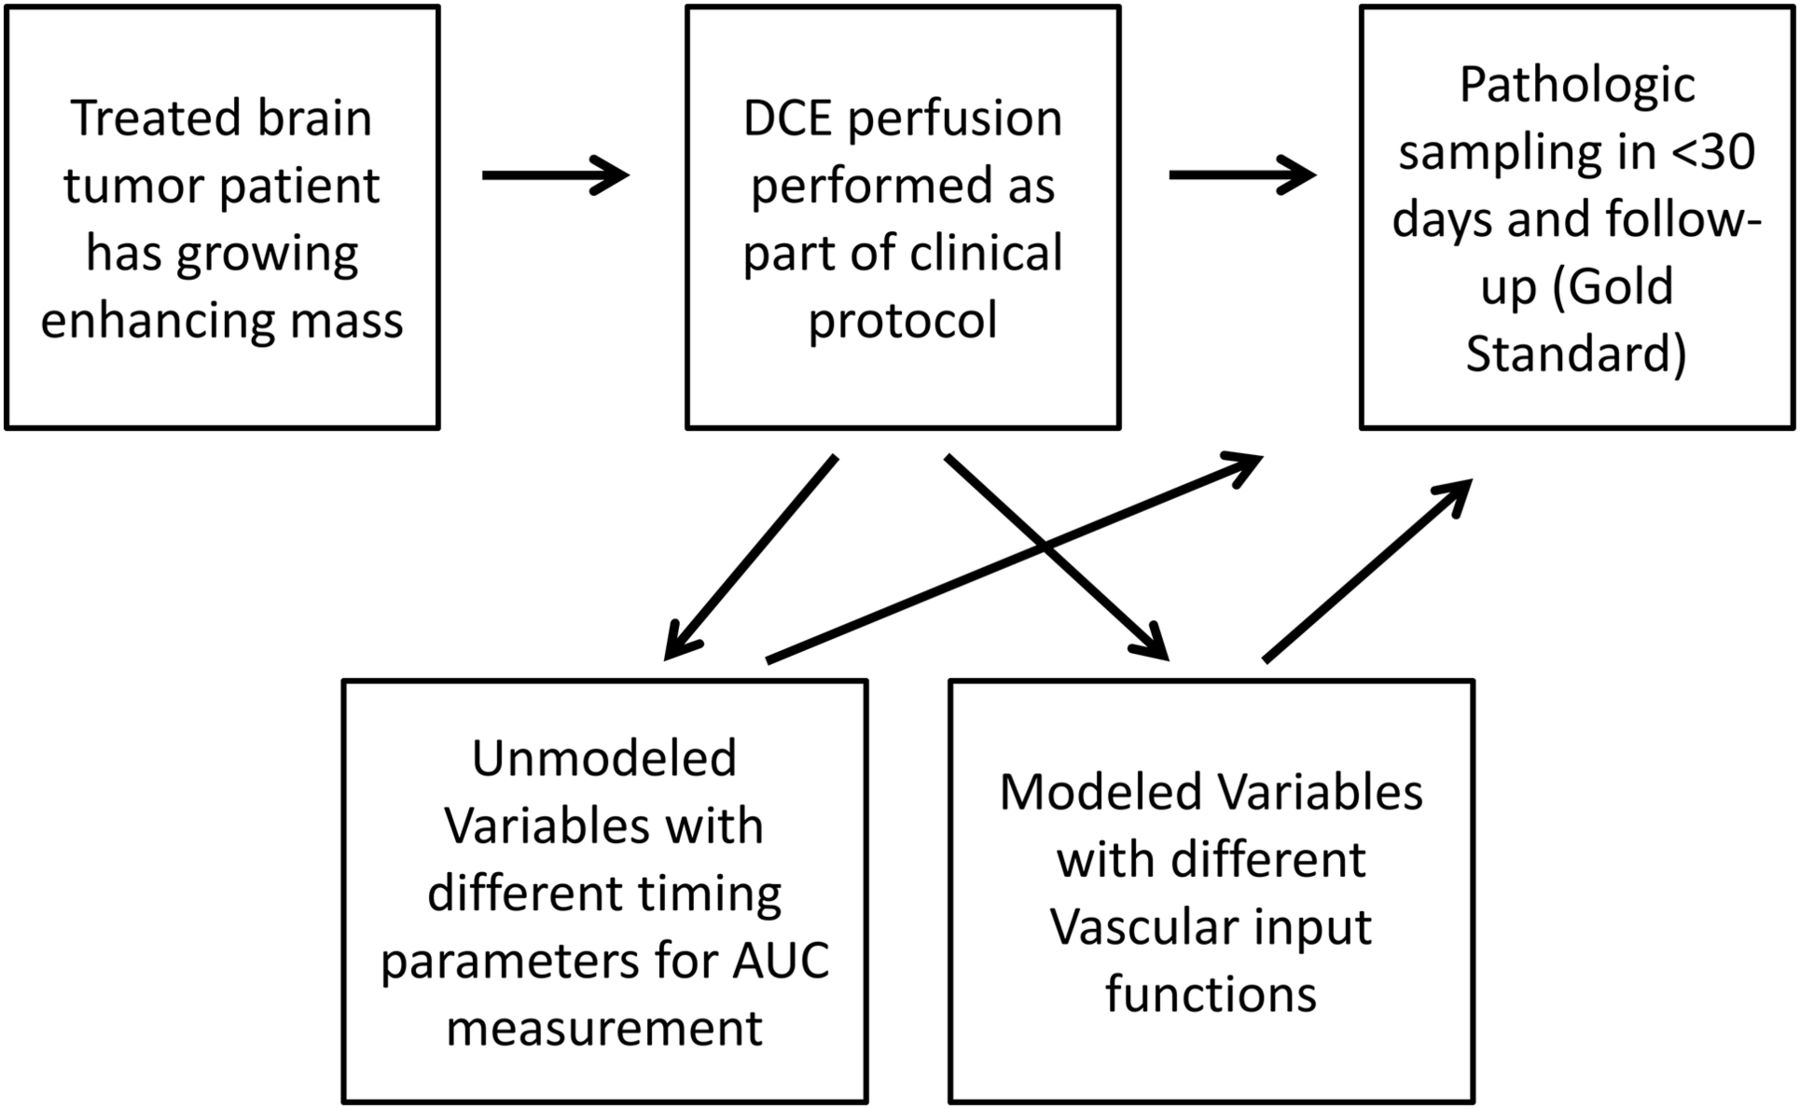
- Fig 1.
Overview diagram of the basic study design. This study tests the accuracy of DCE parameters in determining delayed radiation necrosis from recurrent glioma. Unmodeled parameters with varying times for the integration of DCE area under the curves and modeled parameters with varying locations/techniques for the vascular input function are tested. These are compared with the criterion standard of pathologic scoring and clinical follow-up.
- Fig 2.
Example of a change in modeled values related to the location of the vascular input function. Note a left parietal ring-enhancing lesion on axial postcontrast T1 imaging (A) and DCE (B), which on subsequent pathology was recurrent glioblastoma with some superimposed treatment effects (pathology score of 2). A region of interest was drawn to cover the enhancing regions with sparing of the centrally necrotic portion. C, The pixels chosen by nordicICE for a region of interest in the superior sagittal sinus. D, The pixels chosen for the M1 and proximal M2 branches of the ipsilateral middle cerebral artery. By changing from SSS to MCA, the mean/maximum Ktrans changed from 0.0165/0.169 to 0.283/3.003 in relative units, a 20× difference. The mean/maximum plasma volume changed from 0.652/4.94 to 5.49/34.87, a nearly 10× difference.
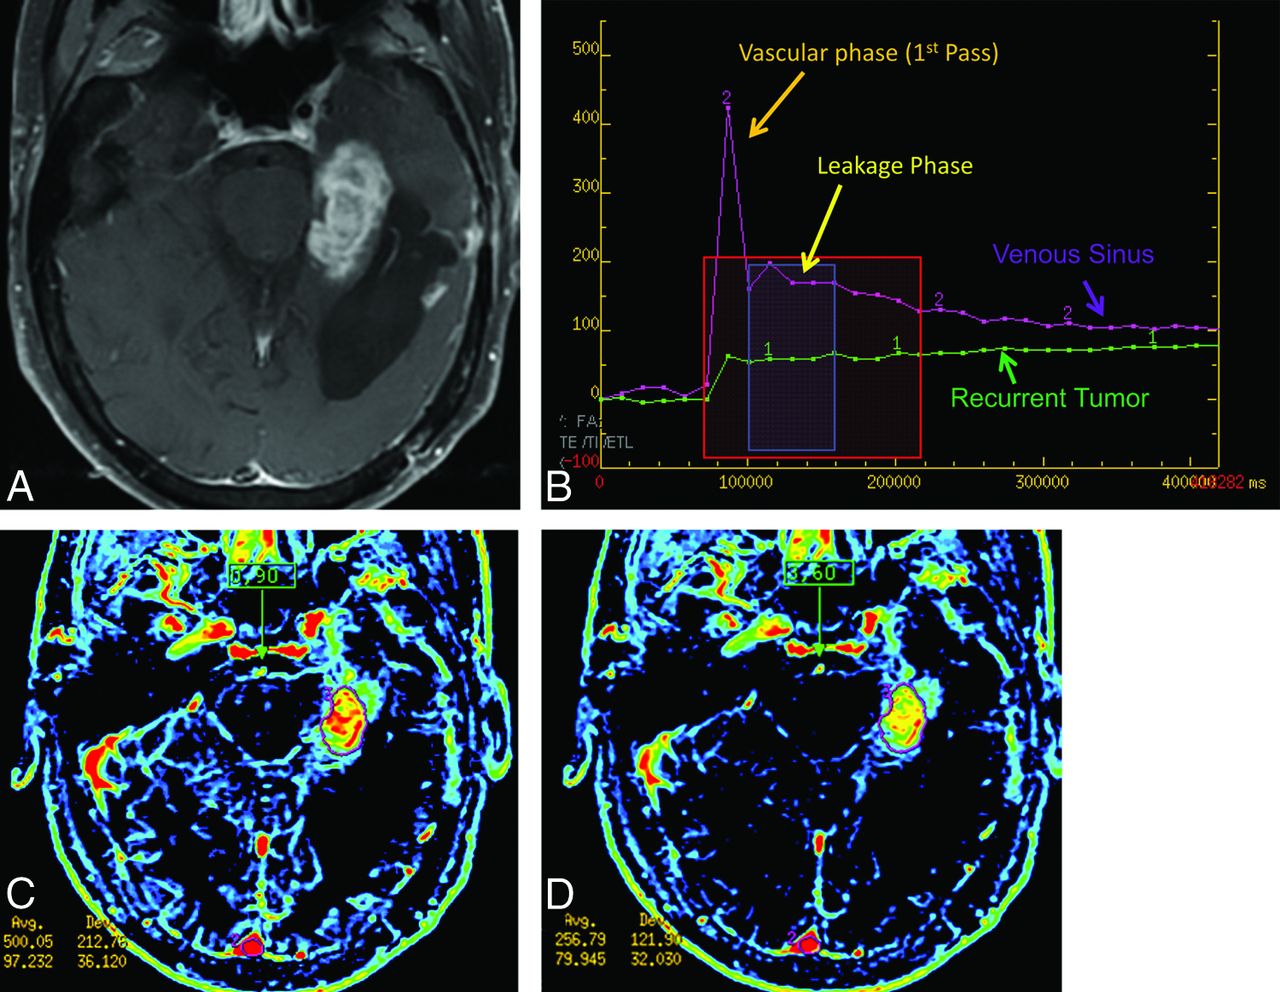
- Fig 3.
Example of recurrent glioblastoma by using 2 different AUC measurements. A, An enhancing lesion on T1WI involving the left parahippocampal region, which proved to be recurrent glioblastoma. B, A signal change over the time curve from the Advantage Workstation (GE Healthcare). The pink curve (voxel 2) is derived from the superior sagittal sinus (more inferior than normal positioning for illustration purposes) and demonstrates an initial vascular phase with the first pass of contrast washing in and then out. The green curve (voxel 1) demonstrates the signal change of a recurrent glioblastoma showing the initial rise of signal during the vascular phase followed by a slow rise during accumulated contrast escape or leakage of the contrast agent from the vessel. The red box demonstrates the time of integration for the “intermediate AUC” whose corresponding image is C, labeled “0.90.” The blue box demonstrates the time of integration showing the values for the “delayed short AUC” over approximately 45 seconds, labeled “3.60.” Notice in the corresponding image (D) that the cortical vessels are less well-seen than in C but the tumor remains (scaling is the same). Numerically, the vascular input decreases 49% (from an area under the curve of 500 to 257 relative units), while the tumor only decreases signal by 18% (97 to 80). Intermediate and delayed short AUC values from these data are 19% (97/500) and 31% (80/257), respectively.
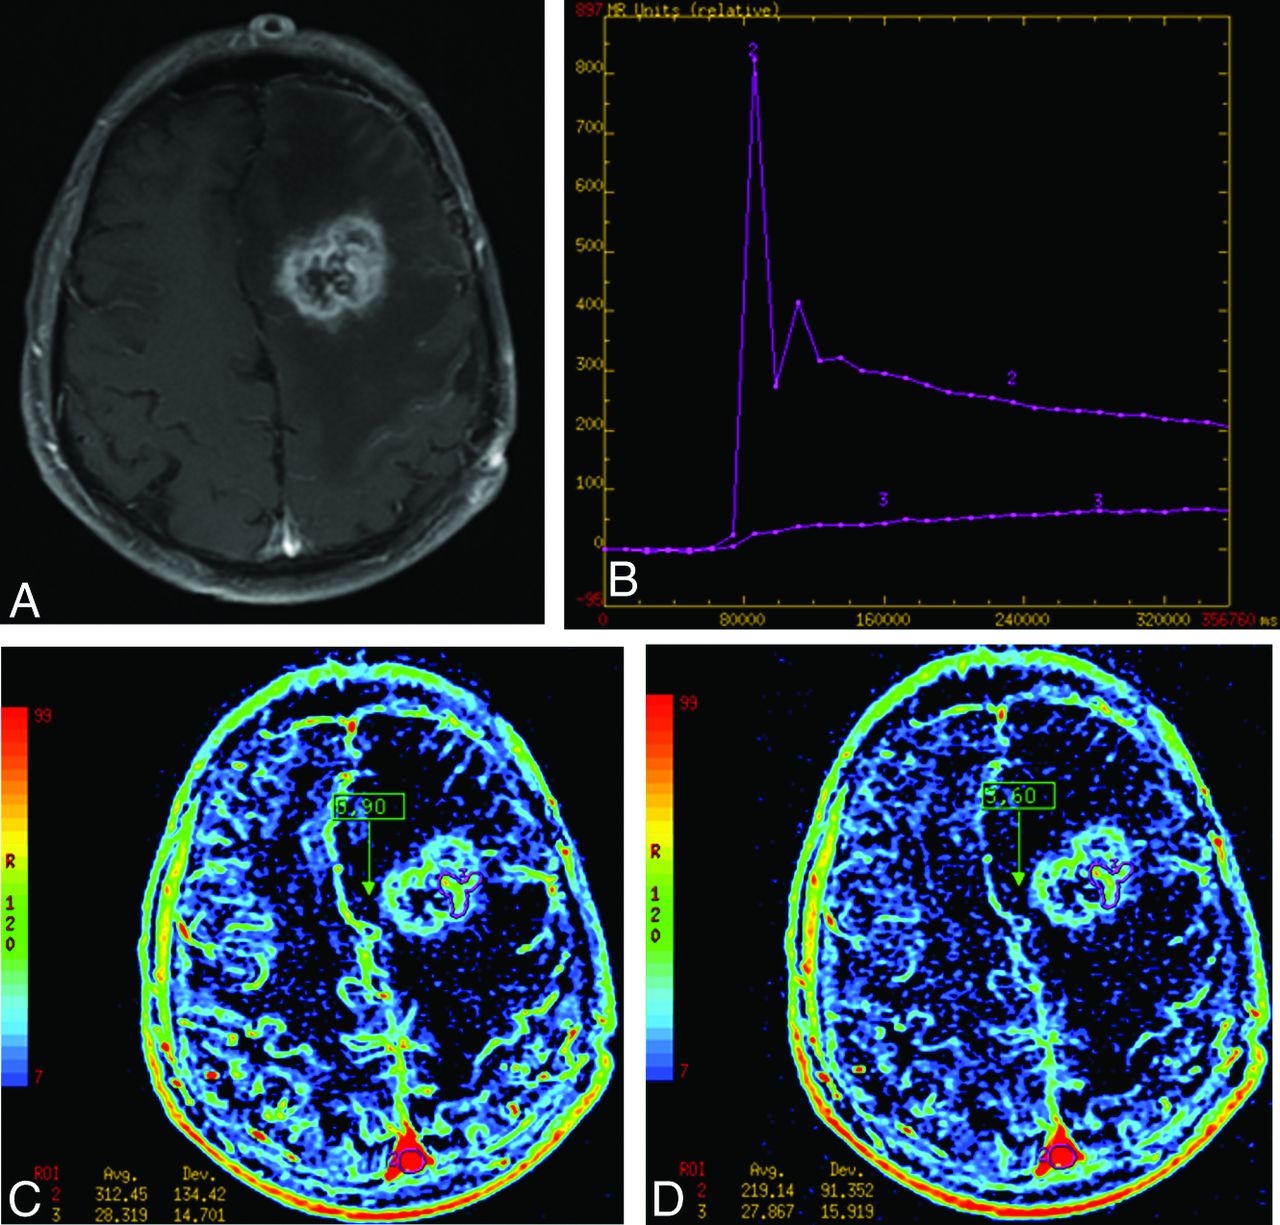
- Fig 4.
Example of treatment-related necrosis by using 2 different AUC measurements. A, An enhancing lesion on T1WI of the left frontal lobe, which was proved to be treatment-related necrosis (pathology grade = 5). B, A slow progressive increase in signal of the lesion compared with the vascular input and the lesion in B. C and D, the “intermediate AUC” and “delayed short AUC” integrations, respectively. Notice the significant drop in the superior sagittal sinus between these integrations (312 to 219 relative units) with little change in the lesion (it remains at 28). Intermediate and delayed short AUC values from these data are 9% (28/312) and 12% (28/219), respectively.


Tables
Comparison of DCE measurement with pathologic gradinga
Measurement Method Nonparametric Coefficient Significance (P Value) Post Hoc Cutoff Sensitivity Specificity Accuracy Mean Ktrans 1-Nordic 0.606 .002 ≥0.05 min−1b 80% 78% 79% Max Ktrans 1-Nordic 0.542 .006 ≥0.2 min−1 80% 78% 79% Mean kep 1-Nordic 0.446 .03 ≥0.27 min−1 47% 78% 58% Mean vp 1-Nordic 0.555 .005 >2c 71% 89% 79% Max vp 1-Nordic 0.513 .01 >9c 73% 67% 71% Mean ve 1-Nordic 0.566 .004 >12c 80% 78% 79% Short AUC 2-Simple 0.410 .047 >12%c 93% 67% 84% Intermediate AUC 2-Simple 0.478 .018 >14%c 93% 67% 84% Delayed short AUC 2-Simple 0.556 .005 >20%c,d 93% 78% 88% Note:—Delayed short AUC indicates ratio of AUC from the lesion over the superior sagittal sinus vascular input integrated between the end of the initial vascular washout and early progressive leakage phases; max, maximum; kep, reflux rate constant; ve, extravascular, extracellular volume fraction.
↵a The methods given are for model-independent “simple” calculations of the signal with time (method 2) versus the pharmacokinetic model calculations using nordicICE (method 1). The pixel selection algorithm around the superior sagittal sinus was used for the latter. The nonparametric correlation to categoric ranking of pathology is given by a Spearman ρ correlation. Post hoc arbitrary cutoff values are given for the most accurate performance for determining tumor, with tumor (pathology grading of 1–3) regarded as a positive case for sensitivity and specificity.
↵b Best performing modeled variable for correlation with pathology.
↵c A relative unit.
↵d Best performing model independent variable.


Jump to section
Related Articles
Cited By...
- Diagnostic Accuracy of Arterial Spin-Labeling, Dynamic Contrast-Enhanced, and DSC Perfusion Imaging in the Diagnosis of Recurrent High-Grade Gliomas: A Prospective Study
- "Early Imaging Marker of Progressive Glioblastoma: a window of opportunity"
- Comparison of Dynamic Contrast-Enhancement Parameters between Gadobutrol and Gadoterate Meglumine in Posttreatment Glioma: A Prospective Intraindividual Study
- The Initial Area Under the Curve Derived from Dynamic Contrast-Enhanced MRI Improves Prognosis Prediction in Glioblastoma with Unmethylated MGMT Promoter