
Abstract
BACKGROUND AND PURPOSE: T2 relaxation time is a quantitative MR imaging parameter used to detect degenerated cartilage in the knee and lumbar intervertebral disks. We measured the T2 relaxation time of the articular disk of the temporomandibular joint in patients with temporomandibular disorders and asymptomatic volunteers to demonstrate an association between T2 relaxation time and temporomandibular disorder MR imaging findings.
MATERIALS AND METHODS: One hundred forty-four patients with temporomandibular disorders and 17 volunteers were enrolled in this study. An 8-echo spin-echo sequence for measuring the T2 relaxation times was performed in the closed mouth position, and the T2 relaxation time of the entire articular disk was measured. Patients were classified according to the articular disk location and function, articular disk configuration, presence of joint effusion, osteoarthritis, and bone marrow abnormalities.
RESULTS: The T2 relaxation time of the entire articular disk was 29.3 ± 3.8 ms in the volunteer group and 30.7 ± 5.1 ms in the patient group (P = .177). When subgroups were analyzed, however, the T2 relaxation times of the entire articular disk in the anterior disk displacement without reduction group, the marked or extensive joint effusion group, the osteoarthritis-positive group, and the bone marrow abnormality–positive group were significantly longer than those in the volunteer group (P < .05).
CONCLUSIONS: The T2 relaxation times of the articular disk of the temporomandibular joint in patients with progressive temporomandibular disorders were longer than those of healthy volunteers.
ABBREVIATIONS:
- ADDWOR
- anterior disk displacement without reduction
- ADDWR
- anterior disk displacement with reduction
- PADDWOR
- partial anterior disk displacement without reduction
- PADDWR
- partial anterior disk displacement with reduction
- TMD
- temporomandibular disorders
- TMJ
- temporomandibular joint
Disorders of the temporomandibular joint (TMJ) are characterized by intra-articular positional and/or structural abnormalities.1 MR imaging is the preferred imaging technique for diagnosing temporomandibular disorders (TMD).2 It has been reported that the diagnostic accuracy of MR imaging for the assessment of the articular disk position and articular disk formation is 95% and for the assessment of osseous changes is 93% in postmortem examinations.3 Numerous studies of TMD by using MR imaging have reported qualitative and morphologic evaluations, because the most important subgroup of articular abnormalities in patients with TMD includes different forms of articular disk displacement and deformation of the articular disk, either with normal bony joint components or accompanied by degenerative joint diseases such as osteoarthritis.4 Other MR imaging findings of TMD, including joint effusion and bone marrow abnormalities, have also been evaluated qualitatively and morphologically.5,6
The T2 relaxation time is a quantitative MR imaging parameter derived from multiecho spin-echo sequences. Measuring the T2 relaxation times by using MR imaging has been reported to detect degenerated cartilage in the knee and lumbar intervertebral disk.7⇓⇓⇓–11 The T2 relaxation time of the articular disk of the TMJ in healthy volunteers has been previously described by using a 3T MR imaging system,12 but the T2 relaxation time of the articular disk of the TMJ in patients with TMD has not been reported, to our knowledge.
We hypothesized that the T2 relaxation time of the articular disk of the TMJ correlates with the qualitative and morphologic variations in the pathology of the TMJ. The aims of this study were to measure the T2 relaxation time of the articular disk of the TMJ in patients with TMD and asymptomatic volunteers to demonstrate any association between T2 relaxation time and MR image findings of TMD.
Materials and Methods
Institutional review board approval was obtained for this study, and all patients and volunteers provided their written informed consent after the nature of the procedure was fully explained.
Study Population
From 2009 to 2012, one hundred fifty patients with TMD referred for MR imaging due to facial or TMJ pain; mandibular dysfunction, such as clicking, crepitation, or locking; or suspected internal derangement were recruited for this study. Six patients were excluded from this study due to motion or metallic artifacts on MR images. After these exclusions, the remaining 144 patients (110 females, 34 males; median age, 36 years; age range, 11–80 years) were analyzed. In addition, 21 asymptomatic volunteers underwent MR imaging examinations. The MR images of the TMJ in 4 of these volunteers demonstrated abnormal findings such as anterior disk displacement; hence, data from these volunteers were excluded from this study. The remaining 17 asymptomatic healthy volunteers (5 women, 12 men; median age, 26 years; age range, 23–32 years) were considered to have normal TMJs.
MR Imaging
All subjects were examined by using a 1.5T MR imaging scanner (Signa HDxt 1.5T; GE Healthcare, Milwaukee, Wisconsin) equipped with a TMJ surface coil. The imaging protocol to diagnose TMD consisted of oblique sagittal and coronal fast spin-echo proton-attenuation-weighted sequences (TR/TE/echo-train length/NEX, 2500 ms/20 ms/8/2); fat-suppressed T2-weighted sequences (TR/TE/echo-train length/NEX, 2000 ms/85 ms/16/3) obtained perpendicular and parallel to the long axis of the mandibular condyle in a closed-mouth position; and sagittal spin-echo proton-attenuation-weighted sequences (TR/TE/echo-train length/NEX, 800 ms/24 ms/4/2) in closed- and open-mouth positions with the following parameters: 120 × 120 mm FOV; 256 × 160 matrix size; 3-mm section thickness; and 1-mm gap. In addition to these sequences, oblique sagittal 8-echo fast spin-echo sequences were obtained perpendicular to the long axis of the mandibular condyle in a closed-mouth position to measure the T2 relaxation times with the following parameters: TR/TE/NEX = 1000 ms/8.9, 17.8, 26.7, 35.6, 44.5, 53.4, 62.4, 71.3 ms/2; 120 × 120 mm FOV; 256 × 160 matrix size; 4-mm section thickness; and 1-mm gap. The total acquisition time for this T2 relaxation time–measuring sequence was 5 minutes 22 seconds for each joint.
MR Image Evaluation
All MR images were independently evaluated by 2 oral and maxillofacial radiologists (N.K. with 16 years of experience and H.S. with 8 years of experience). In cases of disagreement, the final diagnosis was made by consensus. We evaluated the following features: the articular disk position and function, the articular disk configuration, joint effusion, osteoarthritis, and bone marrow abnormalities.
The articular disk position and function were classified into 5 categories, as reported by Tasaki et al,13 with some modifications: normal superior, partial anterior disk displacement with reduction (PADDWR), partial anterior disk displacement without reduction (PADDWOR), anterior disk displacement with reduction (ADDWR), or anterior disk displacement without reduction (ADDWOR) in closed- and open-mouth-position sagittal proton-attenuation-weighted MR images. The articular disk configuration was classified into 6 categories, as reported by Murakami et al,14 with some modifications: biconcave, biplanar, hemiconvex, thickening of the posterior band, biconvex, or folded on closed-mouth-position oblique sagittal proton-attenuation-weighted MR images. Joint effusion was classified into 4 categories, as proposed by Larheim et al5: no or minimal fluid, moderate fluid, marked fluid, or extensive fluid on closed-mouth-position oblique sagittal fat-suppressed T2-weighted MR images. Osteoarthritis was classified into negative and positive, in which condylar osteophytes or erosion was observed, as reported by Kirk15 on closed-mouth-position oblique sagittal proton-attenuation-weighted MR images. Bone marrow abnormalities of the mandibular condyle were classified into negative and positive on the basis of the presence of edema or osteonecrosis, as described by Larheim et al16 on closed-mouth-position oblique sagittal proton-attenuation- and T2-weighted MR images.
Measurement of the T2 Relaxation Time
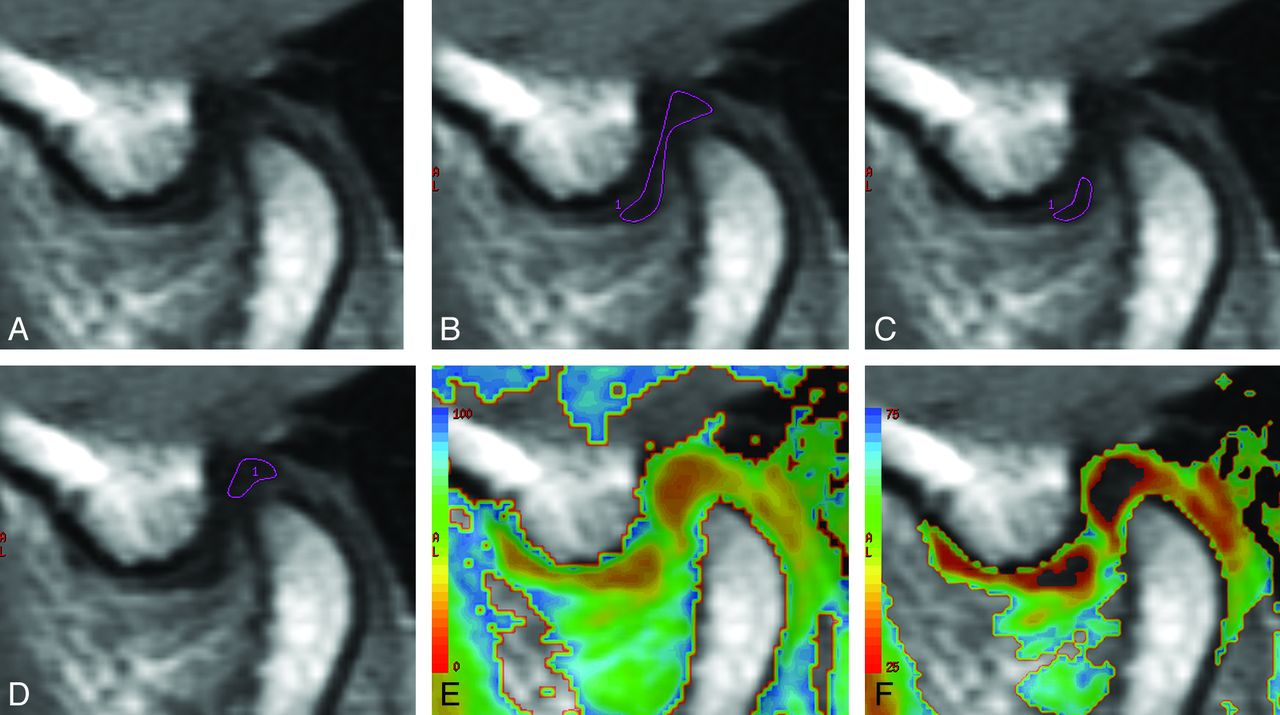
The 8-echo spin-echo image data were transferred to an independent workstation (Advantage Workstation, Version 4.4; GE Healthcare). ROIs for measuring the T2 relaxation time were manually placed by 2 observers independently (N.K. and H.S.) on the entire articular disk, the anterior band of the articular disk, and the posterior band of the articular disk (Fig 1). The T2 relaxation time of the articular disk was calculated by using a software program (Functool 4.4.5; GE Healthcare).

MR images of the articular disk of the TMJ, in a volunteer, used to measure the T2 relaxation time. A, The source MR image of the articular disk. The ROIs used for the measurement of the T2 relaxation time of the entire articular disk (B), the anterior band of the articular disk (C), and the posterior band of the articular disk (D). The T2 relaxation times on a color map ranging from 0 to 100 ms (E) and 25 to 75 ms (F).
The average value measured by the 2 observers was defined as the T2 relaxation time. For the measurement of the intraobserver reproducibility, 1 observer (N.K.) placed ROIs on the entire articular disk in 17 healthy volunteers 10 times on different days.
Statistical Analysis
As mentioned above, the coefficient of variation of 10 datasets of the entire articular disk in healthy volunteers was calculated to evaluate the intraobserver reproducibility. To evaluate the interobserver reproducibility, the Pearson product moment correlation coefficient was calculated for the 2 observers' data for the T2 relaxation time of the entire articular disk in healthy volunteers and patients. In the healthy volunteers, a paired t test was used to compare the T2 relaxation times of the entire articular disk between the right and left TMJs and between the anterior and posterior bands of the articular disk. A P value < .05 was considered a significant difference. To compare the T2 relaxation times of the entire articular disk between healthy volunteers and patients, the Mann-Whitney U test or the Kruskal Wallis test was performed. A P value < .05 was considered a significant difference. A post hoc pair-wise analysis was performed by using the Mann-Whitney U test with a Bonferroni correction, in which a P value of < .05/5 for the articular disk position and function and joint effusion, .05/7 for the articular disk configuration, and .05/3 for osteoarthritis and bone marrow abnormalities was considered a significant difference. Multiple-regression analyses with simultaneous entry were used to identify important predictor variables for the T2 relaxation time of the entire disk among the MR image interpretations, and the patient age and sex were used as confounding variables. All of the statistical analyses were performed by using a commercially available software package (Statistical Package for the Social Sciences, Version 16.0; IBM, Armonk, New York).
Results
The MR imaging findings of TMJs in healthy volunteers and patients are summarized in Table 1. In the healthy volunteers, all joints showed normal articular disk position and function, and 32 biconcave and 2 biplanar disks were found. All joints were classified as having no or minimal fluid for joint effusion and were negative for both osteoarthritis and bone marrow abnormalities. In patients with TMD, most joints showed a normal articular disk position and function followed by anterior disk displacement without reduction, a biconcave disk, and no or minimal fluid for joint effusion and were negative for osteoarthritis and bone marrow abnormalities.
The patient and volunteer characteristics and MR imaging findings
Intraobserver reproducibility by using the coefficient of variation of the T2 relaxation times of the entire articular disk in the healthy volunteers ranged from 1.1% to 4.7%. Interobserver reproducibilities, determined by using the Pearson product moment correlation coefficient for the 2 observers' data for the entire articular disk T2 relaxation time, were 0.862 (P < .001) in the healthy volunteers and 0.891 (P < .001) in patients.
The mean T2 relaxation times of the entire articular disk are shown in Table 2. In healthy volunteers, there was no significant difference in the T2 relaxation times of the entire disk between the left and right TMJs (29.6 ± 3.9 versus 28.9 ± 3.8 ms, P = .585), whereas a significant difference between the T2 relaxation times of the anterior and posterior bands was observed (29.0 ± 5.4 versus 26.5 ± 3.6 ms, P = .007). Moreover, there were no significant differences in the T2 relaxation times of the entire articular disk between male and female groups (29.0 ± 3.6 versus 29.8 ± 4.3 ms, P = .620) and between younger and older age groups (29.4 ± 3.9 versus 29.1 ± 3.8 ms, P = .814). When healthy volunteers were compared with patients, the mean T2 relaxation times of the entire articular disk in healthy volunteers and patients with TMD were 29.3 ± 3.8 and 30.7 ± 5.1 ms, respectively. There were no significant differences in the mean T2 relaxation times of the entire articular disk between these 2 groups (P = .177). In patients with TMD, there was no significant difference in the T2 relaxation time of the entire articular disk between male and female groups (29.5 ± 4.0 versus 31.1 ± 5.4 ms, P = .890). However, there was a significant difference in the T2 relaxation times of the entire disk between younger and older age groups (29.5 ± 4.4 versus 3.19 ± 5.5 ms, P < .001).
The T2 relaxation time of the articular disk
With respect to the articular disk position and function, only 2 joints were classified as PADDWOR. The data from these 2 joints were excluded from further analyses of the articular disk position and function. The mean T2 relaxation times of the entire articular disk in the normal superior patients, the PADDWR, ADDWR, and ADDWOR groups were 29.4 ± 4.2, 28.9 ± 4.0, 30.5 ± 5.3, and 32.3 ± 5.7 ms, respectively. The mean T2 relaxation time of the entire articular disk in the ADDWOR group was significantly longer than that observed in the volunteer group (P = .005) and the normal superior patient group (P < .001) (Fig 2A).

The T2 relaxation times according to the MR image interpretations. A, The T2 relaxation times according to the articular disk position and function categories. The asterisk indicates P < .05/5 in the Mann-Whitney test with a Bonferroni correction. B, The T2 relaxation times according to the articular disk configuration categories. “Thickening” indicates thickening of the posterior band. C, The T2 relaxation times according to the joint effusion categories. “None” indicates no or minimal fluid; “Moderate,” moderate fluid; “Marked,” marked fluid; and “Extensive,” extensive fluid. The asterisk indicates P < .05/5 in the Mann-Whitney test with a Bonferroni correction. D, The T2 relaxation times according to the osteoarthritis categories. The asterisk indicates P < .05/3 in the Mann-Whitney test with a Bonferroni correction. E, The T2 relaxation times according to the bone marrow abnormality categories. The asterisk indicates P < .05/3 in the Mann-Whitney test with a Bonferroni correction. NorVol indicates healthy volunteers.
With respect to the articular disk configuration, the mean T2 relaxation times of the entire articular disk in the biconcave, biplanar, hemiconvex, thickening of the posterior band, biconvex, and folded groups were 30.0 ± 4.6, 29.9 ± 4.8, 32.5 ± 6.6, 30.7 ± 3.9, 31.6 ± 6.9, and 31.6 ± 5.8 ms, respectively. There were no significant differences among these groups (Fig 2B).
With respect to joint effusion, the mean T2 relaxation times of the entire articular disk in the patient groups with no or minimal fluid, moderate fluid, marked fluid, and extensive fluid were 30.0 ± 4.7, 30.2 ± 4.5, 34.0 ± 6.3, and 36.2 ± 5.6 ms, respectively. The mean T2 relaxation time of the entire articular disk in the marked or extensive fluid group was significantly longer than that observed in the healthy volunteer group (P = .002 or P < .001), the patient group with no or minimal fluid (P < .001 or P = .001), and the moderate fluid group (P = .002 or P < .001) (Fig 2C).
With respect to osteoarthritis, the mean T2 relaxation times of the entire articular disk in patients with negative and positive findings were 29.9 ± 4.3 and 34.4 ± 6.7 ms, respectively. The mean T2 relaxation time of the entire articular disk in the osteoarthritis-positive group was significantly longer than that observed in the healthy volunteer group (P < .001) and the osteoarthritis-negative group (P < .001) (Fig 2D).
With respect to bone marrow abnormalities, the mean T2 relaxation times of the entire articular disk in the patients with negative and positive findings were 30.4 ± 5.0 and 33.6 ± 5.9 ms, respectively. The mean T2 relaxation time of the entire articular disk in the bone marrow abnormality–positive group was significantly longer than that observed in the healthy volunteer group (P = .003) and the bone marrow abnormality–negative in the group (P = .002) (Fig 2E).
According to the multiple-regression analysis, the important variables affecting the T2 relaxation time of the entire disk were identified as osteoarthritis (P = .001), joint effusion (P = .003), and bone marrow abnormalities (P = .02) (Table 3). The adjusted R2 for the multiple regression analysis for the T2 relaxation time of the entire disk was 0.957 (P < .001).
The multiple regression model for T2 relaxation time of the entire disk
Discussion
Quantitative measurements of the T2 relaxation time are useful for characterizing knee osteoarthritis and degenerated intervertebral disks.7⇓⇓⇓–11 The immobilization of water protons in the cartilage by the collagen-proteoglycan matrix promotes T2 decay and renders the cartilage low in signal intensity on T2-weighted images, while mobile water protons in the synovial fluid retain their high signals. A loss of collagen and proteoglycan in degenerating cartilage increases the mobility of water, thus increasing its signal intensity on T2-weighted images.17 The T2 relaxation times of the intervertebral disk anulus fibrosus and nucleus pulposus correlate strongly with the water content and weakly with the proteoglycan content.18 It has been reported that the T2 relaxation times of the nucleus pulposus of the intervertebral disk in the lumbar spine exhibit significant differences in disks with herniation and anular tears compared with disks without these abnormalities,10 and the T2 relaxation time in lumbar disks was reported to be correlated with the stage of disk degeneration and patient age.11
Measurement of the T2 relaxation time of the TMJ articular disk in normal joints has only been performed in 1 previous study.12 In that study, the T2 relaxation time of the entire articular disk of the normal TMJ was 40.21 ± 2.95 ms, which was longer than the value measured in our study. They used a 3T MR imaging scanner to measure the T2 relaxation time of the articular disk, but we used a 1.5T scanner. They also measured the T2 relaxation time at the anterior, middle, and posterior band and found that the middle zone of the articular disk showed longer T2 relaxation times than the anterior and posterior bands. In contrast to our study, there was no significant difference in the T2 relaxation times between the anterior and posterior bands. It has been reported that the elastic fiber attenuation of the anterior and posterior bands of the articular disk of the TMJ is significantly different.19 Therefore, the T2 relaxation time of both bands may be different, as shown in our study. Further investigations might be necessary to confirm which findings are appropriate and whether there are population-based differences or scanner magnet-strength differences. Moreover, in patients with TMD, the T2 relaxation time of the entire articular disk in the older age group was significantly longer than that in the younger age group. Further investigations are needed for the correlation of age or duration of TMD and the T2 relaxation time.
The TMJ articular disk is composed of collagen fibers, proteoglycans, and tissue fluid.20 It has been reported that the content of glycosaminoglycan, a polysaccharide attached to a core protein in proteoglycan, in the articular disk of the TMJ in patients with anterior disk displacement and those with chronic closed lock is considerably lower than that observed in normal disk tissue.21,22 Therefore, the composition of the articular disk is thought to change under the above conditions. In this study, although patients and healthy volunteers showed no differences in the T2 relaxation time of the entire articular disk, the T2 relaxation times of the entire articular disk in the ADDWOR group, the severe joint effusion group, the osteoarthritis-positive group, and the bone marrow abnormality–positive group were significantly longer than that observed in the volunteer group. The multiple regression analyses showed that osteoarthritis, joint effusion, and bone marrow abnormalities were important variables affecting the T2 relaxation time of the entire disk. This finding means that the T2 relaxation time of the articular disk is longer in patients with advanced TMD findings on MR imaging. Therefore, the T2 relaxation time of the articular disk of the TMJ may correlate with a progressive course of TMD.
It has been reported that the articular disk configuration changed from biconcave configuration to distorted configuration after disk displacement.14 Then the T2 relaxation time of the distorted articular disk may show a value similar to that of the T2 relaxation time of the ADDWOR group. In our study, the T2 relaxation times of the hemiconvex, thickening of the posterior band, biconvex, and folded group were 32.5 ± 6.6, 30.7 ± 3.9, 31.6 ± 6.9, and 31.6 ± 5.8 ms, respectively, and that of ADDWOR group was 32.3 ± 5.7 ms. These T2 relaxation times were fairly similar. Although there were no significant differences among the T2 relaxation times of these disk-configuration groups, further study is needed.
There are some limitations associated with the present study. First, the T2 relaxation times were only measured on the central portion of the articular disk. The medial and lateral areas of the articular disk could not be evaluated because the section thickness of the MR images used to measure the T2 relaxation time was set to 4 mm with a 1-mm intersection gap, and this thickness led to a limited volume of the articular disk appearing on MR images. Second, there was no histopathologic correlation with the T2 relaxation time of the articular disk in this study. Almost all patients with TMD were treated conservatively with medication, splint therapy, or physical therapy, and due to the high diagnostic accuracy of MR imaging for assessing TMD,3 the conditions of patients were not confirmed histopathologically. On the basis our study, the potential alterations in the T2 relaxation time of the articular disk may result from underlying pathologic conditions; thus, the T2 relaxation time can provide important information about TMD. Third, there was no clinical correlation such as pain scale with the T2 relaxation time of the articular disk in this study. Further studies with clinical correlation are needed to confirm the significance of the T2 relaxation time.
Conclusions
The T2 relaxation time of the entire articular disk was 29.3 ± 3.8 ms in healthy volunteers and 30.7 ± 5.1 ms in patients with TMD, and there was no significant difference between these groups. The T2 relaxation times of the entire articular disk in the ADDWOR group, the severe joint effusion group, the osteoarthritis-positive group, and the bone marrow abnormality–positive group were, however, significantly longer than those observed in the volunteer group; and the T2 relaxation times of the articular disk of the TMJ in patients with progressive TMD were longer than those of healthy volunteers. Hence, the T2 relaxation time of the TMJ articular disk may correlate with a progressive course of TMD.
Footnotes
A part of this paper previously presented at: 18th International Congress of Dento-Maxillo-Facial Radiology, May 25-29, 2011; Hiroshima, Japan.
References
- Received October 23, 2013.
- Accepted after revision December 11, 2013.
- © 2014 by American Journal of Neuroradiology


Jump to section
Related Articles
Cited By...
- No citing articles found.