
Abstract
BACKGROUND AND PURPOSE: Diffusion tensor imaging (DTI) and MR spectroscopy are noninvasive, quantitative tools for the preoperative assessment of gliomas with which the quantitative parameter fractional anisotropy (FA) and the concentration of neurometabolites N-acetylaspartate (NAA), choline (Cho), creatine (Cr) of the brain can be determined. Measurements of FA and NAA reflect the integrity of fiber tracts and the presence of neurons, respectively. This investigation examines changes of FA and NAA and compares these different aspects in architecture of gliomas after spatial coregistration.
METHODS: DTI and chemical shift 1H-MR spectroscopy was performed in 34 healthy volunteers and 69 patients with histologically confirmed (n = 48) or morphologically suspected (n = 21) non-necrotic brain glioma. Volumes of interest (VOIs) were placed in the tumor center (TC), the tumor border (TB), the normal-appearing white matter adjacent to the tumors (TNWM), and in the white matter of the contralateral hemisphere (NWMC). Median FA values and NAA/Cr and NAA/Cho ratios were calculated in the patients’ VOIs and the gray and white matter of the volunteers. Correlations of FA values and NAA ratios were calculated.
RESULTS: Continuous changes of FA and NAA from the tumor center to the periphery (the adjacent white matter and the contra-lateral hemisphere, respectively) were observed, where median values were: TC: 0.73 ± 0.45, 0.47 ± 0.58, 0.17 ± 0.15 (NAA/Cr, NAA/Cho, FA); TB: 1.06 ± 0.53, 1.00 ± 0.15, 0.23 ± 0.08; TNWM: 1.42 ± 2.48, 1.21 ± 0.95, 0.34 ± 0.09; and NWMC: 1.63 ± 0.72, 1.56 ± 1.34, 0.38 ± 0.08. Correlation of median FA values and NAA ratios in the cumulative group of patients was high (r = 0.99 [NAA/Cr], 0.95 [NAA/ Cho] at P < .01). Correlation between the individual NAA ratios and the FA values was moderate (r = 0.53 [NAA/Cr], 0.51 [NAA/Cho] at P < .01).
CONCLUSION: In gliomas, the degree of tissue organization decreases continuously from the surrounding tissue toward the center of the tumor accompanied by a concordant decrease of NAA. This uniform behavior of FA and NAA reflects a decreasing integrity of both neuronal structures and fibers.
Extensive infiltration of glial tumors in the brain limits surgical resection and eventually leads to recurrence and progression of the disease. The infiltrative growth pattern of gliomas has been investigated extensively in the past. Sixty years ago, Scherer1 showed that invasion of glial tumors in the brain is associated with distinct anatomic structures following myelinated axons, the basement membranes of blood vessels, or other basement membrane-like structures. Glial tumors consist of a core mass and a penumbra of invasive, single cells, decreasing in number toward the periphery.2,3 Tumor invasion causes displacement, deviation, and destruction of myelinated fiber tracts. Preceding the massive invasion and destruction of adjacent structures, single invasive cells can be identified histologically even several centimeters away from the core of the lesion; these cells follow myelinated fiber tracts with minimal damage to pre-existing neuronal structures. The mechanisms of tumor cell migration are linked to specific molecular interactions between tumor cells and their surrounding matrix.4
With conventional T1-, T2-, and proton attenuation-weighted MR imaging, the tissue mass of a glioma can be detected but not the extent of tumor infiltration in fiber tracts. The morphologic aspect of these lesions, generated by vasogenic edema in response to tumor cells, does not indicate whether myelinated fiber tracts within or surrounding the tumor are preserved or not unless tumor necrosis is visible. This is the major determinant for the failure of local therapies and cause of almost inevitable tumor progression.2
The preferential direction of water diffusion in the brain along fiber tracts can be measured by diffusion tensor imaging (DTI). The directionality of water diffusivity—fractional anisotropy (FA)—is correlated with the microstructural integrity of myelinated fiber tracts.5,6 The underlying biophysical phenomena are still the subject of controversial discussions.7-9 Tumor cells infiltrating fiber tracts lead to reduction of FA. These changes of proton diffusion have been evaluated in several studies investigating the degree of fiber tract destruction or even tumor grading. The results of these studies are inconclusive and generate a number of physiologic and pathologic concepts to explain the mechanisms influencing water diffusion in normal and pathologic brain tissue.10-14
Changes of the MR spectra of brain tissue infiltrated by gliomas reveal a reduced concentration of N-acetylaspartate (NAA) in relation to other metabolites, such as choline (Cho) and creatine (Cr). Many studies have supported these phenomena as routine diagnostic criteria for brain tumor assessment.15-19 An inverse correlation of Cho and the apparent diffusion coefficient (ADC) in gliomas has been demonstrated and is associated with the tumor cellularity.20 Because FA and NAA alterations are linked to the integrity of neurons, the correlation of both parameters may give further insights into the physical and physiologic changes measured by both methods. For the time being, data regarding FA and NAA correlations are limited to neuronal degeneration in X-linked adrenoleukodystrophy (ALD) and amyotrophic lateral sclerosis (ALS).21,22 To the best of our knowledge, a correlation of FA- and NAA-alteration in brain gliomas has not yet been studied.
In contrast to neurodegenerative diseases, the changes of brain tissue architecture in patients with gliomas are influenced not only by neuronal destruction but also by additional tumor tissue infiltrating the fiber tracts. Whether tumor tissue may cause a main vector for proton movement influencing the FA in infiltrated brain tissue remains unknown. Tumor cellularity, the size of cells, or the prevalent type of tumor cells (ie, protoplasmatic or gemistocytic cells) infiltrating the fiber tracts may influence proton diffusion. Arrangement in an ordered manner could cause a directional restriction of proton movement. The purpose of this study was to evaluate FA and NAA changes and their correlation as indicators of cellular integrity in glial brain tumors.
Patients and Methods
The study protocol was approved by the local ethics committee. Written informed consent was obtained from all patients and from the control group.
Patients
Between July 2002 and August 2004, DTI and MR spectroscopy was performed in 69 adult patients (46 men, 23 women) with histologically confirmed (n = 48) low-grade or anaplastic glioma (WHO grade III) or morphologically suspected low-grade glioma (n = 21). Histologic confirmation of the tumors was achieved by gross resection (n = 41) and stereotactic biopsy (n = 7). The extent of tumor resection was dependent on the tumor localization. In eloquent areas, only the tumor core was resected (n = 22). Subradical resection was carried out in 19 cases.
Because histopathologic analysis regarding regional differences in the tumor or the infiltration zone was not performed, correlation of the NAA ratios and the FA measurements with histopathologic findings, such as tumor cellularity or vascularity in the different volumes of interest (VOIs), could not be done.
Inclusion criteria for patients with suspected low-grade glioma without histologic confirmation were a bright lesion on T2-weighted images with mass effect, no contrast enhancement, and no morphologic changes for at least 6 months. Tumor necrosis denotes extreme destruction of fiber tracts and does not represent infiltrating vital tumor tissue. Therefore, patients with necrotic tumors were excluded from this investigation. Mean age of all patients was 43 years (range, 22–76 years). The 48 histologically confirmed tumors were low-grade glioma, WHO grade II in 29 (astrocytoma, n = 24; oligodendroglioma, n = 5) and anaplastic glioma WHO grade III in 14 cases (astrocytoma, n = 12; oligodendroglioma, n = 2). None of the patients received a steroid medication.
Control Group
Thirty-four healthy volunteers (mean age, 27.5; range, 20–47; 20 women, 14 men) were investigated with the identical MR imaging protocol (except for T1-weighting after gadolinium application). Spectroscopy was applied in the supraventricular white matter and adjacent gray matter avoiding partial volume effect with the scalp.
MR Imaging Parameters
All examinations were performed with a 1.5T MR unit (Symphony Sonata; Siemens Medical, Erlangen, Germany) including an axial T2-weighted (turbo spin-echo) triple-echo sequence, magnetization transfer sequences, diffusion-weighted imaging (DWI), diffusion tensor imaging (DTI), chemical shift proton (1H-MR) spectroscopy, and an axial T1-weighted spin-echo examination before and after intravenous contrast media administration (gadolinium-diethylene triamine pentaacetic acid, 0.1 mmol/kg body weight; Magnevist Schering, Berlin, Germany). Technical parameters of DTI were: single- shot, spin-echo, echo-planar imaging (EPI) diffusion tensor sequence; EPI factor, 96; repetition time, 4900 ms; echo time, 90 ms; 6 directions, b values 0/1500 s/mm2, 32 sections, section thickness, 3 mm/0 gap; field of view, 230 mm; in-plane resolution, 128 × 128 interpolated to an image matrix of 256 × 256; acquisition time, 5 minutes, 14 seconds.
1H-MR spectroscopy was performed with transverse 2D multivoxel chemical shift imaging (PRESS) with automated shimming to reduce field inhomogeneity (repetition time, 1450 ms; echo time, 135 ms; VOI, 100 × 80-mm matrix in a 180 × 140-mm field of view; flip angle, 90°; section thickness, 15 mm; spectral width, 1000 Hz; acquisition time, 5 minutes, 38 seconds). A voxel size of 0.5 × 0.5 × 1.5 cm was obtained. The VOI was placed in the tumor center including the contralateral hemisphere to avoid contamination with signal intensity from the scalp.
Image Analysis
FA maps were created with the use of a DTI task card implemented on the MR console (Massachusetts General Hospital, Boston, Mass). Distortion artifacts of the FA maps were equalized by coregistration of the b0-images, the third echo (126 ms) of the T2-weighted sequence, and the FA maps. The FA maps were calculated into continuous 3D datasets with 6.5-mm section thickness with SPM (Wellcome Department of Imaging in Neuroscience, London, UK) in MATLAB (The MathWorks, Natick, Mass). The same T2-weighted echo was used to place defined VOIs in the spectroscopic matrix of 4 voxels each in the tumor center (TC), the tumor border (TB), the normal-appearing white matter adjacent to the tumor (TNWM), and in the normal-appearing white matter of the contralateral hemisphere (NWMC) applying the software MRIcro (Chris Roden; University of Nottingham, Nottingham, UK) (Fig 1). All investigated tumors were large enough to cover the VOI in the TC. The VOIs in the TB were placed in a location to cover a maximum of tumor tissue with only minimum contamination with normal-appearing white matter. Conversely, the normal-appearing white matter VOIs (TNWM) were defined by a maximum of normal white matter with only little influence of tumor tissue. In the contralateral hemisphere, the VOIs (NWMC) were positioned in a location where a maximum of white matter was included with only a minimum of gray matter covered. VOI placement in the CSF was strongly avoided. Median FA values were evaluated for each VOI in 3 5-mm sections covering the same volume of tissue as studied by spectroscopy.

A, Regions of interest were placed in the spectroscopic matrix on T2-weighted images (2720/126; 256 × 256 matrix; field of view, 230 × 230 mm; section thickness, 6 mm) in the tumor center (TC), the border of the tumor (TB), the normal-appearing white matter adjacent to the tumor (TNWM), and in the white matter of the contralateral hemisphere (NWMC).
B, After reslicing and coregristration with the T2-weighted images, the ROIs were transferred to the FA maps (4900/90 ms; 256 × 256 matrix; field of view, 230 × 230 mm; section thickness, 3 mm; b values, 0, 1500 seconds/mm2; EPI factor, 36).
The spectroscopic VOIs in the control group examination were placed in the white matter of the corona radiata and the adjacent gray matter in the midline covering up to 6 voxels of the spectroscopic matrix (voxel size: 1 × 1 × 1.5 cm). In the gray matter VOIs, interference with CSF between the gyral sulci was eliminated by calculating ratios between NAA and Cho and Cr, respectively. FA values of the control group’s white matter were evaluated in the frontal, parietal, and occipital lobes covering a VOI of 80–100 pixels strongly avoiding contact with gray matter or CSF. Gray matter FA values were obtained in the lentiform nucleus. Statistical analysis was made applying the Mann-Whitney U test for pairwise comparisons and Spearman-Rho test for correlation analysis using SPSS (SPSS, Chicago, Ill). Statistical significance was defined as P ≤ 0.05.
Results
Patients
Compared with the contralateral hemisphere, the median values of the NAA/Cr and NAA/Cho ratios were significantly reduced (P < .01) in the tumor VOIs (TC, TB) and the TNWM. NAA/Cr values were (median ± SD): TC, 0.73 ± 0.45; TB, 1.06 ± 0.53; TNWM, 1.42 ± 2.48; and NWMC, 1.63 ± 0.72 (Fig 5, Table). NAA/Cho values were: TC, 0.47 ± 0.58; TB, 1.00 ± 0.15; TNWM, 1.21 ±0.95; and NWMC, 1.56 ± 1.34 (Fig 6, Table). In the same pattern, FA was lowest in the tumor center and increased towards the periphery: TC, 0.17 ± 0.15; TB, 0.23 ± 0.08; TNWM, 0.34 ± 0.09; and NWMC, 0.38 ±0.08 (Fig 7, Table).
| Patients | Control Group | |||||
|---|---|---|---|---|---|---|
| Center | Border | Surround | Contralateral | White matter | Gray matter | |
| NAA/Cr | 0.73 ± 0.45 | 1.06 ± 0.53 | 1.42 ± 2.48 | 1.63 ± 0.72 | 2.07 ± 0.51 | 1.55 ± 0.43 |
| NAA/Cho | 0.47 ± 0.58 | 1.00 ± 0.15 | 1.21 ± 0.95 | 1.56 ± 1.34 | 1.90 ± 0.36 | 1.76 ± 0.46 |
| FA | 0.17 ± 0.15 | 0.23 ± 0.08 | 0.34 ± 0.08 | 0.38 ± 0.08 | 0.44 ± 0.07 | 0.14 ± 0.04 |
Note:—NAA indicates N-acetylaspartate; Cr, creatine; Cho, choline; FA, fractional anisotropy.
Summary measurements of patients and the control group
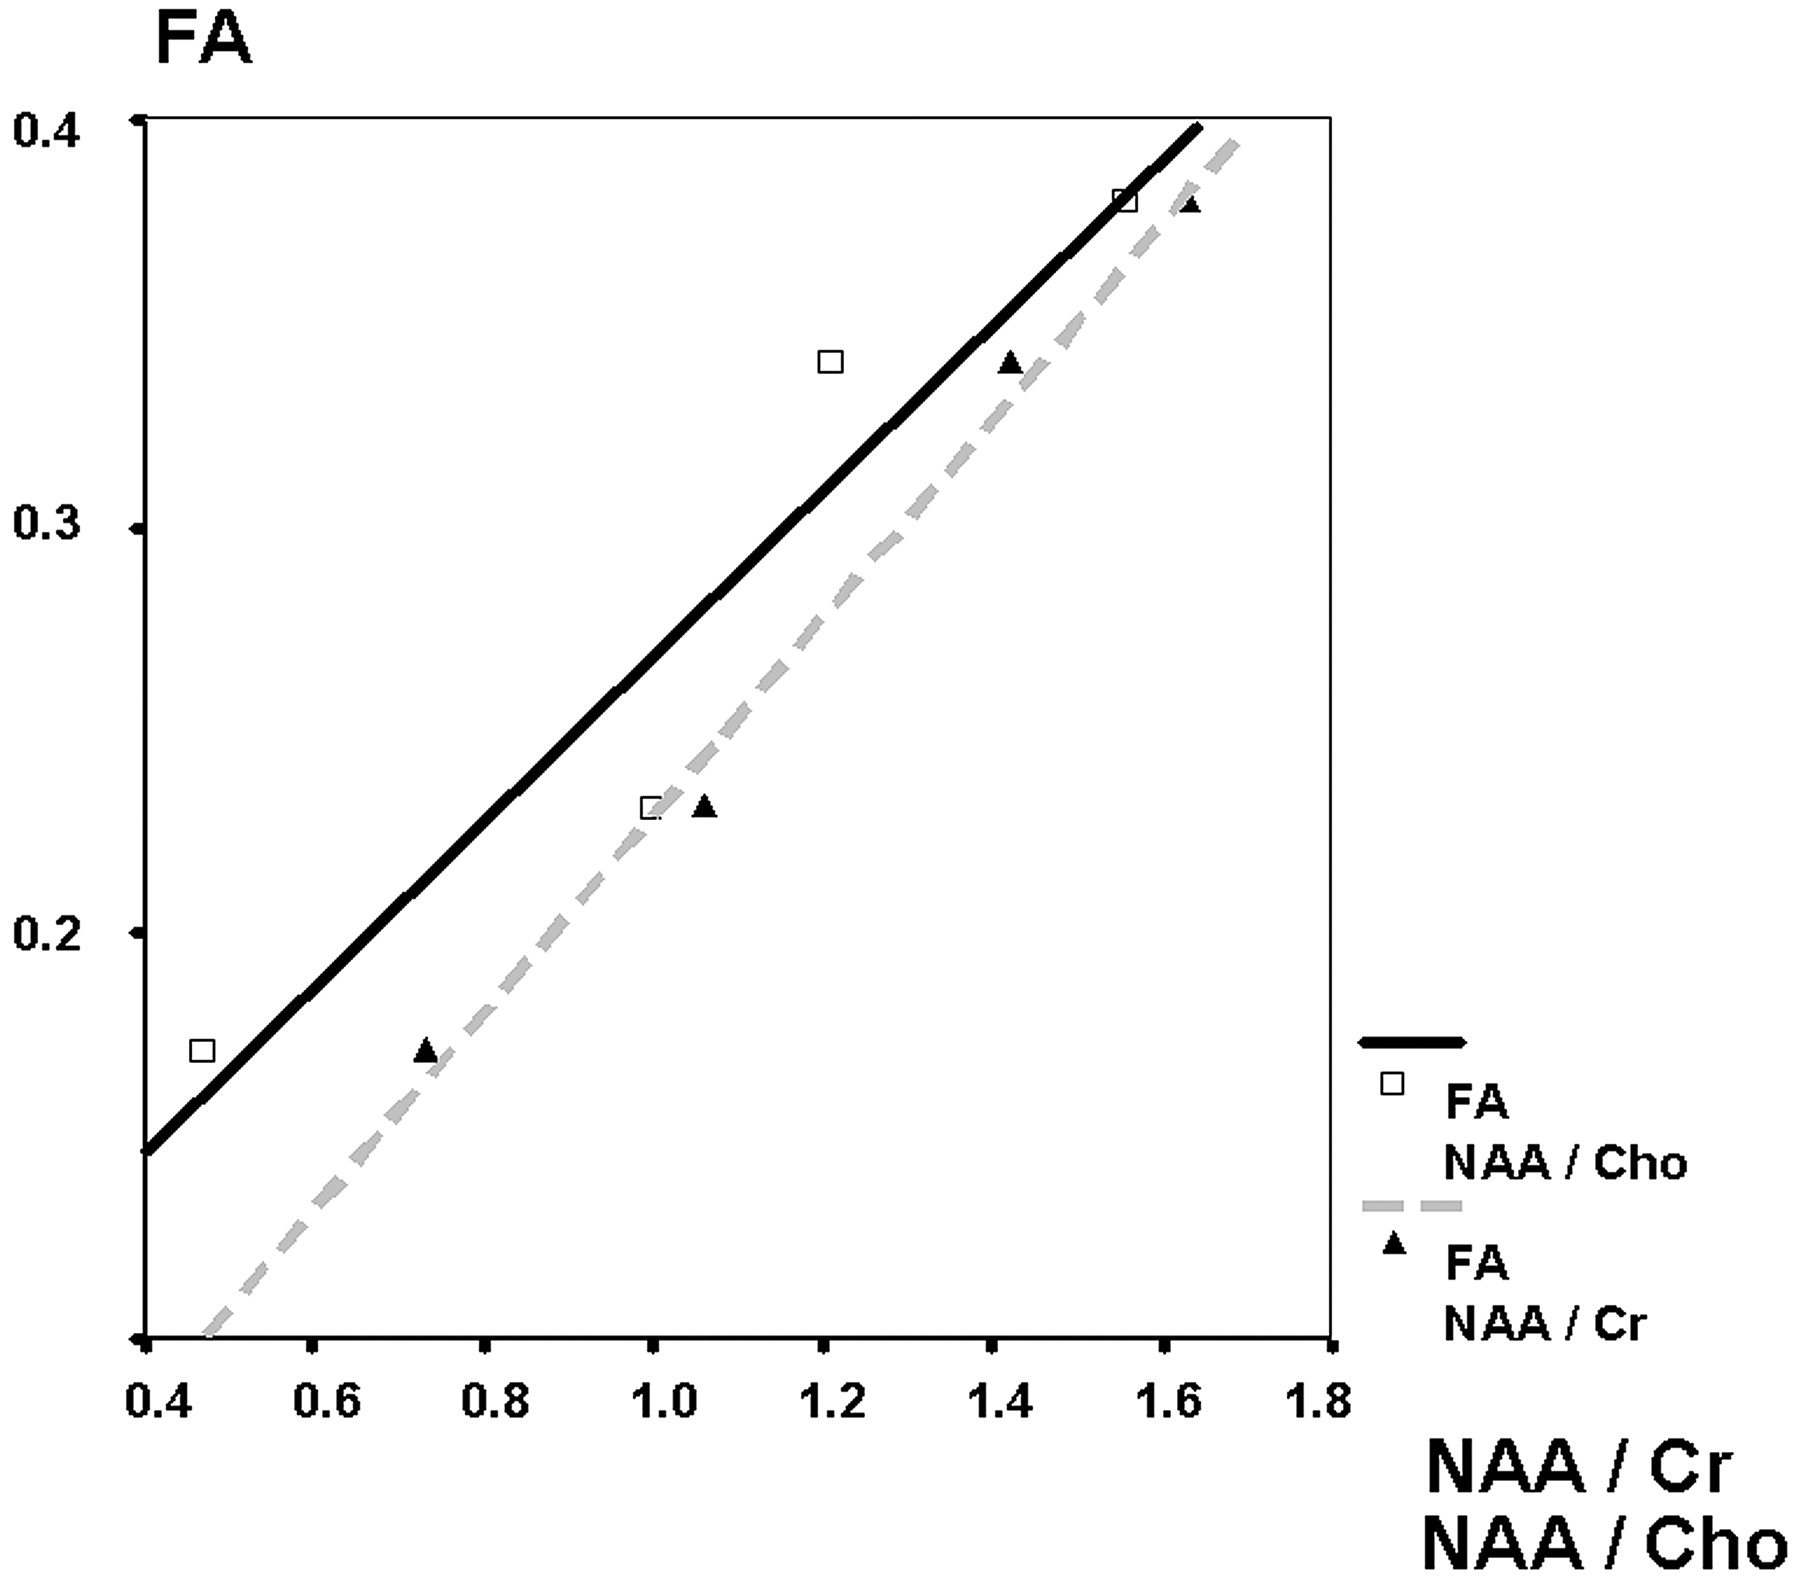
The correlation of the median reduction of the FA values and the NAA/Cr and NAA/Cho ratios was strong (r = 0.99 [NAA/Cr], 0.92 [NAA/Cho], P < .01) (Fig 3). A moderate but also highly significant correlation was found between the individual FA values of all patients matched with the NAA/Cr and NAA/Cho ratios of each individual VOI (r = 0.53 [NAA/Cr], 0.51 [NAA/Cho], P < .01) (Fig 4).

Median FA values and NAA ratios in the different volumes of interest in the patients.

Box plot of the N-acetylaspartate/creatine ratios in patients and the control group.

Box plot of the N-acetylaspartate/choline ratios in patients and the control group.
Control Group
Median NAA/Cr, NAA/Cho ratios and FA values in the gray matter of the control group were significantly lower than in the white matter (P < .01). Median NAA/Cr and NAA/Cho ratios were (white matter/gray matter): 2.07 ± 0.51/1.55 ± 0.43 [NAA/Cr], 1.90 [NAA/Cho] ± 0.36/1.76 ± 0.46 (Table).
Discussion
In an MR imaging study of 69 glioma patients, we found a continuous decline of FA (measured by DTI) and NAA (measured by 1H-MR spectroscopy) from the surrounding tissue of the tumor toward the center. The significant correlation of both changes indicates a concordant destruction without dissociation in processes of neuronal loss and decline of fiber bundles. These results resemble findings in previous studies of neurodegenerative diseases such as X-linked adrenoleukodystrophy or amyotrophic lateral sclerosis.21,22
1H-MR spectroscopy in destructive or degenerative diseases reveals a loss of NAA as a marker of reduced neuronal integrity. NAA reduction is not related to any specific cause of neuronal degeneration.23-26 The decrease of NAA-content concentration in gliomas is caused by infiltrating tumor tissue and by destruction of neurons. Creatine as a marker for energy metabolism is a constant metabolite that is not significantly altered by infiltrative or degenerative diseases despite necrotic areas. Cr is used as internal reference for semiquantitative evaluation in 1H-MR spectroscopy in many studies. Cho as a component of cellular membranes is elevated in processes with increased membrane proliferation like tumors or the developing brain and is reduced in lesions without elevated membrane turnover such as ischemic or residual demyelinated areas.27
Investigation of metabolic changes in X-linked adrenoleukodystrophy delineated a reduction of NAA and an increase in Cho in areas of active demyelination indicating reactive cell proliferation in neuronal degeneration.28 These changes were found to correlate well with alterations of the FA.22 In contrast to ALD, tumors infiltrating fiber tracts influence FA and 1H-MR spectroscopy not only by means of destruction of neurons but also by displacement and alteration of tissue metabolism. These changes concern the absolute and relative concentration of metabolites. If tumor cells would cause a directional vector of proton movement, FA would be influenced in a different way than NAA, and a correlation of FA with NAA/Cho or NAA/Cr ratios would not occur. Our results, with the very high correlation of the NAA ratios and FA values in gliomas toward the tumor periphery (Fig 6), are similar to findings in patients with ALD. Median reduction of NAA/Cho in the tumor center is slightly more accentuated than the NAA/Cr reduction, indicating a higher cellularity in the tumor center compared with the tumor periphery. The reduction of NAA/Cr is directly correlated to the reduction of the FA (r = 0.99). The correlation of the FA and the NAA/Cho reduction is very high as well (r = 0.95). The coherence of the NAA ratios and FA values suggests that the FA reduction is directly dependent on neuronal integrity in gliomas. The median degree of FA and NAA reduction in infiltrated brain tissue is not only dependent on the integrity of fiber tracts but also diminished by the percentage of tumor tissue in relation to preserved fiber tracts. No evidence can be found that tumor tissue contributes to a directional restriction of proton movement.

Box plot of the FA values in patients and the control group.

Correlation of median FA values and NAA ratios in the different volumes of interest.
Neither the NAA ratios nor the FA values seem to have superior sensitivity for the presence of tumor infiltration in the tumor border or the adjacent normal-appearing white matter. Future studies with higher spatial resolution in 1H-MR spectroscopy may evaluate this question more appropriately.
Reduction of NAA ratios and FA values indicates a quantitative decrease of neuronal structures in relation to tumor tissue. Neither method, alone or in combination, can distinguish the cause of the alteration. A deviation of fiber tracts by the tumor, diffuse infiltration, or a destruction of tracts will result in a reduction of both parameters. Compression of fiber tracts in the tumor vicinity may result in increasing FA values and NAA ratios. Our results with reduced FA values and NAA ratios in normal white matter adjacent to the tumor do not imply that deviation or compression influences the measurements in this area significantly. Deviation of fiber tracts can be visualized by DTI (fiber tracking) without quantitative assessment.29-31 Higher field strength may improve this imaging tool to visualize even disruption of fiber tracts. Perhaps a combination of FA measurements with fiber tracking, in areas where higher attenuation of fiber tracts can be visualized, may reveal the influence of compression on FA values. Studies investigating correlations of NAA ratios and FA values with immunohistopathologic findings, such as tumor cellularity and vascularity in the tumor core, and the infiltration zone may delineate an even more distinct understanding of the effects of tumor infiltration on the quantitative measurements in MR imaging. Because most of the treated tumors investigated in our study were treated by gross resection without investigation of regional differences in histologic findings, such a correlation could not be achieved in our study.
The correlation of NAA/Cr and NAA/Cho ratios with the FA values of each individual VOI was only moderate (r = 0.53 [NAA/Cr], 0.51 [NAA/Cho]). This phenomenon is related to a wide distribution of FA values in relation to the NAA ratios, indicating that a high NAA ratio does not imply high FA values in white matter (Fig 7). The extensive variance of FA values was present even in the normal white matter of the control subjects and has been shown by previous studies.11,14,32 Significant lower FA values and NAA ratios were found in gray matter than in white matter in the control group. Because of certain gray matter partial volume effects in contralateral regions of interest in patients, median FA values and NAA ratios of the patients’ contralateral hemisphere could be lower than in the control group. The patients’ spectroscopy was optimized to fit the tumor volume, and the white matter of the contralateral hemisphere was investigated in the contralateral side of the same spectroscopic matrix. In some cases, “contamination” with small volumes of gray matter could not be avoided. In every case, the VOIs were strictly positioned in brain tissue to prevent contamination with CSF. In this study, the FA and NAA values were obtained from identical VOIs. The influence of gray matter, which leads to a reduction of FA and NAA, induced the same trend for both parameters in the NWMC. The influence of gray matter on FA values is higher than on the NAA ratios because of a more distinct difference between the values of gray and white matter measured in the control group. Nevertheless, the median reduction of the obtained values in the VOIs in the contralateral hemisphere is influenced by a similar amount for all parameters (Figs 3–5).

Distribution of individual FA values of the patients in relation to the corresponding NAA ratios.
Conclusions
We observed a continuous decline of FA and NAA from the surrounding tissue of the tumor toward the center. To the extent possible without regional subsampling of tissue pathology, these MR parameters indicate unequivocal disarrangement and replacement of neuronal structures. MR spectroscopy and FA quantitatively describe a reduction of axons in the investigated tumor tissue that can be related to neuronal degeneration or relative decrease of neurons in relation to tumor tissue. In general, tumor tissue does not imply a directional restriction of proton movement.
Footnotes
Presented in part as a poster at the 30th Congress of the European Society of Neuroradiology (ESNR); September 15–18, 2005, Barcelona, Spain.
References
- Received August 17, 2005.
- Accepted after revision November 16, 2005.
- Copyright © American Society of Neuroradiology
In this issue


Jump to section
Related Articles
Cited By...
- Associating IDH and TERT Mutations in Glioma with Diffusion Anisotropy in Normal-Appearing White Matter
- Associating IDH and TERT Mutations in Glioma with Diffusion Anisotropy in Normal-Appearing White Matter
- Pushing the Limits of Glioma Resection Using Electrophysiologic Brain Mapping
- A change in the apparent diffusion coefficient after treatment with bevacizumab is associated with decreased survival in patients with recurrent glioblastoma multiforme
- Diffusion Tensor MR Imaging of Cerebral Gliomas: Evaluating Fractional Anisotropy Characteristics