
Abstract
BACKGROUND AND PURPOSE: Although brain MR imaging findings in adult Wilson disease have been described in considerable detail, a paucity of information currently exists regarding brain MR imaging findings in pediatric Wilson disease. The purpose of this study was to analyze the brain MR imaging findings in Wilson disease of childhood at the initial stage and during follow-up after treatment and to correlate these observations with clinical response.
METHODS: We evaluated 50 patients with pediatric Wilson disease. Fifty initial and 20 follow-up MR images from 15 patients following penicillamine treatment were analyzed retrospectively, and the data were correlated with clinical findings.
RESULTS: Patients were categorized into 3 groups on the basis of initial MR imaging findings. Group I (n = 23) showed normal MR imaging findings. Group II (n = 15) was characterized by T1-weighted images with increased signal intensity in the globus pallidus (n = 15, 100%) followed by the putamen, midbrain, and caudate nucleus. Group III (n = 12) demonstrated T2-weighted images with increased signal intensity in the putamen (n = 10, 83%), followed by the caudate nucleus, globus pallidus, thalamus, midbrain, and pons. There was a significant difference in mean age, the presence of neurologic symptoms, and Child-Pugh classification among the 3 groups (P < .001). Following copper chelating therapy, the changes on follow-up MR imaging were strongly correlated with clinical response to treatment (P < .001).
CONCLUSION: Brain MR imaging in children with Wilson disease can be categorized into distinct groups and demonstrated a significant correlation with clinical findings. Interval changes on follow-up MR imaging were also closely correlated with clinical findings and helpful in assessing the clinical response.
Wilson disease is an uncommon, autosomal recessive, inborn defect in copper metabolism characterized by abnormal accumulation of copper in various tissues, particularly in the liver and the brain. Although the precise etiology of this disease is currently unknown, the accumulation of copper is postulated to involve aberrant intrahepatic processing of ceruloplasmin. Such defects would result in a protease-resistant form of ceruloplasmin to be secreted into the blood and also excreted into the bile.1 The neurologic symptoms associated with Wilson disease are assumed to be secondary to accumulation of cerebral copper at levels sufficient to destroy nerve cells.2,3 The most common initial MR imaging abnormality among patients with Wilson disease is the occurrence of high T1 signal intensity in the globus pallidus, putamen, and mesencephalon in association with hepatic dysfunction or high T2 signal intensity in the striatum among patients with neurologic symptoms.2–10 Although the MR imaging findings of the brain in patients with adult Wilson disease are relatively well described, only isolated cases have been reported that illustrate the MR imaging findings of the brain in Wilson disease of childhood.11,12 Furthermore, the correlation between MR imaging and clinical findings and the significance of changes observed in follow-up MR imaging have not been thoroughly described.13–15 The purpose of this study was to analyze the MR imaging findings of the brain in Wilson disease in children, both at the initial stage and during post-treatment follow-up and to correlate MR imaging results with clinical observations.
Methods
The study population comprised 50 patients with Wilson disease (26 male and 24 female). The diagnosis of Wilson disease was based on a combination of neurologic symptoms, the presence of the Kayser-Fleischer ring, low serum ceruloplasmin, elevated urinary copper excretion, and liver biopsy.16 The mean age of the patients was 10.2 years (age range, 3–16 years). Kayser-Fleischer rings were present in 13 patients. Seventeen patients were neurologically symptomatic, and 33 patients were asymptomatic, including 6 asymptomatic siblings detected during family screening. Twenty-seven patients presented with abnormal liver function and no neurologic symptoms. All patients had been treated with the chelator D-penicillamine or trientine, subsequent to the diagnosis of Wilson disease. The same physician (J.K.S.) who was blinded to the MR imaging findings performed neurologic examinations in all patients before and after treatment. In patients with follow-up studies, the clinical response was assessed as improved, stable, or progressed by indicators of hepatic dysfunction and the presence of neurologic symptoms such as dysarthria, tremor, dystonia, seizure, chorea, and psychiatric disturbance.
In all 50 patients, MR imaging was performed at the time of diagnosis. Twenty follow-up MR images were obtained in 15 patients, with 4–63 month intervals after the initial study (mean, 33.5 months). Spin-echo MR images were obtained on a 2T unit (n = 16), a 1.5T unit (n = 34), and a 1T unit (n = 20). T1-weighted (TR/TE, 500–600/12) and T2-weighted (TR/TE, 3500–5000/100) axial images and T1-weighted sagittal images were obtained. The section thickness and intersection gap were 5 and 2 mm, respectively. The acquisition matrix was 256 × 256, with a spatial resolution of 1 × 1 mm. All MR images were retrospectively evaluated by 2 radiologists (T.J.K., I.O.K.), who were blinded to the results of the clinical examination. In case of disagreement, a consensus was obtained. Particular attention was paid to the change in signal intensity in the putamen, caudate nucleus, midbrain, globus pallidus, and pons. In follow-up examinations, the interval change of previously noted signal intensity abnormalities and the presence of new lesions were evaluated.
Patients were classified into 3 groups according to the signal-intensity abnormality on MR images. Patients within group I presented with normal MR imaging findings, those within group II had abnormal high signal intensity on T1-weighted images, and those within group III had abnormal high signal intensity on T2-weighted images. MR imaging findings of each group were correlated with hepatic dysfunction and neurologic symptoms. Child-Pugh classification, which was based on 5 variables including hepatic encephalopathy, ascites, bilirubin, albumin, and prothrombin time, was used as a disease-severity index for hepatic dysfunction.17 Among patients with follow-up studies, the clinical response was categorized as either improved, stable, or progressed. “Improved” was defined as >50% decrease or disappearance of the lesions without a new lesion, “progressed” was defined as an increase of the lesions or appearance of a new lesion, and “stable” was defined by a qualitative lack of improvement or deterioration. The changes were subsequently correlated with clinical response to treatment.
The Kruskal-Wallis test was used to assess the statistical difference of the mean age among each group. The Fisher exact and Mantel-Haenszel χ2 tests were used to determine the statistical differences in neurologic symptoms and Child-Pugh classification among each group. Kendall’s tau-b was used to assess the statistical significance of correlation between the changes on follow-up MR imaging and clinical response to treatment. Statistical significance was assigned to any P value <.05.
Results
Initial and Follow-Up Imaging Findings
Patients were categorized into 3 groups according to the initial MR imaging findings. Group I consisted of 23 patients with normal MR imaging findings, group II consisted of 15 patients with abnormally high signal intensity on T1-weighted images (Figs 1 and 3), and group III consisted of 12 patients with abnormally high signal intensity on T2-weighted images (Figs 2, 4, and 5). The mean ages of groups I, II, and III were 8.5, 10.9, and 12.6 years, respectively. There was a significant difference in mean age among the 3 groups (P < .01). Among the patients in group II, the high signal intensity abnormality on T1-weighted images showed bilateral and symmetric distribution. The signal intensity abnormality sites of involvements were the globus pallidus (n = 15, 100%), putamen (n = 6, 40%), midbrain (n = 6, 40%), and caudate nucleus (n = 1, 7%). The lesions showed no signal intensity abnormality on T2-weighted images. MR images of patients in group III showed increased signal intensity on T2-weighted images in the putamen (n = 10, 83%), caudate nucleus (n = 8, 67%), globus pallidus (n = 7, 58%), thalamus (n = 6, 50%), midbrain (n = 5, 42%) and pons (n = 1, 8%). All the lesions noted on T2-weighted images showed hypo- to isointensity relative to cerebral cortex on T1-weighted images. None of the lesions showed high signal intensity on T1-weighted images. All the lesions showed bilateral and symmetric involvement. Five patients in group III showed very low signal intensity in the globus pallidus surrounded by high signal intensity on T2-weighted images (Fig 2).

Wilson disease in a 13-year-old boy with abdominal distention.
A and B, T1-weighted axial MR images show bilateral increased signal intensity in the globus pallidus (arrows) and midbrain (arrowhead).

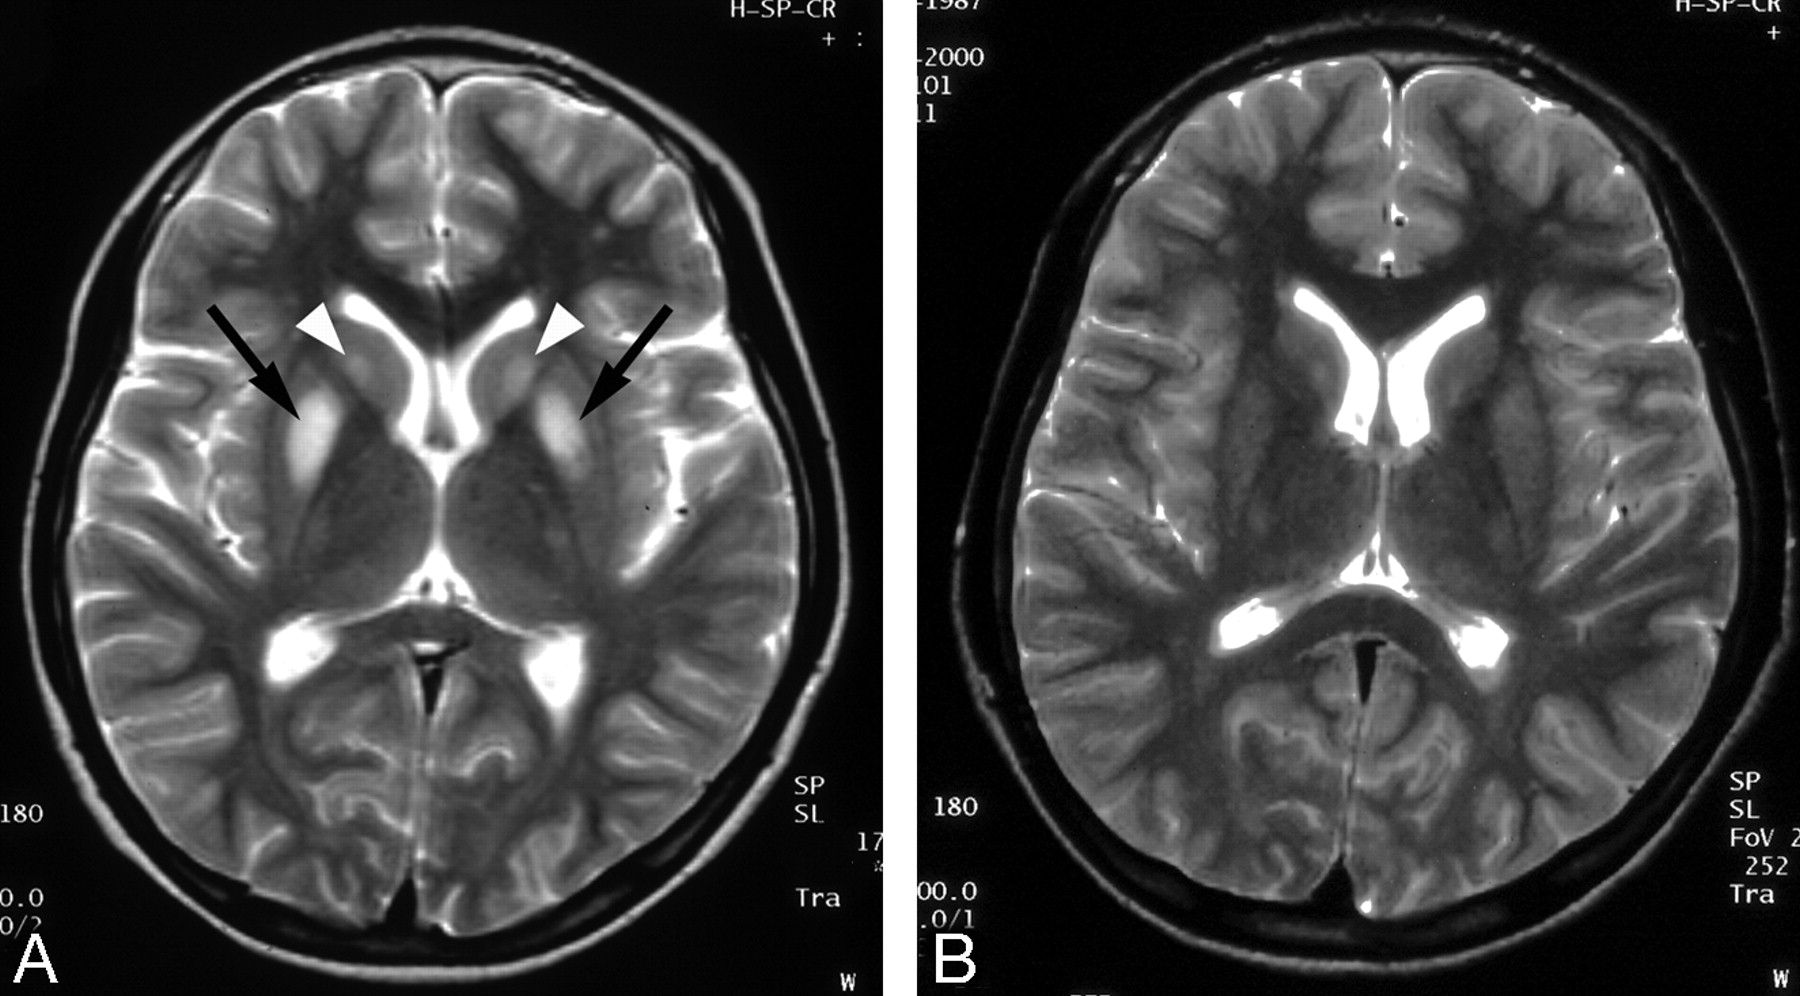
High-signal-intensity lesions on T2-weighted MR images.
A, Wilson disease in a 12-year-old girl with dysarthria. T2-weighted axial MR image shows bilateral high signal intensity with central dark signal intensity in the putamen (arrows) and caudate nuclei (arrowheads).
B, Wilson disease in a 13-year-old girl with dysarthria. T2-weighted axial MR image shows bilateral symmetric high signal intensity in the putamen (black arrows) and caudate nuclei (white arrows). Slightly increased signal intensity in both thalami (black arrowheads) and globus pallidi (white arrowheads) is also noted.
Follow-up MR imaging was performed in 15 patients, depending on the changes in the patient’s symptoms or the patient’s own request. On follow-up MR imaging after treatment, all patients within group I (n = 4) showed normal MR imaging findings, and all patients in group II (n = 2) showed more signal intensity in the involved area on T1-weighted images (Fig 3). In group III (n = 9), 6 patients showed improvement on MR imaging findings (Fig 4), 2 patients showed no interval changes, and only 1 patient showed deterioration on MR imaging findings (Fig 5). In 4 of the 6 patients with radiologically improved findings, follow-up MR imaging demonstrated no residual lesion (Fig 4). In 4 of the 5 patients with very low signal intensity in the globus pallidus surrounded by high signal intensity on T2-weighted images, 3 patients showed improvement and 1 showed increased extent of the low signal intensity.

Wilson disease in an 11-year-old girl with abnormal findings on a liver function test.
A, Initial T1-weighted axial MR image shows a subtle increased signal intensity in both globus pallidi (arrows).
B, Follow-up T1-weighted axial MR image obtained after 5 years shows increased extent of the lesion (arrows). Patient’s Child-Pugh class was Child C, despite adequate penicillamine therapy, and she had intractable ascites and a bleeding tendency.

Wilson disease in a 14-year-old girl with dysarthria.
A, Initial T2-weighted axial MR image shows increased signal intensity in both caudate nuclei (arrowheads) and putamen (arrows).
B, Follow-up T2-weighted axial MR image obtained after 3 years shows complete resolution of the lesions. Patient’s neurologic symptoms were also improved.

Wilson disease in a 14-year-old girl with dystonia.
A, Initial T2-weighted axial MR image shows increased signal intensity in both caudate nuclei (arrowheads) and putamen (arrows).
B and C, Follow-up T2-weighted axial MR images obtained after 3 years show aggravated lesions, especially in the thalamus (white arrows) and midbrain (arrowheads). Clinically, the patient’s neurologic symptoms, including dystonia, were deteriorated, despite adequate treatment.
Correlation of MR Imaging and Clinical Findings
Neurologic symptoms were present in 17 patients, with 5 of the 27 patients in groups II and III presenting both neurologic symptoms and hepatic dysfunction. In neurologically symptomatic patients, dysarthria was the most common symptom, followed by tremor, dystonia, seizure, chorea, and psychiatric disturbance. Four of the 23 patients and 2 of the 15 patients in groups I and II, respectively, presented with neurologic symptoms. In contrast, 11 of the 12 patients in group III had identifiable neurologic symptoms. There were statistically significant differences in the presence of neurologic symptoms between groups I and III (P < .001) and groups II and III (P < .001), but no significant difference, between groups I and II (P = 1.0) (Table 1), which suggests a close relationship between group III and neurologic symptoms compared with other groups.
Correlations between initial MR imaging and clinical findings
On the basis of Child-Pugh classification, 50 patients were divided into 3 classes, and the results are also summarized in Table 1. Hepatic dysfunction was found in 27 patients, and their Child-Pugh classifications were as follows: A (n = 4), B (n = 7), and C (n = 16). Twelve of 15 patients in group II were assessed as Child class C, representing poor hepatic function. In contrast, 9 of 12 patients in group III were categorized as Child class A, and none were Child class C. There were statistically significant differences in Child-Pugh classifications between groups I and II (P < .001) and groups II and III (P < .001), but no significant difference between groups I and III (P = .452) (Table 1), suggesting a close relationship between group II and poor hepatic function relative to the other groups.
The changes on follow-up MR imaging are summarized in Table 2. Four asymptomatic siblings within group I showed normal MR imaging findings on follow-up study, and they revealed neither neurologic symptoms nor abnormal findings on liver function tests. Two patients within group II showed increased extent of high-signal-intensity lesions on T1-weighted images, increased amount of ascites, and aggravated liver function. Within group III, 5 patients showed improvement of both MR imaging findings and neurologic symptoms, and 1 showed improvement of MR imaging findings without change of neurologic symptoms. Two patients showed no change of either neurologic symptoms or MR imaging findings, and 1 patient with aggravated MR imaging findings showed deterioration of neurologic symptoms. Interval changes seen on follow-up MR imaging were strongly correlated with clinical response to treatment in most patients and were statistically significant (Kendall tau-b, 0.755; P < .001) (Table 3).
MR signal changes on follow-up MR imaging
Correlation between follow-up and MR imaging and clinical response to treatment
Discussion
Pathologic changes to the central nervous system in Wilson disease are always associated with a significant increase of tissue copper content. Excess copper may combine with sulfhydryl, carboxyl, or amine groups, resulting in improper enzymatic activity or damage to cellular structure.18 Despite the ubiquitous presence of toxic copper within the brain, pathologic findings are limited primarily to the basal ganglia, thalamus, and brain stem. Histopathologic studies have shown abnormalities throughout this system in patients with Wilson disease. These abnormalities include atrophy, spongy softening, cavitation, a general reduction of neurons, increased cellularity, and the presence of Opalski cells.19 The pathologic changes are presumed to result from an increased amount of extracellular copper, which causes oxidative stress and results in cell destruction.20–22
In previous reports, the most frequently identified abnormality on MR imaging was bilateral symmetric high signal intensity in the putamen on T2-weighted images.2–13 In the absence of comparative neuropathologic MR imaging studies, the nature of high-signal-intensity lesions remains speculative. According to the previous literature regarding the neuropathologic findings of Wilson disease, the high-signal-intensity lesions on T2-weighted images can be caused by edema, gliosis, demyelinization, neuronal necrosis, or cystic degeneration, and some of the lesions showed reversible changes following copper chelating treatment.11,15,23 In our study, 6 of the 9 patients showed reversion of the high-signal-intensity lesions on T2-weighted images after therapy; thus, we suspect that they originated from focal gliosis or edema (Fig 4).
In our study, high-signal-intensity lesions on T2-weighted images were most frequently located in the putamen (n = 10, 83%), followed by the caudate nucleus (n = 8, 67%), globus pallidus (n = 7, 58%), thalamus (n = 6, 50%), midbrain (n = 5, 42%), and pons (n = 1, 8%) (Figs 2, 4, and 5). In comparison with previous studies conducted primarily in adult subjects,5,7,8 our result differs from those that revealed a relatively higher frequency of white matter abnormalities. In addition, although Grimm et al24 reported that quantifiable brain atrophy on MR imaging was evident in 68% of neurologically symptomatic patients, we could not find such abnormalities in our studies. Diffuse brain atrophy suggests a generalized susceptibility and longstanding effect of the central nervous system to copper intoxication. In our opinion, the shorter duration of illness and younger age of the patients in our study could be a possible explanation for the previously mentioned differences.
In our study, 5 patients showed dark signal intensity in the globus pallidus, putamen, or caudate nucleus, surrounded by peripheral high signal intensity on T2-weighted images. The globus pallidus and pars reticularis of the substantia nigra are the 2 sites of preferential iron accumulation. It has been reported that the phagocytes containing iron pigment were commonly seen in the globus pallidus and substantia nigra in Wilson disease.5,19,25 On the basis of the aforementioned data, the central low-signal-intensity areas on T2-weighted images (Fig 2) were explained as the result of increased iron deposition in the areas with accumulation of copper. However, our results suggest that the reversible process of copper metabolism can be a possible explanation for the reversibility of hypointensity after copper chelating therapy, as evidenced by the 3 patients who experienced clinical improvement.
In the 15 patients (group II), we found bilateral T1 hyperintensity in the globus pallidus (n = 15, 100%), putamen (n = 6, 40%), midbrain (n = 6, 40%), and pons (n = 1, 7%) (Figs 1 and 3). The lesions showed no signal-intensity abnormality on T2-weighted images. The cause of hyperintensity in T1-weighted images remains elusive. It has previously been suggested that these abnormalities result from the toxic effect of copper overload in the brain and indirectly from liver failure as a result of copper intoxication.4,8,9 Although 2 patients within group II showed deterioration of MR imaging findings despite the treatment, Kozic et al10 suggested that 1 hyperintensity might be reversible during the course of chronic chelating therapy.
Correlation between neurologic symptoms and MR imaging findings revealed inconsistencies with some previous reports.2–4,6–8,13,23 In our study, 11 of the 12 patients within group III had neurologic symptoms, whereas only 2 of the 15 patients within group II and 4 of the 23 patients within group I had neurologic symptoms. These results strongly suggest a close relationship between the abnormal hyperintensity on T2-weighted images and the high prevalence of neurologic symptoms. Although the sample number is small, 4 patients within group I and 2 patients within group II presented with neurologic symptoms without accompanying abnormal hyperintensity on T2-weighted images. This observation could possibly be ascribed to biochemical changes associated with functional alteration that may precede morphologic changes detectable by MR imaging.
There were statistically significant differences in Child-Pugh classifications among the 3 groups. Although 12 of 15 patients within group II (80%) were classified as Child class C, representing poor hepatic function, no patients within group III were categorized as Child class C. Among the 12 patients within group III, 9 were classified as Child class A. This result suggests a close relationship between abnormal hyperintensity on T1-weighted images and poor hepatic function. Abnormal hyperintensity on T1-weighted images in the globus pallidus, putamen, midbrain, and pons is characteristic of chronic hepatocellular dysfunction.26,27 In our study, we found similar distribution of hyperintensity on T1-weighted images, which did not differ from those of non-Wilsonian hepatic dysfunction.
Clinically, Wilson disease usually presents with hepatic, neurologic, or psychiatric manifestations or with some combination thereof.28 The results of our study are in accordance with these general observations. We observed a significant difference in mean age among 3 groups. The explanation is that the liver must first become saturated with copper before copper diffuses into other organs,29 and this process may account for the mean age difference among the 3 groups. Six asymptomatic siblings included in group I also might be another explanation. The incidence of combined neurologic and hepatic presentation was low in our study. Contrary to general expectations, no patient within group III showed poor hepatic function. In addition, only 5 of 27 patients in groups II and III presented with simultaneous neurologic symptoms and hepatic dysfunction. These findings are in accordance with the report of Kozic et al,10 in which none of the 16 patients with hepatic presentation showed abnormal hyperintensity on T2-weighted images. These findings suggest that there are 2 distinct clinical presentations in Wilson disease, neurologic and hepatic.
In previous reports, follow-up studies with MR imaging and CT demonstrated variable imaging findings.2,3,7,11–13 Although several studies showed no relationship between neurologic symptoms and changes seen on follow-up imaging,2,5,7 many of these studies had limitations, such as short follow-up period or small patient samples. Alternately, other reports have demonstrated a significant correlation between clinical course and follow-up MR imaging. 3,13–15,30–32 Thöumas et al3 reported a correlation between MR imaging findings and clinical findings in all 5 patients examined, and Roh et al13 also described a close correlation between clinical course and follow-up MR imaging findings in 94% of 16 patients. In our study, we also found a good correlation between changes seen on follow-up MR imaging and clinical response to treatment. Nine of 15 patients showed changes in MR imaging on follow-up examination, with 6 presenting with improvement and 3 presenting with progression (Table 2). Thus, despite the relatively small sample size, our results indicate that follow-up MR imaging studies may be useful for documenting the effect of treatment.
Our study had several limitations. First, it was a retrospective study. Second, there was the relatively small number of patients with follow-up imaging; thus, there might be a selection bias in follow-up imaging.
Conclusion
MR imaging findings of the brain in children with Wilson disease can be categorized into distinct groups. High-signal-intensity lesions in the basal ganglia on T1-weighted images reflected hepatic involvement of Wilson disease—namely, chronic liver disease or liver cirrhosis. High-signal-intensity lesions on T2-weighted images reflected cerebral involvement of Wilson disease and showed a good correlation with neurologic symptoms. Interval changes seen on follow-up MR imaging revealed a close correlation with clinical findings, and can be helpful in assessing the clinical response to treatment of patients with Wilson disease.
Acknowledgments
We thank Jeong-Soo Park for assistance in manuscript preparation and Seong Ho Park for statistical consultation.
References
- Received June 27, 2005.
- Accepted after revision October 17, 2005.
- Copyright © American Society of Neuroradiology


