
Abstract
BACKGROUND AND PURPOSE: Even though glioblastoma (GB) and brain metastases (BM) can be differentiated using radiomics, it remains unclear if the model performance may vary based on the contrast-enhanced sequence used. Our aim was to evaluate the radiomics-based model performance for differentiation between GB and brain metastases BM using MPRAGE and volumetric interpolated breath-hold examination (VIBE) T1-contrast-enhanced sequence.
MATERIALS AND METHODS: T1 contrast-enhanced (T1-CE) MPRAGE and VIBE sequences acquired in 108 patients (31 GBs and 77 BM) during the same MRI session were retrospectively evaluated. After standardized image preprocessing and segmentation, radiomics features were extracted from necrotic and enhancing tumor components. Pearson correlation analysis of radiomics features from tumor subcomponents was also performed. A total of 90 machine learning pipelines were evaluated using a 5-fold cross-validation. Performance was measured by mean area under the curve (AUC)-receiver operating characteristic (ROC), log loss, and Brier scores.
RESULTS: A feature-wise comparison showed that the radiomics features between sequences were strongly correlated, with the highest correlation for shape-based features. The mean AUC across the top 10 pipelines ranged between 0.851 and 0.890 with T1-CE MPRAGE and between 0.869 and 0.907 with the T1-CE VIBE sequence. The top-performing models for the MPRAGE sequence commonly used support vector machines, while those for the VIBE sequence used either support vector machines or random forest. Common feature-reduction methods for top-performing models included linear combination filter and least absolute shrinkage and selection operator for both sequences. For the same machine learning feature-reduction pipeline, model performances were comparable (AUC-ROC difference range, –0.078–0.046).
CONCLUSIONS: Radiomics features derived from T1-CE MPRAGE and VIBE sequences are strongly correlated and may have similar overall classification performance for differentiating GB from BM.
ABBREVIATIONS:
- AUC
- area under the curve
- BM
- brain metastases
- GB
- glioblastoma
- LASSO
- least absolute shrinkage and selection operator
- linComb
- linear combinations filter
- ML
- machine learning
- MRMR
- minimum-redundancy maximum-relevance
- NIfTI
- Neuroimaging Informatics Technology Initiative
- RF
- random forest
- ROC
- receiver operating characteristic curve
- SUSAN
- Smallest Univalue Segment Assimilating Nucleus
- SVM
- support vector machine
- T1-CE
- T1 contrast-enhanced sequence
- VIBE
- volumetric interpolated breath-hold examination
SUMMARY
PREVIOUS LITERATURE:
Radiomics-based differentiation of GB and BM is feasible. However, it is uncertain how well the radiomics features derived from different T1-CE sequences correlate or whether such differences impact eventual model performance.
KEY FINDINGS:
We found that radiomics features derived from T1-CE MPRAGE and VIBE sequences showed moderate-to-strong correlation and comparable performances across multiple machine learning pipelines.
KNOWLEDGE ADVANCEMENT:
Despite differences in acquisition parameters, comparable model performance from different T1-CE sequences is feasible. These findings may imply that conformity to a certain postcontrast sequence may be less restrictive in a multi-institutional setting.
Glioblastoma (GB) and brain metastases (BM) account for most malignant brain tumors. Gliomas account for about 81% of primary malignant brain tumors, with GB being the most common (57.3%). BM, on the other hand, are the most common secondary malignant brain neoplasm. GB and BM have an annual age-adjusted incidence of 3.22 and 10 per 100,000 persons, respectively.1,2 Even though both entities have different therapeutic and prognostic implications and may be differentiated on the basis of conventional and advanced MRI techniques, accurate diagnosis may be challenging in cases with solitary metastasis or multifocal/multicentric glioma, both of which are not uncommon.3⇓-5
Multiple prior radiomics-based studies have shown promising results for differentiating these entities.2,6 However, the impact on classification performance of models derived from different contrast-enhanced sequences for the same lesions remains unclear. It is also unclear if, and to what degree, the radiomics features from different contrast-enhanced sequences correlate for the same lesion. This issue is relevant because postcontrast T1 sequences may vary between institutions, with the commonly used sequences being 2D T1-spin-echo, 3D MPRAGE, volumetric interpolated breath-hold examination (VIBE), or variable flip angle refocusing pulse, fast spin-echo sequences such as sampling perfection with application-optimized contrasts by using different flip angle evolutions (SPACE; Siemens), Cube (GE Healthcare), or volume isotropic turbo spin-echo acquisition (VISTA; Philips Healthcare).7,8
In the clinical setting, T1 contrast-enhanced sequences (T1-CE) are invariably performed in patients with brain lesions, either for treatment-planning, response assessment, surgical navigation, or stereotactic radiosurgery. The variability between the used postcontrast sequences and uncertainty about their impact on model classification performance can be a hindrance to multisite collaborations. This issue is important for a several reasons: First, if radiomics from any sequence is clearly superior for classification performance, it would seem reasonable to use it on a wider scale prospectively for tumor classification. On the other hand, if different sequences show similar classification performance and are strongly correlated, this result may imply that conformity to a certain postcontrast sequence may be less restrictive in a multi-institutional setting.
The MPRAGE sequence emphasizes gray-white matter contrast due to the inversion recovery preparation pulse and is often used in brain tumor clinical trials. The VIBE sequence, on the other hand, lacks an inversion recovery pulse but has higher demonstrated sensitivity to enhancing lesions.7 The aim of the current exploratory study was to determine whether the different radiomics features derived from these postcontrast sequences correlate and whether such correlation translates into similar model performance for differentiating between BM and GB using multiple machine learning (ML) pipelines post-uniform image preprocessing.
MATERIALS AND METHODS
All procedures performed in the studies involving human participants were in accordance with the ethical standards of the institutional and/or national research committee and with the 1964 Helsinki Declaration and its later amendments or comparable ethical standards.
Data Collection
The study was approved by the local institutional board and informed consent was waived, given the retrospective nature of the study. Using the DICOM header search functionality, the PACS database was searched for studies in which both MPRAGE and VIBE sequences were acquired during the same session. Studies were sought between January 2016 and November 2021. A total of 288 patients were identified. Of these, cases were excluded after chart and imaging review for the following reasons: 1) patients with any diagnosis other than BM or GB (n = 90); 2) lesions previously biopsied or treated with surgery or radiation therapy (n = 50); 3) nonenhancing lesions or lesions with <1 cm of enhancement as demonstrated in either or both MPRAGE and VIBE sequences (n = 27); 4) images obtained without contrast (n = 6); and 5) the presence of artifacts impairing accurate image interpretation (n = 7). This process yielded a total of 108 subjects (GB = 31, BM = 77) who were further studied. All cases were pathologically-proved, either as GB or as BM. The underlying primary malignancy in BM cases is listed in Table 1.
Demographic and clinical information of the patient cohorts
Image Acquisition
Images were acquired on either a 1.5T Avanto or Aera or a 3T Magnetom Skyra scanner (Siemens). The sequence parameters of the 2 sequences on the various scanners on which the patients were scanned are provided in the Online Supplemental Data. All patients had MPRAGE and VIBE sequences performed in the same session in succession. T1-CE VIBE was acquired first for 22 patients, and MPRAGE was acquired first for 86 patients. In general, the T1-CE VIBE duration was between 4 and 5 minutes, and T1-CE MPRAGE duration was between 5 and 6 minutes. The median time difference between the 2 acquisitions was 4.77 minutes. A gadobutrol (Gadavist; Bayer Schering Pharma) injection at a dose of 0.01 mmol/Kg body weight was used in all cases.
Image Processing
The overall study workflow is depicted in Fig 1. After deidentification and Neuroimaging Informatics Technology Initiative (NIfTI) conversion, MPRAGE and VIBE images were preprocessed using a series of image-processing steps. All sequences were first resampled to a voxel size of 1 × 1 × 1 mm3 and registered to MPRAGE images using a rigid transformation. Then, the Smallest Univalue Segment Assimilating Nucleus (SUSAN) denoising technique was used to suppress the effects of noisy high-frequency features from the images.9 Following those steps, the image intensities were min-max normalized to 0-255. The resampling, intrasubject registration, and normalization steps were implemented using ANTsPy Version 0.2.9 (https://pypi.org/project/antspyx/), a python library that wraps the C++ biomedical image-processing library Advanced Normalization Tools (ANTs; http://stnava.github.io/ANTs/).10 The neuroimaging in python (Nipype) package, Version 1.7.0 (https://nipype.readthedocs.io/en/latest/api/generated/nipype.html) provides an interface to an FMRIB Software Library implementation of the SUSAN denoising method.11⇓⇓-14

Schematic depicting the overall study workflow.
Tumor Segmentation
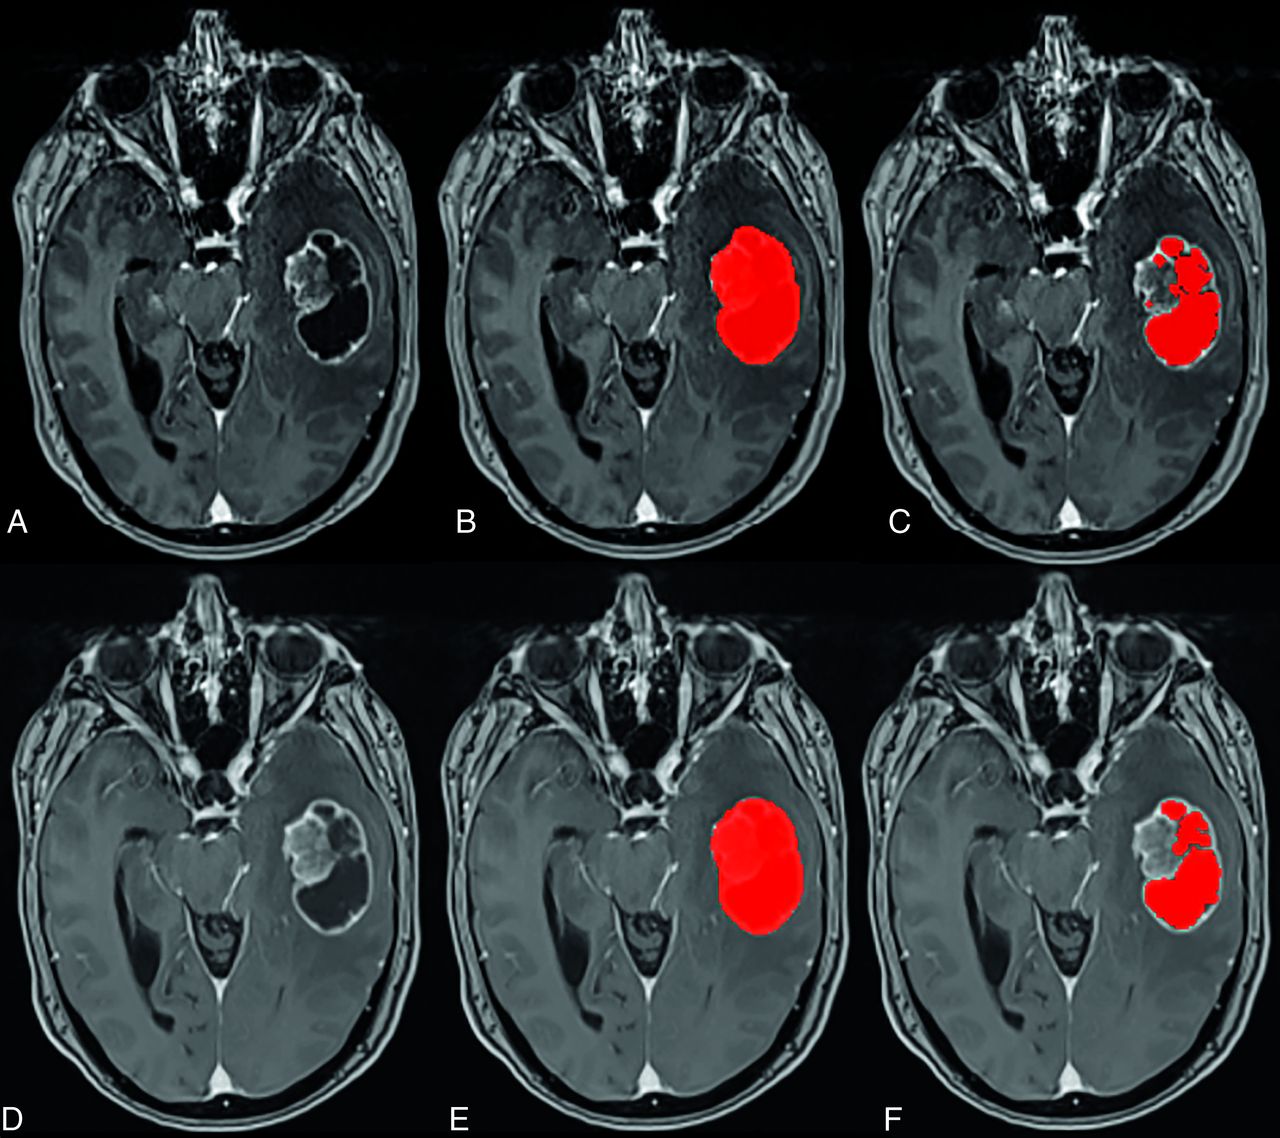
3D-segmentation of the tumor was performed using Layered Optimal Graph Image Segmentation for Multiple Objects and Surfaces (LOGISMOS) software.15 In case of multiple lesions, only the largest lesion was segmented. For each segmented lesion, we created 2 masks: 1) a whole-tumor mask, consisting of both the solid and necrotic components; and 2) a necrotic mask, consisting of only the necrotic component. The mask for only the solid enhancing component was obtained by subtracting the necrotic component mask from the whole-tumor mask (Fig 2). The segmentations were performed by a radiology resident (C.G.Z., with 2 years of radiology experience) under the supervision of a board-certified neuroradiologist (G.B., with 19 years of radiology experience) with a Certificate of Added Qualification in neuroradiology. The users had access to all the standard MRI sequences in each case, even though the segmentation was performed only on the T1-CE sequences.

Representative images from a patient with BM demonstrating the baseline T1 postcontrast MPRAGE (A) and VIBE (D) images, the whole tumor mask (shaded in red) in MPRAGE (B) and VIBE (E), and the necrotic mask in MPRAGE (C) and VIBE (F). The mask for the solid-only enhancing component was obtained by subtracting the corresponding necrotic component mask (shaded in red) from the whole-tumor mask.
The segmentations were performed using semiautomated software and were manually editable with the same software to allow fine-tuning. Separate masks for the enhancing and necrotic components were used for analysis because some studies have shown better classification performance when using tumor sub-regions masks separately as compared to whole tumor masks.16 A region was considered “enhancing” when it showed an unequivocal increase in underlying signal intensity to the radiologist above the baseline noncontrast T1WI at the same level. The “necrotic” component, on the other hand, was defined as a persistently hypointense tumor subregion without any apparent increase in signal intensity postcontrast. Because there are documented differences in the contrast-to-noise and visual conspicuity ratings between the 2 sequences, separate segmentations were performed for both sequences instead of treating 1 sequence as a criterion standard and superimposing the ROI derived from one sequence on the other sequence.7 A few representative examples of tumor segmentations are provided in the Online Supplemental Data.
Feature Extraction
For each tumor, features were extracted using 2 masks: a solid enhancing tumor mask and a necrotic mask. Features were extracted using pyradiomics, Version 3.0 (https://pypi.org/project/pyradiomics/).17 Because there were 4 possible mask and sequence combinations (2 MRI sequences and 2 masks) on each of which 107 radiomic features were obtained, there were a total of 428 features.
Each set of 107 features included 3D shape features (n = 14), first-order features (n = 18), gray level co-occurrence matrix features (n = 24), gray level dependency matrix features (n = 14), gray level run length matrix features (n = 16), gray level size zone matrix features (n = 16), and neighboring gray tone difference matrix features (n = 5). The default value for the number of bins was fixed by a bin width of 25-Gy levels. Before feature selection, each covariate was standardized. There were no missing values, and imputation was not performed.
Modeling Scheme
To fully leverage all available data for training and testing, we adopted a nested cross-validation model-fitting design. Five outer folds were defined on the basis of stratified random sampling using MRI scanner strength (1.5 and 3T) and tumor status (GB and BM) as stratifying factors. Each outer fold then served as a distinct test data set for a model trained on the remaining 4 folds.
Feature Harmonization
Because the data were acquired from different MRI scanners (1.5 and 3T), there was a potential for the different signal intensities to lead to variations in the feature values. To account for this variation, we used the ComBat feature harmonization technique before model fitting.18 This technique has been shown to reduce feature dissimilarities among different scanners.19 Feature harmonization was implemented using the neuroCombat package in R Version 4.2.2, using the nonparametric adjustment method to avoid making any distributional assumptions about the features.20,21 This was performed separately by sequence/mask combination and each of the 5 nested cross-validation based training datasets. Pretrained neuroCombat models were then applied to the remaining outerfold data sets as part of the test set ML model classification.
Feature Selection
Feature selection was implemented through the recipes package in R, Version 4.2.2.22 Besides evaluating the models without any a priori feature selection (“none”), we used the following feature-selection/reduction techniques:
Linear combinations filter, which addresses both collinearity and dimension reduction by finding linear combinations of ≥2 variables and removing columns to resolve the issue. This process is repeated until the feature set is full rank.
Principal components analysis, in which the number of components retained is determined by specifying the fraction of the total variance that should be covered by the components (set to 0.90).
Least absolute shrinkage and selection operator (LASSO), in which 10-fold cross-validation was used to select the optimal tuning parameters based on minimized error (ie, more permissive than the One Standard Error Rule). A final LASSO model is then trained, and all features with nonzero coefficients are passed to the model training phase.
The minimum-redundancy maximum-relevance (MRMR) algorithm that ranks features according to the MRMR criterion. This requires specification of the number of features to extract, which was set to 50 (approximately a 75% feature set reduction).
Model Fitting
A total of 9 ML algorithms were considered, along with feature-reduction techniques as described above. These included support vector machine with polynomial kernel (SVM-Poly), support vector machine with Gaussian kernel (SVM-RBF), Elastic-net, LASSO, extreme gradient boosting, generalized boosted regression models, random forest (RF), neural networks, and K-nearest neighbors. A total of 45 ML pipelines were considered for each of the 2 MRI sequences by considering all possible combinations of the ML algorithm and feature-selection methods, and all pipelines were fed with radiomics data of both tumor subcomponents.
Models were fit using the caret package in R.22 The model training for hyperparameter tuning was based on 5-fold cross-validation, with 5 repeats, and optimal hyperparameter settings were identified on the basis of the cross-validated area under the receiver operating characteristic curve (AUC-ROC). Tuning grids were defined for each ML algorithm under default settings (tuneLength = 10) with the exception of extreme gradient boosting, SVM-Poly, and neural networks, for which custom grids were applied.
Evaluation
Pearson correlations were estimated for each radiomics feature derived from the respective sequence separately by mask. To evaluate the potential impact of scanner strength, we considered correlation analyses without and with batch correction (using neuroCombat). For the latter, we aggregated batch-corrected radiomics data from the outerfolds of the nested cross-validation to constitute a single data set. Concordance of feature correlations with and without correction was assessed using the Lin concordance correlation coefficient separately by mask.
Model test set performance was measured by the mean AUC (with higher values indicating better performance), Log Loss (lower value indicating better performance), as well as the Brier score, which is a measure of the accuracy of the probabilistic predictions. A lower Brier score implies better prediction calibration. Finally, the top 20 radiomic features across the top performing 5 models were compared for both sequences. Given the nested cross-validation design, the 5 outerfold test set performance measures for any given ML pipeline and MRI sequence were summarized by mean (SD). The study methodology in the Checklist for Artificial Intelligence in Medical Imaging (CLAIM) was followed.23
RESULTS
Of the total patients (n = 108), 29% had GBs (n = 31) and 71% had BM (n = 77). Among the patients with BM, most tumors were known lung primaries (n = 29). In 18 cases, intracranial metastasis was the initial manifestation of the tumor, and the primary site remained unknown. Patient demographics and scanner information are provided in Table 1.
Figure 3 shows the Pearson correlation estimate distribution as boxplots for the enhancing and necrotic tumor components derived from the 2 sequences for the uncorrected data. This shows a moderate-to-strong correlation among features, with the strongest correlations for the shape-based features. In general, correlations were slightly higher for the enhancing tumor components. The Online Supplemental Data show the scatterplots of the individual Pearson correlation estimates after data set batch correction, with the Lin concordance correlation coefficient between batch corrected and uncorrected datasets for the 2 masks reported in the Online Supplemental Data. These feature correlations were noted to be highly concordant, indicating that the scanner had minimal impact on the feature correlation between sequences.

Boxplots showing Pearson correlation estimate distributions for the enhancing and necrotic tumor components derived from the 2 sequences for the uncorrected data. Corr. indicates Correlation.
In terms of model classification performance, the best performing pipeline on MPRAGE masks showed a mean AUC of 0.890 (SD, 0.09) and was obtained using SVM-Poly with a linComb filter. For the VIBE sequence–derived radiomics models, SVM-RBF with linComb showed the best performance with a mean AUC of 0.907 (SD, 0.08). Table 2 shows the metrics for the top 5 models using the MPRAGE and VIBE sequences. Figure 4 shows the differences in AUC-ROC performance (MPRAGE-VIBE) between the sequences when using the same ML model and feature-reduction methodology. The performance showed only minimal differences (range, –0.078–0.046). The Online Supplemental Data show the scatterplot of the differences in AUC-ROC for the same pipelines, again redemonstrating the overall similar and correlated performance of the models. The Online Supplemental Data show the differences in model performance based on the ML algorithm and feature selection technique. Top-performing models for the MPRAGE sequence commonly used SVMs, while those for VIBE sequence used either SVMs or RF. Common feature-reduction methods for top-performing models included the linear combination filter and LASSO for both sequences. Finally, the Online Supplemental Data show the top 20 radiomics features for the top 5 models for both sequences. Sixteen of these top features were common, with approximately one-half of the features being shape-based. Equally important, all the top 20 radiomics features from both sequences were derived from the enhancing component of the tumor.

Differences in AUC-ROC performance (MPRAGE-VIBE) between the sequences when using the same ML model and feature-reduction methodology. PCA indicates principal components analysis; KNN, K-nearest neighbors; GBRM, generalized boosted regression model; XBG, extreme gradient boosting.
Performance metrics for the top 5 models using the VIBE and MPRAGE sequences
Because there were a total of 90 ML models, a detailed evaluation of the misdiagnosed cases for each model was beyond the scope of the current work. A preliminary assessment of cases most often misdiagnosed by the models was, therefore, performed. These were identified as cases with a median error of >0.80 across all models, implying that the cases were frequently misdiagnosed regardless of the ML algorithm or feature-reduction technique used. We identified 8 such cases (7 GB and 1 BM). Representative images from these cases are provided in the Online Supplemental Data.
DISCUSSION
Our findings demonstrate that radiomics features derived from contrast-enhanced MPRAGE and VIBE sequences show moderate-to-strong correlation and have comparable model performance for differentiating between GB and BM. Our findings raise the possibility that similar ML pipelines may perform equally well with different sequences and pooling of data among different sites using different T1-CE sequences that may be less restrictive.
Even though several prior studies have evaluated differences in radiomics on the basis of different sequences, acquisition parameters, and scanner strengths, there is little information on the model performance when using different types of postcontrast sequences for the same classification task.24⇓⇓⇓-28 We chose to address the model performance on T1-CE sequences for several reasons. First, T1-CE sequences are one of the most important sequences in neuro-oncology and are almost always performed for tumor detection and assessment.2,6,7,16,29 Second, multiple prior studies have relied almost exclusively on the T1-CE-derived radiomics for classification problems, with some studies showing that the model performance of the T1-CE sequences may, at times, be comparable with that of multiparametric MRI-derived radiomics.2,16,29 Third, the variability in the type of T1-CE sequence, even with the same vendor, in terms of the 2D or 3D technique as well as the type of sequence used, lends itself to further interrogation. The variability in terms of underlying physics and actual lesion-detection performance can be considerable, as has been addressed in a few studies.7,8 These sequences can also have differences in radiomics features, as described by Ford et al,26 who noted that the radiomics features can vary considerably among different T1-weighted pulse sequences. This issue, therefore, raises legitimate concerns about the generalizability of radiomics models when combining different sequences.
Our findings reveal that, at least for the 2 sequences evaluated in the current study, not only is the classification performance fairly similar but the individual radiomics features are also highly correlated. The precise reason for the high correlation is unclear. Both sequences are T1-weighted gradient recalled echo–based contrast-enhanced 3D sequences. Additionally, van der Reijd et al,30 in their study on hepatic metastasis, noted that T1-CE sequences were the most robust to segmentation variability. It is plausible that both of these factors contributed to the high correlation in radiomics features observed in the current study.
We also chose to evaluate models with radiomics derived from the solid-enhancing and necrotic components of the lesions separately, instead of the entire tumor combined. This evaluation was performed because prior study by Priya et al16 showed improved model performance when evaluating radiomics from tumor subregions instead of the entire tumor. Another reason was to better evaluate the correlation between radiomics features derived from tumor subcomponents, an evaluation not feasible with whole-tumor segmentation.
Besides the high correlation between the radiomics features, the relatively similar performance of multiple ML pipelines in our study could potentially also be explained by the scanning parameters as well as the image-preprocessing techniques. Both T1-CE sequences in our study were 3D T1-CE sequences with slice thicknesses between 1 and 1.5 mm (MPRAGE) and 1.5 mm (VIBE). Mayerhoefer et al27 previously noted that if the spatial resolution is sufficiently high, variations in the number of acquisitions, TR, TE, and sampling bandwidth have little effect on the results of pattern discrimination for a given sequence. Our preprocessing steps likely helped further homogenize the data sets in terms of image intensity and the radiomic features, which helped with achieving robust performance with similar ML pipelines despite different sequences. Another factor that potentially contributed to comparable performances was that most of the radiomics variables of importance were derived from shape-based features (Online Supplemental Data). In fact, of the top 20 radiomics features across the 5 best models in both sequences, 16 radiomics features were common to both sequences, and of these, there were 10 common shape-based features. Because shape features like shape flatness, maximum diameter, lesion volume, and so forth can be visually correlated by the radiologist, our findings suggest that their careful evaluation may be helpful when deciding between GB and BM.
Finally, a review of the most commonly misdiagnosed cases (Online Supplemental Data) was also performed. Most of these cases were GB (n = 7), and 1 case was BM. Misdiagnosed GB cases often tended to have a smaller enhancing component and/or well-defined margins and a more spherical appearance. The misdiagnosed BM case was large and had a prominent necrotic component. Given that some of the GB cases also had a larger, infiltrative nonenhancing component, it is possible that the use of multiparametric MRI or concurrent assessment by the model and human reader may further improve model performance.
Limitations of our study include its retrospective nature and lack of a larger data set. In our institution, the VIBE sequence is concurrently performed for neurosurgery stealth navigation in patients being considered for surgical intervention. Not all patients are, therefore, scanned with both 3D T1-CE sequences, introducing an element of selection bias, albeit random. Because the segmentation was performed by the radiology trainee under direct supervision of the neuroradiology attending physician, any impact of interreader segmentation on model performance could not be assessed. The relatively small sample size would preclude application of deep learning methodologies. which were, therefore, not pursued. Lack of external validation, model performance of 3D TI-CE SPACE, or pointwise encoding time reduction with radial acquisition (PETRA) sequences, and data from different vendors are other limitations that could be addressed in future studies and would further address the issue about broader generalizability of the T1-CE sequences across vendors and technical acquisition differences. Finally, reported performance measures among top models may be subject to some component of overfitting due to model selection, and interpretation of results should be constrained to the comparisons between sequences.
CONCLUSIONS
Radiomics features derived from MPRAGE and VIBE 3D T1-CE sequences are strongly correlated and can provide similar model performance for differentiating GB and BM despite differences in scanner strengths and acquisition parameters. These findings are encouraging and should be further validated for other intracranial space-occupying lesions and contrast-enhanced sequences. Ultimately, these may help guide future multisite collaborations between institutions using different T1-CE sequences, making the dependence on type of sequence less restrictive.
Footnotes
G. Bathla and C.G. Zamboni contributed equally and are co-first authors.
Disclosure forms provided by the authors are available with the full text and PDF of this article at www.ajnr.org.
References
- Received June 19, 2024.
- Accepted after revision August 13, 2024.
- © 2025 by American Journal of Neuroradiology


Jump to section
Related Articles
Cited By...
- No citing articles found.