
Abstract
BACKGROUND AND PURPOSE: Anatomically adapted cochlear implantation and efficient postoperative cochlear implant-fitting strategies benefit from reliable and highly detailed imaging techniques. Since image quality in CT is related to the applied radiation dose, this study aimed to evaluate low-dose cochlear imaging with a photon-counting detector by investigating the accuracy of pre- and postoperative cochlear analysis.
MATERIALS AND METHODS: Photon-counting CT images of 10 temporal bone specimens were acquired with 3 different radiation dose levels (regular dose: 27.1 mGy, low dose: 4.81 mGy, and ultra-low dose: 3.43 mGy) before and after cochlear implant electrode carrier insertion. A clinical scan protocol was used with a tube potential of 120 kV in ultra-high-resolution scan mode (detector collimation 120 × 0.2 mm). The accuracy of cochlear duct length measurements for the organ of Corti and electrode contact determination was investigated for all applied settings by 2 independent otosurgeons.
RESULTS: No substantial differences were ascertained between photon-counting CT scans performed with standard dose and dedicated low-dose imaging regarding the accuracy of neither pre- and postoperative cochlear analysis nor postoperative cochlear implant electrode analysis. Radiation dose reduction of 82.3% (low dose) and 87.3% (ultra-low dose) could be realized compared with the clinical standard protocol.
CONCLUSIONS: Ultra-high-resolution cochlear imaging is feasible with very low radiation exposure when using a first-generation photon-counting CT in combination with dedicated low-dose protocols. The accuracy of pre- and postoperative cochlear analysis with the applied dose reduction settings was comparable with a clinical regular-dose protocol.
ABBREVIATIONS:
- AID
- angular insertion depth
- CDL
- cochlear duct length
- CDLLW
- cochlear duct length of the lateral cochlea wall
- CDLOC
- cochlear duct length of the organ of Corti
- CTDIvol
- volume CT dose index
- DLP
- dose-length product
- EID
- energy-integrating detector
- ICC
- intraclass correlation coefficient
- IL
- insertion length
- LD
- low dose
- PCD
- photon-counting detector
- RD
- regular dose
- SD
- standard deviation
- ULD
- ultra-low dose
SUMMARY
PREVIOUS LITERATURE:
Comparative studies emphasize the advantages of photon-counting detectors over conventional CT scanners regarding spatial resolution, tissue contrast, and radiation dose reduction. However, the extent to which photon-counting CT improves imaging in the context of cochlear implantation has not yet been investigated.
KEY FINDINGS:
In 10 temporal bone specimens, no substantial difference was ascertained between regular-dose and low-dose photon-counting CT in terms of preoperative cochlear analysis and postoperative electrode contact determination. However, extensive radiation dose reduction was achieved compared with the clinical standard protocol.
KNOWLEDGE ADVANCEMENT:
Our findings indicate that photon-counting CT facilitates highly accurate pre- and postoperative cochlear analysis with very little radiation dose. Children and young adults needing cochlear implant surgery especially may benefit from this radiation exposure reduction.
Successful hearing rehabilitation by cochlear implantation depends on implementing information about the patient’s cochlear characteristics into the surgical procedure.1,2 Preoperative analysis of cochlear anatomy allows for appropriate length selection of the cochlear implant electrode carrier to achieve full cochlear coverage with the electrode lead. This enables electric stimulation of all relevant frequencies for pitch perception.3⇓⇓⇓-7 By extracting anatomic and tonotopic information about the cochlea, precise insertion of the chosen electrode carrier becomes feasible.8,9 As a result, the patient’s hearing outcome can benefit from transferring delicate information about the cochlear duct length (CDL), the number of turns, and the frequency bandwidth distribution into the insertion process.10⇓-12 Insertion depth, insertion angle, and electrode placement can influence the audiological outcome of the patient.3,13,14
Despite precise implantation, postoperative cochlear implant electrode contacts may deviate from preoperatively targeted locations, leading to a “frequency-to-place mismatch.” This mismatch between electrode distribution and cochlear tonotopy can impair speech perception in patients.15 Despite adjusting each cochlear implant electrode contact to the anatomically correct natural frequency location during postoperative fitting, frequency-to-place mismatches remain a concern,11 particularly for patients with bilateral cochlear implants to reduce tonotopic asymmetry between the ears.15 Recent studies addressed the need for precise electrode contact determination in accordance with a patient’s tonotopic characteristics for anatomically correct postoperative fitting.9,16,17 Cochlear analysis with surgical planning software can accurately show the position of the cochlear implant electrodes after insertion. Knowing the exact locations of each electrode contact within the cochlea helps audiologists and electrophysiologists minimize the frequency-to-place mismatch.15
To evaluate cochlear structures, various imaging options are available, including conventional energy-integrating detector (EID) CT, conebeam CT with flat panel detectors,18,19 and now, photon-counting detector (PCD) CT.
CDL measurement varies considerably, especially depending on the imaging and measurement techniques used.7,20⇓⇓-23 Frequently used CT scanners in clinical routine employ EID.24⇓⇓-27 In recent years, the dose reduction potential of the less efficient EID technology has been mostly exhausted because of the technical constraints originating from the detector architecture.28 Simultaneously, radiation protection, particularly in infants, who constitute a substantial portion of the patient group undergoing perioperative temporal bone CT scans, becomes crucial.29
Therefore, PCD-CT, representing a promising alternative for conventional EID-CT, is gaining the attention of not only radiologists but also otosurgeons.30 The only commercially available and clinically approved PCD consists of a semiconductor material (cadmium-telluride).31,32 PCD-CT facilitates improved contrast-to-noise ratios, reduction of the pixel size, and overall improvement of dose efficiency.32⇓⇓-35 The potential radiation dose reduction in temporal bone scans was described to be up to 80% compared with conventional EID-CT in recent preclinical analysis.36
This study was conducted by using cadaveric specimens to ensure optimal comparability between scans. Its primary objective was to assess preoperative planning and positions of cochlear implants. The evaluation of the cochlea was supported by dedicated software, which enabled the comparison of pre- and postoperative scans at various dose levels by analyzing the cochlea duct length. Additionally, the study investigated whether the dose level influences the outcomes.
MATERIALS AND METHODS
Image Acquisition
PCD-CT studies were performed with a first-generation dual-source scanner (NAEOTOM Alpha, Siemens Healthineers) equipped with a cadmium-telluride detector system. Three protocols with different radiation dose levels were investigated: A clinical regular-dose protocol (PCD-CTRD) with a volume CT dose index (CTDIvol) of 27.1 mGy, a low-dose protocol (PCD-CTLD) with a CTDIvol of 4.81 mGy, and an ultra-low–dose (PCD-CTULD) protocol with 3.43 mGy. Other scan parameters are summarized in Table 1. Effective radiation exposure was calculated by multiplying the dose-length products (DLP) with an established conversion factor of 0.0021 mSv × mGy−1 × cm−1.37
Scan and reconstruction parameters
Specimens and Practical Approach
Cochlear implant electrode carrier insertion was performed in 10 human petrous bone specimens by an experienced cochlear implant surgeon by using a mastoidal approach after preoperative PCD-CT imaging. The temporal bone specimens used in this study were used following appropriate guidelines and procedures for obtaining and using human tissue in concordance with the Bavarian law. No further ethics committee approval was obtained.
In all specimens, a Flex28 cochlear implant electrode array (MED-EL) was inserted. Postoperative PCD-CT data were acquired in all specimens with the same scan protocols used for preoperative imaging (Fig 1 and Fig 2). Figure 1 provides a representation of the adjusted pre- and postoperative cochlear view in one of the temporal bone specimens. Minor differences between the freeze frames in Fig 1 resulted from adjustments for each scan mode. The oblique coronal view of the basal turn of the cochlea was individually aligned by inserting projection axes through the center of each basal turn and the modiolus. The differences depicted in Fig 1 did not affect the measurements as they were performed in 3 planes (axial, sagittal, and cochlear view) in a dynamic process.

Representative PCD-CT images of the same temporal bone scan before and after cochlear implant insertion show the “cochlear view” with different radiation dose levels. PCD-CTRD scans were acquired with a CTDIvol of 27.1 mGy (A, PCD-CTRD before cochlear implant insertion, D, PCD-CTRD after cochlear implant insertion). PCD-CTLD scans were acquired with a CTDIvol of 4.81 mGy (B, PCD-CTLD before cochlear implant insertion, E, PCD-CTLD after cochlear implant insertion). PCD-CTULD scans were acquired with a CTDIvol of 3.43 mGy (C, PCD-CTULD before cochlear implant insertion, F, PCD-CTULD after cochlear implant insertion). Minor differences concerning cochlear implant visibility between the freeze frames resulted from individual cochlear view adjustment for each scan mode.

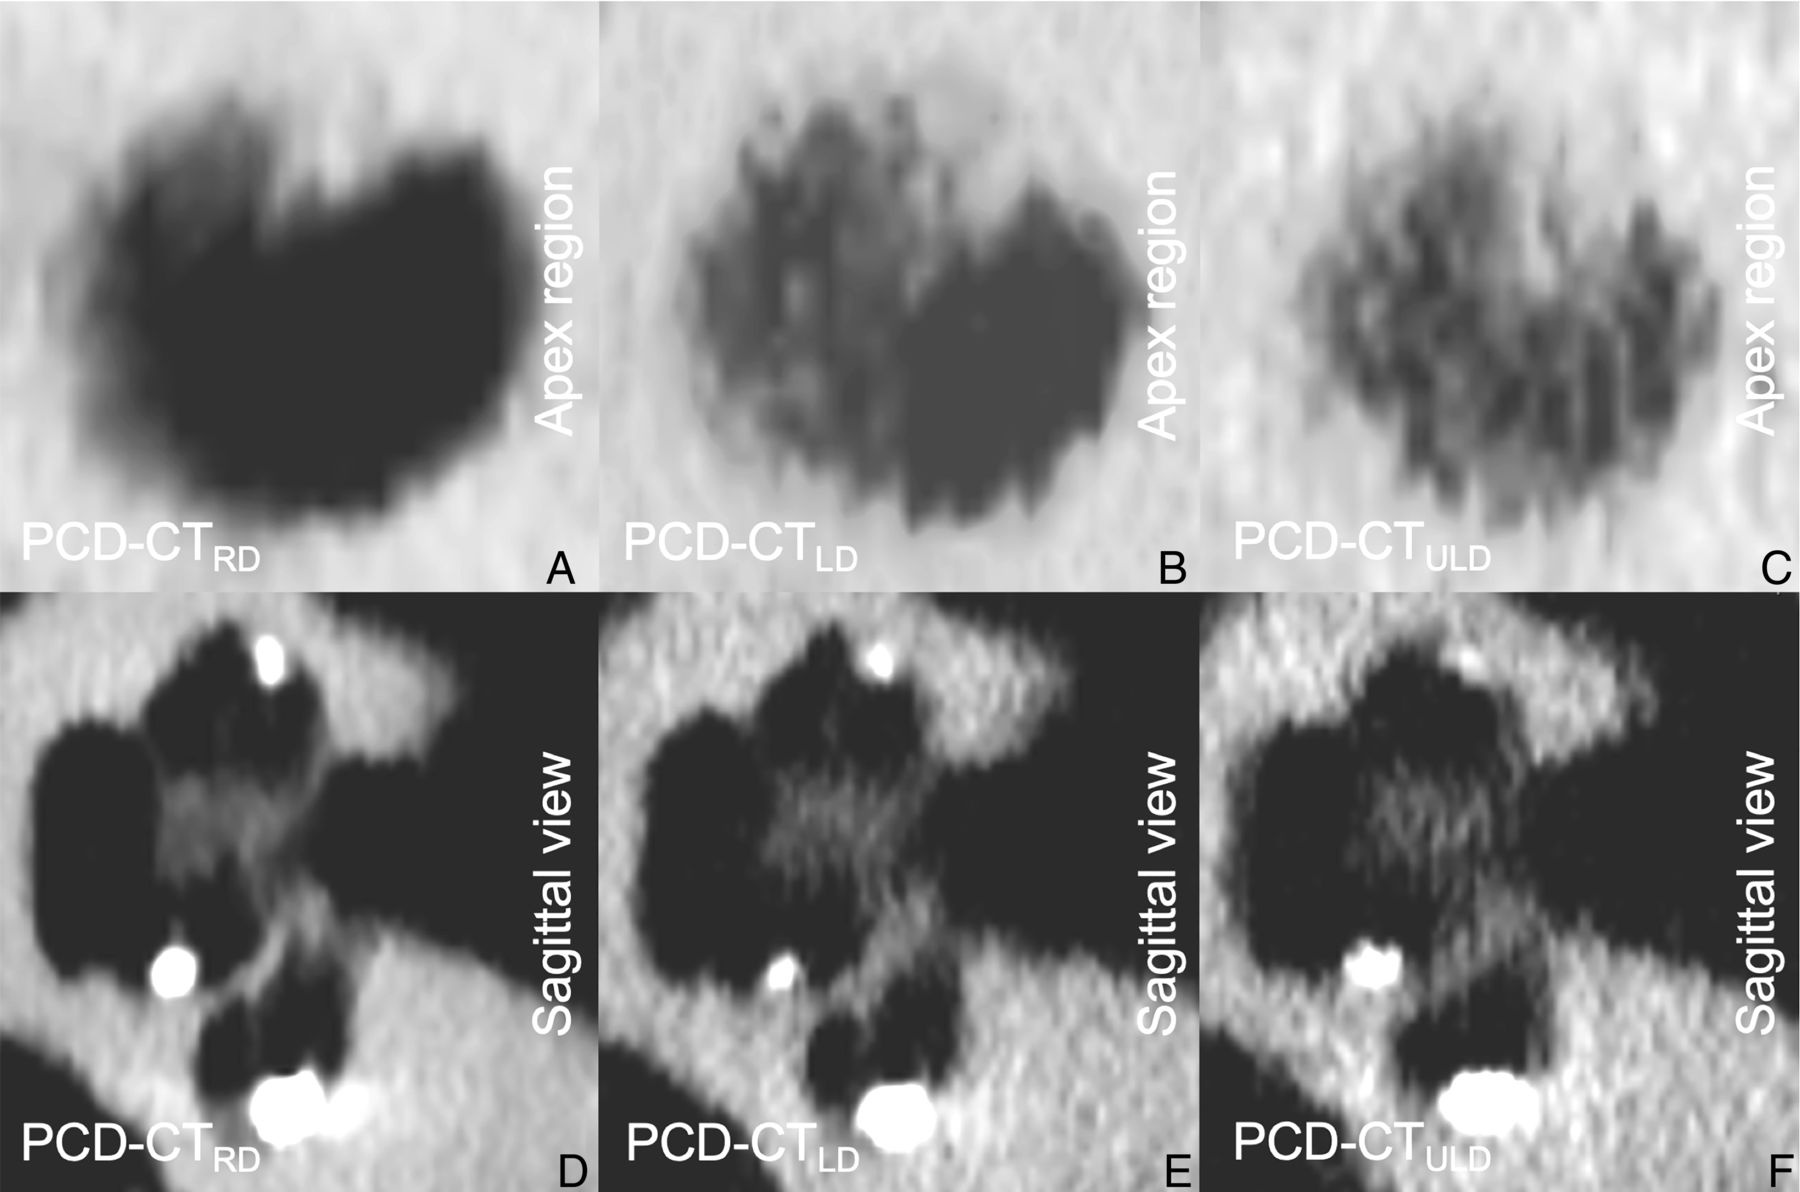
Representative PCD-CT images of 1 temporal bone scan after cochlear implant insertion showing the apex region (A–C) and the sagittal view (D–F) of the same cochlea dependent on different radiation dose levels.
To ensure the comparability of scan lengths, the specimens were brought in an anatomically correct position, and the CT planning was performed based on the anatomic structures visible on scout images. CDL measurement was performed before and after electrode carrier insertion. Cochlear implant electrode contact determination was investigated postoperatively.
Primary Data Analysis
Pre- and postoperative CDL measurements were performed separately for the lateral cochlea wall (CDLLW) and the organ of Corti (CDLOC). After transferring the Digital Imaging and Communications in Medicine (DICOM) data sets into a dedicated viewer software (Horos, Version 3.3.5, Nimble Co LLC d/b/a Purview), a 3D-curved multiplanar reconstruction of the cochlea was performed by an otosurgeon with 4 years of training in multiplanar reconstruction measurements. The reconstruction technique enables a precise determination of CDLLW by fitting in a manually placed Bézier path directly to the lateral wall of the cochlea that is projected in the “cochlear view”.5,21,38,39 The Bézier path extends from the center of the round window to the apex of the cochlea by defining multiple marker dots in different planes as described by Wuerfel et al.38 A minimum intensity projection with 1.0-mm thickness was used to optimize the visualization of the highest point of the spiral canal.20,40
The DICOM data set was then transferred to a specialized otological planning software (Otoplan, Version 3, CAScination AG, and MED-EL) to measure CDLOC (Supplemental Video V1). CDLOC measurement by using this software is based on equations by Alexiades et al41 and Schurzig et al.42 The calculation of the tonotopic frequency map of the cochlea is based on preliminary work by Greenwood,43 in which the relationship between the frequency and the location of maximum basilar membrane excursion was first described. The formula used by Greenwood43 was supplemented by Stakhovskaya et al44 with the inclusion of cochlear angle measurements (in degrees) to determine the location within the cochlea. Postoperative cochlear implant electrode contact determination within the software was performed in 2 ways, automatically and manually, by 2 independent otosurgeons with 6 and 4 years of clinical training in the field, respectively. Measurements were performed in 2 sessions (before and after cochlear implant insertion) with observers blinded to the respective scan protocol. Electrode contact determination enabled analysis of the angular insertion depth, insertion length, and tonotopic mapping of each electrode contact. The manually performed electrode contact determination represented the ground truth of electrode positioning. It was performed by placing 12 individual fiducials precisely in the center of each electrode contact using the axial, sagittal, and cochlear view. Starting with the C12 electrode contact in the basal turn of the cochlea right next to the round window niche, the examiner placed one fiducial after another along the cochlear turns up to the apex region where the most apical electrode, ie, the C1 electrode contact, was positioned. Angular insertion depth (AID), insertion length (IL), and frequency location were then calculated by the software, which was dependent on the individual CDLOC computed before. Since it is also possible to let the software place the 12 fiducials automatically, the manual fiducial placement was compared with the automated electrode detection (Online Supplemental Data). Accuracy levels were determined based on the differences between automated and manual measurements and were calculated for all radiation dose protocols. Interrater variability was analyzed.
Subjective Image Quality Analysis
In addition to quantitative analyses, a subjective assessment of overall image quality was performed by 3 board-certified radiologists with 7–10 years of experience. Blinded to any scan protocol-related information, the observers analyzed all pre- and postoperative data sets in randomized order by using standard PACS software (Merlin, Phönix-PACS). Personal window preferences, ie, width and center, could be used for each read. An equidistant 7-point scale was used to evaluate the overall image quality (7 = excellent, 6 = very good, 5 = good, 4 = satisfactory, 3 = fair, 2 = poor, 1 = very poor). To estimate interrater agreement, the intraclass correlation coefficient (ICC) was computed based on absolute agreement of single measures in a 2-way random effects model. ICC values were interpreted as: ICC >0.90 = excellent; 0.75–0.90 = good; 0.50–0.75 = moderate; and <0.50 = poor reliability.
Statistics
Normal distribution was assessed by using the d’Agostino-Pearson test. One-way repeated measures analysis of variance (ANOVA) was used for metric data in case of normal distribution, whereas the Friedman or Wilcoxon test was applied for non-normal items. A type 1 error level of <0.05 was considered indicative of statistical significance and a confidence level of 95% was preset. Interrater variability was statistically analyzed and graphically displayed via Bland-Altman plots for all measurement groups. A CDL deviation of more than ±1.5 mm was determined as clinically relevant and defined as an error range.5,45 All statistical analyses were performed by using dedicated software (GraphPad Prism, Version 8.3.0, GraphPad Software).
RESULTS
Radiation Dose
The regular-dose protocols were associated with a DLP of 153.19 ± 43.45 mGy × cm, while the LD and ULD protocol resulted in a mean DLP of 27.19 ± 7.71 mGy × cm and 19.36 ± 5.49 mGy × cm, respectively. This corresponds to effective dose values of 0.32 ± 0.09 mSv for regular dose, 0.06 ± 0.016 mSv for low dose, and 0.04 ± 0.01 mSv for ultra-low–dose imaging.
Influence of Radiation Dose on CDLOC and CDLLW Measurements
Normally-distributed metric data read as mean ± standard deviation (SD) (Table 2). PCD-CTRD scans showed a preoperative CDLOC of 37.23 ± 2.66 mm and a preoperative CDLLW of 40.76 ± 2.73 mm. The postoperative measurements revealed a CDLOC of 37.33 ± 2.72 mm and CDLLW of 40.99 ± 2.88 mm. PCD-CTLD scans had a preoperative CDLOC of 37.16 ± 2.56 mm and a preoperative CDLLW of 40.90 ± 2.58 mm. Postoperatively, a CDLOC of 37.25 ± 2.62 mm and a CDLLW of 40.74 ± 2.72 mm were measured. The scan protocol with the lowest radiation dose, PCD-CTULD, resulted in a preoperative CDLOC of 37.15 ± 2.71 mm and a CDLLW of 40.88 ± 2.61 mm. PCD-CTULD showed a postoperative CDLOC of 37.05 ± 2.64 mm and a CDLLW of 40.96 ± 2.57 mm. Data comparison revealed no statistically significant difference between the tested groups. Moreover, there were no significant differences between pre- and postoperative measurements within the same scan protocol group (Fig 3).

CDL measurement with different radiation dose levels. A, Pre- and postoperative CDLOC measurement with the otological planning software showing no significant differences between the tested groups. B, Reveals no significant differences between all groups concerning CDLLW measurement by 3D-curved MPR analysis.
Pre- and postoperative cochlear duct length measurements with different radiation dose levels
Influence of Radiation Dose on Postoperative Electrode Contact Determination
Accuracy of Automated Frequency Determination.
The overall difference between automated and manual frequency determination across all cochlear implant electrode contacts was 31 ± 8 Hz for PCD-CTRD, 32 ± 8 Hz for PCD-CTLD, and 34 ± 7 Hz for PCD-CTULD. There was no difference concerning the accuracy levels for automated frequency determination between PCD-CTRD and PCD-CTLD (P > .99), between PCD-CTRD and PCD-CTULD (P = .53), or between PCD-CTLD and PCD-CTULD (P = .79).
Accuracy of Automated Insertion Length Determination.
The overall mean difference between automated and manual IL determination across all cochlear implant electrode contacts was 0.058 ± 0.011 mm for PCD-CTRD, 0.056 ± 0.016 mm for PCD-CTLD, and 0.062 ± 0.014 mm for PCD-CTULD. There was no significant difference concerning the accuracy levels for automated IL determination between PCD-CTRD and PCD-CTLD (P = .93), between PCD-CTRD and PCD-CTULD (P = .71), or between PCD-CTLD and PCD-CTULD (P = .29).
Accuracy of Automated Angular Insertion Depth Determination.
The overall mean difference between automated and manual AID determination across all cochlear implant electrode contacts was 1.3 ± 0.4° for PCD-CTRD, 1.2 ± 0.3° for PCD-CTLD, and 1.3 ± 0.4° for PCD-CTULD. The accuracy levels for automated AID determination between PCD-CTRD and PCD-CTLD showed no significant difference (P = .43). This was the same for comparisons between PCD-CTRD and PCD-CTULD (P = .89) and between PCD-CTLD and PCD-CTULD (P = .19) (Fig 4).

Illustration of cochlear analysis by using 3D-curved multiplanar reconstructions (A) and the otological planning software (B and C): Measurements of CDLLW (A) were performed by fitting in a Bézier path to the lateral wall of the cochlea projected in the “cochlear view.” Multiple marker dots were placed in different planes extending from the center of the round window (RW) to the apex of the cochlea. CDLOC (B), as well as insertion length, angular insertion depth, and frequency distribution (C) were calculated with otological planning software. Calculation of CDLOC is based on an elliptic circular approximation formula described by Alexiades et al41 and Schurzig et al.42 Calculation of the related frequency location is based on formulas described by Greenwood43 and Stakhovskaya et al.44
Influence of Radiation Dose on Interrater Variability
Interrater variability of pre- and postoperative CDLOC was low for all measurements independent of the applied radiation dose (Table 3). No unacceptable errors were found. The lowest interrater variability was seen in the PCD-CTULD group with a bias of 0.12 ± 0.38 preoperatively and 0.11 ± 0.47 postoperatively. PCD-CTRD showed a bias of 0.35 ± 0.40 preoperatively and 0.18 ± 0.49 postoperatively. The bias of PCD-CTLD was 0.17 ± 0.35 preoperatively and 0.47 ± 0.35 postoperatively (Online Supplemental Data).
Influence of radiation dose on electrode contact determination and interrater variability
Subjective Image Quality
PCD-CTRD was considered to feature the best image quality overall (median 7 [interquartile range 7–7]). Both PCD-CTLD (6 [5–6]) and PCD-CTULD (4 [3–4]) received considerably inferior ratings (all P < .001). Notably, preoperatively acquired data sets were deemed superior compared with postoperative images in PCD-CTLD (6 [6–6] versus 5 [5–6]; P < .001) and PCD-CTULD (4 [4–5] versus 3 [3–4]; P < .001). In contrast, no significant difference was ascertained among acquisitions before and after cochlear implant insertion in PCD-CTRD (7 [7–7] versus 7 [7–7]; P = .21). Interrater reliability was good, indicated by a single measures ICC of 0.89 (95% CI: 0.84–0.93; P < .001).
DISCUSSION
High-resolution temporal bone scans in the context of otosurgical procedures are increasingly in demand since preoperative knowledge of individual anatomic conditions can substantially influence the surgical outcome. For cochlear implant surgery, the selection and implantation of an anatomically fitting cochlear implant electrode, as well as postoperative coding and fitting strategies of the audio processors, are all influenced considerably by the quality of the CT images.6,16,46⇓-48 However, radiation protection remains a concern, particularly for vulnerable patient groups like pediatrics, limiting access to high-resolution imaging techniques. This temporal bone study explores a new imaging approach by using PCD-CT with dedicated low- and ultra-low–dose protocols for pre- and postoperative scans in cochlear implant surgery.
Our results indicate that with PCD-CT, metal artifacts from cochlear implants do not interfere with CDL measurements, although established artifact suppression techniques, such as iterative metal artifact reduction and virtual monoenergetic imaging, were not employed in the present study. We refrained from applying these methods, because they cannot be combined with ultra-sharp convolution kernels as of this writing. In 2022, Waldeck et al28 presented the first scientific study on PCD-CT for cochlear implant surgery. In their study, they investigated temporal bone scans of human body donors with an inserted cochlear implant electrode, comparing PCD-CT to conventional EID-CT. While PCD-CT scans were performed with a tube potential of 120 kV, an image slice thickness of 0.4 mm, and CTDIvol of 5.44 mGy, EID-CT images were acquired in dual-energy scan mode with a tube potential of 80 kV/Sn 150 kV, an image section thickness of 0.6 mm, and CTDIvol of 4.16 mGy. In this investigation, PCD-CT scans showed an improved contrast enhancement for metal-to-bone transitions enabling a more accurate cochlear implant electrode contact visualization with an improved visualization of the interelectrode wire. While metal artifacts are often problematic in CT imaging, the cochlear implant electrode contacts had no effect on the cochlear analyses in the presented study.28
To the best of the authors’ knowledge, this study is the first to assess dedicated low-dose protocols in temporal bone PCD-CT for pre- and postoperative cochlear analysis in cochlear implant surgery. It includes a comprehensive analysis of cochlear parameters crucial for anatomically based cochlear implants, including CDL measurement; electrode contact determination; and analysis of AID, IL, and frequency assessment. In conclusion, CDLOC and CDLLW measurements by using scan protocols with reduced radiation dose showed no significant difference from regular-dose scans. Furthermore, there was no difference between pre- and postoperative CDL measurements within each group.
Postoperative electrode contact frequency determination was equally accurate with low- and ultra-low–dose protocols, matching the established regular-dose protocol. Comparable results were seen for postop IL and AID measurements. Both reduced-dose protocols exhibited no interrater variability or unacceptable errors. These findings indicate that dose reduction efforts must not necessarily entail a significant measurement error compared with a regular-dose protocol. In the present study, the low-dose protocol enabled a dose reduction of 82.3%, while the dose reduction was even higher for the ultra-low–dose protocol with 87.3%. While the subjective ratings for PCD-CTLD and PCD-CTULD were lower compared with the regular dose protocol, it is important to note that both objective and subjective results indicate that the respective clinical questions could still be adequately addressed. Depending on the individual’s needs, one could perform preoperative planning by using the low-dose protocol and postoperative control by using the ultra-low–dose protocol. This approach would offer a balanced solution, maximizing both dose efficiency and clinical efficacy.
In a prior study, Tada et al49 examined radiation dose exposure with 2 temporal bone scan protocols in children by using conventional multislice CT. In 9 cases, a standard-dose 120 kV protocol was employed with filtered back-projection for image reconstruction. CTDIvol and effective dose were 19.9 mGy and 0.42 mSv, respectively. In 13 children, the authors tested a dedicated low-dose protocol with a CTDIvol of 9.9 mGy and an effective dose of 0.21 mSv.49 Despite methodologic and technical differences, these numbers underline the quantum leap in dose reduction made possible by the emergence of PCD-CT. Our clinical reference protocol yielded an effective dose of 0.196 mSv, comparable with the low-dose protocol in Tada et al. However, our ultra-low–dose PCD-CT protocol resulted in only 0.025 mSv, just 11.9% of the low dose in Tada et al.49
There is only a limited number of studies focusing on temporal bone imaging with a PCD-CT scanner thus far. Zhou et al50 investigated temporal bone scans of human body donors and compared the image quality to a high-resolution EID-CT scanner. According to the authors, the radiation dose was set to a clinical examination level with a CTDIvol of 61 mGy for both CT scanners. Of note, this is more than twice as high as the regular-dose protocol in the present study. Zhou et al50 report that PCD-CT allowed for approximately 40% image noise reduction compared with EID-CT with the same image section thickness. Based on this finding, they quantified the potential for radiation dose reduction to be about 64% if the same image noise is targeted. Moreover, the authors postulate better image quality concerning delicate anatomic structures of the middle and inner ear, eg, the incudomalleolar joint, the stapes footplate, and the cochlear modiolus.
Another study from Benson et al51 conducted a comparable study comparing PCD-CT and EID-CT temporal bone scans in 13 patients. PCD-CT scans were performed by using a tube potential of 120 kV, a sharp kernel type (Hr84), and an image section thickness of 0.2 mm, resulting in a CTDIvol of 35.6 mGy. The EID-CT scans were performed by using a clinical routine scan protocol with a tube potential of 120 kV, a slice thickness of 0.4 mm, and a CTDIvol of 51.5 mGy. Despite a radiation dose reduction of 31%, the authors describe a substantially improved overall image quality for PCD-CT compared with EID-CT.51
Several methodologic limitations have to be considered. First, the presented study did not include intact head specimens. Although the temporal bone is naturally covered by only a small amount of soft tissue, our radiation dose results may not be transferable to full-head scans. It is to be expected that the radiation dose reduction potential in full-head specimens with more surrounding soft tissue and air spaces is lower than in extracted temporal bone specimens. Second, no histologic preparation was performed. All data were collected in 10 temporal bone specimens, which have been shown to be a sufficient number in previous temporal bone studies.5,13,21,52⇓-54 Third, since fresh-frozen bones were utilized for all scans, the thawing process may have resulted in a minor systematic error, which was deemed acceptable for the feasibility of the experiment. Fourth, electrode models from different manufacturers were not inserted to reduce confounders. Fifth, Hr98 represents the sharpest applicable convolution kernel for head imaging. However, the maximum resolution may not be achievable under low-dose conditions. Therefore, it appears reasonable for clinical practice to adjust reconstruction parameters to the applied radiation dose. This optimization was not performed in the present investigation but may be necessary if the goal is to reduce the dose even further. Finally, despite being common practice for several high-contrast imaging tasks, such as lung cancer screening and urolithiasis, in the era of EID-CT, tin prefiltration was not employed in this investigation since earlier studies have demonstrated a substantial loss of image contrast and a limited effect on the dose reduction potential in temporal bone studies by using PCD-CT.36
CONCLUSIONS
Ultra-high–resolution cochlear imaging is feasible with very low radiation exposure when using first-generation photon-counting CT in combination with dedicated low-dose protocols. The accuracy of pre- and postoperative cochlear analysis with the applied dose reduction settings was comparable to a clinical regular-dose protocol.
Footnotes
Disclosure forms provided by the authors are available with the full text and PDF of this article at www.ajnr.org.
References
- Received February 25, 2024.
- Accepted after revision August 8, 2024.
- © 2025 by American Journal of Neuroradiology


Jump to section
Related Articles
Cited By...
- No citing articles found.