
Abstract
BACKGROUND AND PURPOSE: The cerebral metabolic rate of oxygen (CMRO2) is considered a robust marker of the infarct core in 15O-tracer–based PET. We aimed to delineate the infarct core in patients with acute ischemic stroke by using commonly used relative CBF (rCBF) < 30% and oxygen metabolism parameter of CMRO2 on CT perfusion in comparison with pretreatment DWI-derived infarct core volume.
MATERIALS AND METHODS: Patients with acute ischemic stroke who met the inclusion criteria were recruited. The CMRO2 and CBF maps in CT perfusion were automatically generated by using postprocessing software. The infarct core volume was quantified with relative cerebral metabolic rate of oxygen (rCMRO2) <20% –30% and rCBF <30%. The optimal threshold was defined as those that demonstrated the smallest mean absolute error, lowest mean infarct core volume difference, narrowest 95% limit of agreement, and largest intraclass correlation coefficient (ICC) against the DWI.
RESULTS: This study included 76 patients (mean age ± standard deviation, 69.97 ± 12.15 years, 43 men). The optimal thresholds of rCMRO2 <26% resulted in the lowest mean infarct core volume difference, narrowest 95% limit of agreement, and largest ICC among different thresholds. Bland-Altman analysis demonstrated a volumetric bias of 1.96 mL between DWI and rCMRO2 <26%, whereas in cases of DWI and rCBF <30%, the bias was notably larger at 14.10 mL. The highest correlation was observed for rCMRO2 <26% (ICC = 0.936), whereas rCBF <30% showed a slightly lower ICC of 0.934.
CONCLUSIONS: CT perfusion–derived CMRO2 is a promising parameter for estimating the infarct core volume in patients with acute ischemic stroke.
ABBREVIATIONS:
- CMRO2
- cerebral metabolic rate of oxygen
- ICC
- intraclass correlation coefficient
- OEF
- oxygen extraction fraction
- rCBF
- relative CBF
- rCMRO2
- relative cerebral metabolic rate of oxygen
SUMMARY
PREVIOUS LITERATURE:
CT perfusion is commonly used as the primary imaging technique for patients with acute ischemic stroke in many stroke centers. The accurate quantification of the infarct core volume is clinically important before endovascular treatment. The cerebral metabolic rate of oxygen (CMRO2) represents a key measure of brain function. To date, no study has quantified infarct core volume by using oxygen metabolism parameter (CMRO2) in CT perfusion.
KEY FINDINGS:
The relative cerebral metabolic rate of oxygen (rCMRO2) <26% accurately predicted infarct core volume compared with relative CBF <30% according to the smallest mean absolute error, lowest mean infarct core volume difference, narrowest Bland-Altman analysis, and highest ICC.
KNOWLEDGE ADVANCEMENT:
CT perfusion–derived CMRO2 effectively provides a more accurate prediction of the infarct core volume in patients with acute ischemic stroke.
CT perfusion is widely used for the evaluation of acute ischemic stroke in emergency settings worldwide, providing valuable brain hemodynamic information.1,2 Deriving infarct core volume from CT perfusion, particularly in delayed time windows (6–24 hours after onset), is recommended to identify patients eligible for endovascular treatment.3,4 Previous studies have demonstrated a strong correlation between infarct core volume and clinical outcomes.5 Overestimation of this volume may result in the exclusion of patients who could potentially benefit from endovascular treatment, because a large infarct core exceeding 70 mL, or a small mismatch volume or ratio in the late window period renders patients ineligible according to the American Heart Association/American Stroke Association guideline.6 More recently trials reported the benefits of endovascular treatment in patients with large infarct core volume of up to 100 mL.7,8 Therefore, accurate quantification of the infarct core volume is clinically important before endovascular treatment.9
Unfortunately, the efficacy to correctly identify the volume of the infarct core in CT perfusion is significantly influenced by various factors, including deconvolution methods,10,11 parameters,12⇓-14 thresholds,15,16 and postprocessing software.13,17 While a relative CBF (rCBF) <30% is commonly used as a threshold and parameter for infarct core volume estimation,1,2 there is no standardization of optimal thresholds and parameters for estimating infarct core volume in patients with acute ischemic stroke. Furthermore, commercially available CT perfusion software packages from different CT vendors exhibit substantial variability in infarct core volume.13,17 These challenges emphasize the need for continued research and standardization of CT perfusion to enhance the reliability and consistency of infarct core volume estimation.
15O-tracer–based PET has been recognized as the standard for the quantitative assessment of CBF and CBV to evaluate brain hemodynamics as well as to estimate the oxygen extraction fraction (OEF) and cerebral metabolic rate of oxygen (CMRO2) to evaluate brain oxygen metabolism.18 Studies have demonstrated that a reduction in CBF with preserved CMRO2 indicates penumbra, whereas reduced CBF and CMRO2 reflect the infarct core in both experimental and human studies.19⇓⇓-22 However, obtaining oxygen metabolism parameters (OEF and CMRO2) through PET presents challenges because of longer scan times, the requirement for an on-site cyclotron, and high costs. Jespersen et al23 introduced a capillary transit-time heterogeneity in the steady state, enabling the generation of CT perfusion–derived oxygen metabolism parameters by using commercially available postprocessing software. The variability in microvascular blood flow and the effectiveness of oxygen extraction can be affected by the persistence of intravascular contrast agent through perfusion-data modeling technique in either CT perfusion or dynamic susceptibility contrast MR imaging.24⇓-26 Studies have demonstrated that the flow pattern in capillaries influences the oxygen extraction from the blood at a given CBF level, thereby influencing the CMRO2.27,28
To date, no study has quantified infarct core volume by using oxygen metabolism parameters in CT perfusion. In this study, we aimed to delineate the infarct core in patients with acute ischemic stroke by using commonly used rCBF <30% and oxygen metabolism parameter of CMRO2 on CT perfusion in comparison with pretreatment DWI-derived infarct core volume.
MATERIALS AND METHODS
Patient Selection
This single-center, retrospective study was approved by the institutional review board of our hospital, and the need for informed consent was waived. First, we retrospectively searched patients who underwent brain CT perfusion in the radiology database, between January 2016 and March 2023 in Seoul National University Hospital. Among them, we enrolled patients who met the inclusion criteria as follows: 1) age >18 years, 2) acute ischemic stroke onset within 24 hours, 3) occlusion in the large vessel of the anterior circulation involving ICA, MCA (M1 or M2 segment), and anterior cerebral artery (A1 or A2 segment), 4) DWI obtained within 90 minutes after CT perfusion, and 5) both imaging modalities performed before endovascular treatment. Patients were excluded if 1) there was an inadequate image quality of CT perfusion and DWI due to severe motion artifacts or 2) CT perfusion source images were incomplete (Fig 1).

Flow chart of patient selection. After exclusion criteria, 76 patients with acute ischemic stroke were included in this study.
Image Acquisition
All CT examinations were performed by using a CT scanner (320-section CT, Aquilion ONE, Canon Medical Systems; and 256-section CT, Revolution Apex, GE HealthCare). The scan parameters were as follows: tube voltage of 80 kVp, tube current of 150 mA, rotation of 0.5 seconds, a field of view of 240 mm, section thickness of 1 mm, and 0.625 mm with z-axis coverage of 16 cm and 14 cm, and a total acquisition time of 64 seconds. All scans were obtained by administration of 50 mL of iodinated nonionic contrast material (Iomeron 400 mL; Bracco) at a rate of 5 mL/s via a power injector, followed by a 30 mL saline flush at the same rate. DWI and apparent diffusion coefficient measurements were performed by using a 3T MR imaging (Discovery MR 750w and Signa Premier, GE HealthCare) with the following parameters: TR, 6000; TE, 73; field of view, 240 × 240; number of slices 38; matrix size, 160 × 160; and section thickness, 3 mm.
Image Processing
CT perfusion images were postprocessed by using commercially available software RAPID (iSchemaView) and Cercare Medical Neurosuite (Cercare Medical). Both CT perfusion analysis packages provided a fully automated perfusion pipeline, including motion correction and detection of the ROI for the arterial input and venous output functions. CBF maps were generated by using the block-circulant singular value decomposition model with RAPID software, and the infarct core volume was defined as brain tissue with rCBF <30%.
To evaluate the oxygen metabolism parameters, the CMRO2 map in CT perfusion was automatically generated by using the Cercare Medical Neurosuite postprocessing software. This software tool employs a parametric model deconvolution method.24,25 The maximum OEF parameter is computed from the estimated transit-time distribution in conjunction with a model for extraction of oxygen from the blood stream as follows23,25:

Where the probability density function of capillary transit times h (t) is modeled by a γ variate. A 3-compartment model was used for oxygen extraction along a single capillary as a function of time, Q (t), including tissue, blood plasma, and hemoglobin. The model assumes normal tissue oxygen tension, PtO2 = 25 mm Hg. The upper limit of the CMRO2 that can be supported for PtO2 = 25 mm Hg. The relationship between CMRO2 and maximum OEF was defined as follows23,25:
 where Ca is defined as the arterial oxygen concentration. Arterial input functions were automatically determined.
The CMRO2 maps were further processed to estimate the infarct core volume. Initially, to obtain masks for each cerebral hemisphere, segmentation of noncontrast brain CT scans was performed by using the Sequence Adaptive Multimodal Segmentation tool within FreeSurfer (version 7.4.2).29 Next, the mean value of CMRO2 in the contralateral intact hemisphere was determined by using the fslstats tool within the FMRIB's Software Library (http://www.fmrib.ox.ac.uk/fsl).30 Subsequently, the infarct core volume was measured in the lesional hemisphere by using CMRO2 values ranging from 20% to 30%, with steps of 1% relative to the contralateral intact region.
The DWI-derived infarct core volume was automatically calculated with an apparent diffusion coefficient threshold of 620 × 10−6 mm2/s31 by using Olea Sphere software (Olea Medical), after automatic motion correction and CSF masking. Semiautomatic analysis of the DWI-derived infarct core volume was performed when necessary. The image analysis was performed by a single investigator (with 4 years of experience in neuroradiology).
Statistical Analysis
Continuous variables were presented as mean values with standard deviations. The Kolmogorov-Smirnov test was used to evaluate normality. The absolute error was calculated as the absolute volume difference between the DWI- and CT perfusion–derived infarct core volumes. The infarct core volume difference was calculated from DWI-derived infarct core volume minus CT perfusion–derived infarct core volume. A Bland-Altman analysis with 95% limits of agreement was performed between CT perfusion and DWI-derived infarct core volume. The optimal threshold of CMRO2 was defined as those that demonstrated the smallest mean absolute error, lowest mean infarct core volume difference, narrowest 95% limits of agreement, and largest intraclass correlation coefficient (ICC) against the DWI-derived infarct core volume. ICC with a 2-way mixed-effects model and absolute agreement was performed.
RESULTS
The demographic and clinical characteristics are shown in Table 1. Seventy-six patients (mean age ± standard deviation, 69 ± 12 years, 43 men) with acute ischemic stroke who met inclusion criteria were enrolled in this study. The mean time from CT perfusion to DWI was 39 ± 17 minutes. The median NIHSS score on admission was 8 (interquartile range, 5–14). The mean onset time to door was 490 ± 379 minutes.
Demographics of the patient population
Optimal Thresholds of rCMRO2 Parameter against DWI-Derived Infarct Core Volume
Table 2 and Fig 2 illustrate the mean infarct core volume and mean absolute error at different thresholds of CT perfusion–derived relative CMRO2 (rCMRO2) compared with DWI-derived infarct core volume. The DWI-derived mean infarct core volume was 37.18 ± 53.62 mL. The smallest mean absolute error was estimated at 15.83 ± 20.73 mL for rCMRO2 <24%. On the other hand, among the different thresholds of rCMRO2 parameter, rCMRO2 <26% and DWI-derived infarct core volume resulted in the smallest lowest volumetric bias (1.96 mL, 95% limits of agreement: −46.45 to 50.38) and largest ICC (0.936, 95% confidence interval: 0.899–0.959) (Table 3).

The mean infarct core volume difference and mean absolute error between DWI-derived and CT perfusion CMRO2–derived infarct core volume. The DWI-derived infarct core volume was 37.18 ± 53.62 mL. The mean absolute error was lower at the threshold of 23%–26% for rCMRO2 parameter against DWI-infarct core volume. On the other hand, the smallest mean infarct core volume difference was found at the threshold of 26% for rCMRO2.
The mean infarct core volume and mean absolute infarct core volume error between CT perfusion and DWI-derived infarct core volume
The Bland-Altman analysis and interclass correlation coefficient between DWI- and CT perfusion–derived infarct core volume
Comparison between Optimal Thresholds of rCMRO2 and Commonly Used rCBF <30%–Derived Infarct Core Volume
The mean infarct core volume was estimated at 23.08 ± 43.14 mL for rCBF <30% and 35.21 ± 46.30 mL for rCMRO2 <26%. The mean absolute error was smaller for rCMRO2 <26% (16.53 mL) than commonly used rCBF <30% (16.56 mL). The volumetric agreement between the infarct core volume estimated by using DWI- and CT perfusion–derived rCMRO2 and rCBF was tested by using Bland-Altman plots (Fig 3 and Table 3). The volumetric bias between DWI and rCMRO2 <26% was 1.96 mL (95% limits of agreement: −46.45 to 50.38) while it was larger in DWI and rCBF <30% with 14.10 mL (95% limits of agreement: −25.84 to 54.04). The ICC analysis showed excellent volumetric agreement in both rCMRO2 <26% (ICC = 0.936, 95% confidence interval: 0.899–0.959) and rCBF <30% (ICC = 0.934, 95% CI: 0.796–0.970).

The Bland-Altman analysis and scatterplots of infarct core volume between CMRO2 and CBF parameters against DWI-derived infarct core volume. Red lines indicate the mean difference with its limits of agreement by using dashed lines. Blue line indicates the linear regression and its 95% prediction interval between the dashed lines. The volumetric bias between DWI and rCMRO2 <26% was 1.96 mL while it was larger in DWI and rCBF <30% with 14.10 mL. The highest correlation was found for rCMRO2 <26 with ICC = 0.936 (95% CI: 0.899–0.959) among different thresholds of rCMRO2 compared with rCBF <30% with ICC = 0.934 (95% CI: 0.796–0.970).
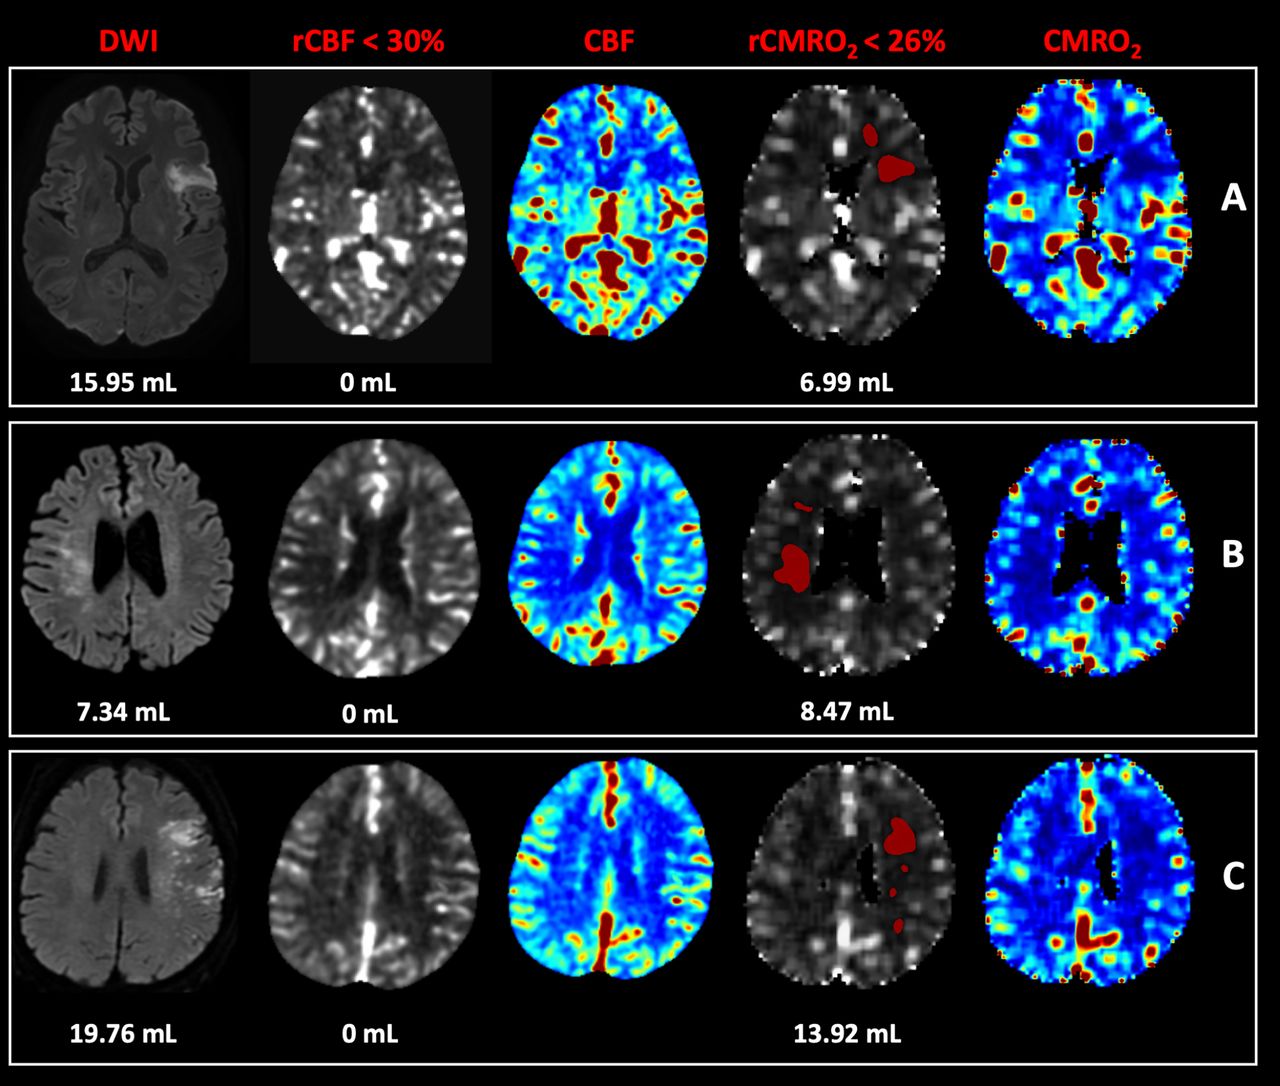
The representative cases for the quantification of infarct core volume by using different parameters (rCMRO2 <26% and rCBF <30%) compared with DWI are shown in Fig 4. The use of rCBF <30% missed identifying the infarct core volume in 40 patients, while rCMRO2 <26% resulted in 0 patients (Fig 5).

Estimation of infarct core volume in patients with acute ischemic stroke. Summary maps of rCMRO2 <26% accurately predicted infarct core volume in 3 different patients than rCBF <30% against DWI-derived infarct core volume in 3 different patients (A–C). A, A 75-year-old man with right M1 segment MCA occlusion, NIHSS = 10, and time duration between CT perfusion and DWI of 49 minutes. B, An 82-year-old man with left M2 segment MCA occlusion, NIHSS = 23, and time duration between CT perfusion and DWI of 40 minutes. C, A 65-year-old woman with left M2 segment MCA occlusion, NIHSS = 10, and time duration between the 2 modalities of 49 minutes.

Representative cases in patients with acute ischemic stroke by using different parameters. The summary map of rCBF <30% does not reveal any infarct core volume in 3 different patients (A–C), whereas the DWI demonstrates the infarct core volume. On the other hand, rCMRO2 <26% quantified infarct core volume superior to rCBF <30%. A, A 56-year-old man with left M2 segment MCA occlusion had a NIHSS score of 6, and the time duration between the 2 modalities was 51 minutes. B, A 72-year-old man with right M2 segment MCA occlusion had an NIHSS score of 6, and the time duration between the 2 modalities was 50 minutes. C, A 74-year-old woman with left M1 segment MCA occlusion, NIHSS score of 17, and time duration between the 2 modalities of 37 minutes.
DISCUSSION
This study aimed to define the infarct core in patients with acute ischemic stroke by using CT perfusion–derived CMRO2. The findings of this study highlight the precise estimation of infarct core volume by using CT perfusion–derived CMRO2 parameter compared with the commonly used CBF parameter. The rCMRO2 <26% predicted accurately infarct core volume compared with rCBF <30% according to the smallest mean absolute error, lowest mean infarct core volume difference, narrowest Bland-Altman analysis, and highest ICC.
CMRO2 and OEF have been measured to evaluate patients with various conditions, such as ischemic stroke, cancer, Alzheimer disease, and traumatic brain injury with PET scan.32⇓-34 Regarding the infarct core, previous studies have demonstrated that levels of CMRO2 <0.87 to 1.7 mL/100 g/min (<23%–55% of normal values) serve as indicative markers of the infarct core.35⇓⇓-38 Touzani et al39 examined rCMRO2 in anesthetized baboons by using PET at different time points after MCA occlusion and found that rCMRO2 <40% was closely associated with the histologic infarction volume up to 24 hours postocclusion. Moreover, Marchal et al37 investigated acute ischemic infarct lesions in 19 patients by using 15O-PET within 5–18 hours after onset and concluded that the CMRO2 threshold of <0.87 mL/100 g/min (<23% of normal value) was highly correlated with hypoattenuation areas observed in later CT scans. Another study supported the use of a low CMRO2 threshold by detecting infarcted penumbra tissues when applying CMRO2 thresholds <1.4 mL/100 g/min.40 Our findings correspond to previous PET studies demonstrating a reduction (<26%) in CT perfusion–derived CMRO2 within the infarct core lesions. Disturbances in cerebral capillary flow, characterized by increased capillary transit time heterogeneity, are attributed to the constriction of cerebral pericytes, erythrocyte clogging, elevated viscosity of white blood cells, and increased production of free oxygen radicals during acute ischemic stroke.27 These increases in capillary transit time heterogeneity lead to reductions in tissue oxygen availability and, consequently, decreases in maximum CMRO2.23,27 Furthermore, it is not surprising that insufficient circulation caused by the occlusion of the cerebral artery with exhausted cerebral perfusion pressure induces irreversible changes in brain tissues, characterized by lower CMRO2.41
Well-known clinical trials have established selection criteria for patients with acute ischemic stroke eligible for endovascular treatment utilizing both CT perfusion and MRI.1,2 In MRI, the infarct core volume is defined based on brain tissue with an apparent diffusion coefficient threshold of <620 × 10−6 mm2/s.31 Meanwhile, CT perfusion relies on a threshold of rCBF <30% for infarct core volume measurements, as observed in previous studies.3,4 Unfortunately, significant variations in measurements were found when these 2 imaging modalities were compared.42 Furthermore, the application of a consistent rCBF threshold for estimating infarct core volume has shown considerable inconsistencies across different postprocessing algorithms.17 PET studies have reported that areas with a higher signal intensity on DWI correspond to normal or preserved CMRO2 levels.43 Additionally, CMRO2 appears to be independent of the time of acute ischemic stroke onset, whereas CBF varies across neuronal populations and depends on the time of symptom onset.21,44 Unfortunately, the use of PET-derived CMRO2 is limited in daily practice due to its need for arterial blood sampling, long scanning time, and technical complexity.18 Despite these inherent limitations, CT perfusion is commonly used as the primary imaging technique for patients with acute ischemic stroke in many stroke centers.
To the best of our knowledge, our study is the first to use the CMRO2 parameter from CT perfusion to estimate the infarct core volume in patients with acute ischemic stroke, followed by a comparison with the volumes from DWI. Interestingly, we found that the estimation with a threshold of rCMRO2 <26% yielded a smaller volumetric bias (1.96 mL versus 14.10 mL) compared with the use of rCBF <30%. Moreover, the infarct core volume was well detected with rCMRO2 <26%, while it was missed with rCBF <30%, aligning with a previous study by Bouslama et al.45
This study had several limitations. Its primary focus was on estimating the infarct core volume in the anterior circulation by using the CT perfusion–derived rCMRO2 parameter in comparison with DWI, and as a result, the study did not address volumetric agreement in the penumbra and acute ischemic stroke in the posterior circulation, which is a limitation. Future investigations are required to explore the impact of penumbral lesions by using the CT perfusion–derived OEF parameter in comparison to the more commonly used Tmax >6 seconds. Additionally, larger cohort studies with follow-up DWI and voxel-by-voxel analysis are needed to establish an accurate threshold for CT perfusion–derived CMRO2 parameters when estimating infarct core volume. Voxel-by-voxel comparisons of the infarct core between CMRO2 and DWI were not feasible in this study because of differences in imaging modalities. Some studies have reported reversible changes in DWI lesion; however, this change occurs more commonly in patients after reperfusion.9,46 The fourth limitation was the absence of volumetric agreement between rCMRO2 <26% and rCBF <38%. While previous studies have recommended a threshold of rCBF <38% over rCBF <30% for predicting infarct core volume,16,47 the rCBF <30% threshold remains commonly used in clinical practice and major randomized clinical trials. Furthermore, the estimation of infarct core volume by using CT perfusion–derived CMRO2 was compared with DWI in all patients before endovascular treatment, with a mean time interval of only 39 minutes. Previous studies have examined the volumetric agreement between the 2 modalities over longer periods or in patients with acute ischemic stroke who underwent endovascular treatment after a delay of >24 hours.48 The relatively short interval between CT perfusion and DWI allows for a more accurate representation of the true infarct core volume without potential confounding factors due to infarct core growth. Infarct core volume can increase by approximately 15–100 mL within the hour.49 Estimation of the infarct core volume derived from CT perfusion is a critical factor in the decision-making process for selecting or excluding patients for endovascular treatment. Despite these limitations, it is important to highlight that CT perfusion–derived CMRO2 effectively provides a more accurate prediction of the infarct core volume in patients with acute ischemic stroke.
CONCLUSIONS
CT perfusion–derived CMRO2 is a promising parameter for estimating the infarct core volume in patients with anterior circulation acute ischemic stroke.
Footnotes
This work was supported by the Korea Medical Device Development Fund grant funded by the Korean government (the Ministry of Science and ICT, the Ministry of Trade, Industry and Energy, the Ministry of Health & Welfare, Republic of Korea, the Ministry of Food and Drug Safety) (Project Number: KMDF_PR_20200901_0098).
Disclosure forms provided by the authors are available with the full text and PDF of this article at www.ajnr.org.
References
- Received March 28, 2024.
- Accepted after revision May 25, 2024.
- © 2024 by American Journal of Neuroradiology


