
Abstract
BACKGROUND AND PURPOSE: Quantitative susceptibility mapping has been proposed to assess intraplaque hemorrhage (IPH) in the carotid artery. The purpose of this study was to compare the diagnostic accuracy of preoperative quantitative susceptibility mapping with that of the conventional T1-weighed 3D-FSE sequence for detecting IPH in cervical ICA stenosis in patients undergoing carotid endarterectomy by using histology as the reference standard.
MATERIALS AND METHODS: Carotid T1-weighted 3D-FSE and QSM images were obtained from 16 patients with cervical ICA stenosis before carotid endarterectomy. Relative signal intensity and susceptibility of the ICA were measured on 3 axial images, including the location of most severe stenosis on T1-weighted 3D-FSE and quantitative susceptibility mapping images, respectively. Three transverse sections of carotid plaques excised by carotid endarterectomy, which corresponded with images on MR imaging, were stained with H&E, antibody against glycophorin A, and Prussian blue, and the relative area of histologic IPH was calculated.
RESULTS: The correlation coefficient was significantly greater between susceptibility and relative area-histologic IPH (ρ = 0.691) than between relative signal intensity and relative area-histologic IPH (ρ = 0.413; P = .0259). The areas under the receiver operating characteristic curves for detecting histologic sections consisting primarily of IPH (relative area-histologic IPH > 40.7%) tended to be greater for susceptibility (0.964) than for T1WI FSE-relative signal intensity (0.811). Marginal homogeneity was observed between susceptibility and histologic sections consisting primarily of IPH (P = .0412), but not between T1-weighted FSE-relative signal intensity and histologic sections consisting primarily of IPH (P = .1824).
CONCLUSIONS: Pre-carotid endarterectomy quantitative susceptibility mapping detects histologic IPH in cervical ICA stenosis more accurately than preoperative T1-weighted 3D-FSE imaging.
ABBREVIATIONS:
- CEA
- carotid endarterectomy
- IPH
- intraplaque hemorrhage
- QSM
- quantitative susceptibility mapping
- RA
- relative area
- ROC
- receiver operating characteristic
- RSI
- relative signal intensity
SUMMARY
PREVIOUS LITERATURE:
Vulnerable atherosclerotic plaques, including intraplaque hemorrhage (IPH) in the carotid artery, are related to subsequent or recurrent cerebrovascular ischemic events. Identification of IPH also may allow stratification of the risks of intraprocedural ischemic events in patients undergoing carotid endarterectomy (CEA) or stent placement. Quantitative susceptibility mapping (QSM) produced from the T2*-weighted magnitude/phase has been used to assess the presence of hemorrhage, iron, and calcification in the brain. A recent ex vivo study showed that QSM for carotid plaque excised by CEA can quantify the degree of histologic intraplaque hemorrhage and iron deposition.
KEY FINDINGS:
The correlation coefficient was significantly greater between susceptibility of carotid plaque on pre-CEA QSM and relative area (RA) of histologic IPH (ρ = 0.691) in excised carotid plaque than between relative signal intensity of carotid plaque on preoperative T1-weighted 3D-FSE imaging and RA-histologic IPH (ρ = 0.413; P = .0259).
KNOWLEDGE ADVANCEMENT:
Pre-CEA QSM detects histologic IPH in carotid artery stenosis more accurately than preoperative T1-weighted 3D-FSE imaging, suggesting that the former may allow more accurate stratification of the risk of further ischemic events for carotid stenosis as well as the risk of embolic events during surgical interventions than the latter imaging.
Vulnerable atherosclerotic plaques in the carotid artery are related to subsequent or recurrent cerebrovascular ischemic events1 and often contain intraplaque hemorrhage (IPH).1,2 For patients with symptomatic and severe stenosis of the cervical ICA, carotid endarterectomy (CEA) or carotid artery stent placement can effectively prevent further stroke.3,-,5 Identification of IPH in carotid plaques is reportedly useful for specifying revascularization candidates who would be better candidates for CEA than for carotid artery stent placement, as carotid plaques consisting primarily of IPH are associated with increased rates of adverse events, such as intraoperative procedure-related cerebral infarction among patients undergoing carotid artery stent placement, but not CEA.6 In terms of CEA, the intraoperative development of emboli is also strongly associated with vulnerable carotid plaques primarily comprising IPH.7,8 In such situations, early clamping of the common and external carotid arteries before exposure of the ICA with fragile plaque consisting primarily of IPH prevents the development of new postoperative ischemic events due to embolism.9 In terms of carotid artery stent placement for vulnerable carotid plaques consisting primarily of IPH, balloon occlusion of the common and external carotid arteries as compared with filter protection for the ICA distal to the stenotic lesion reduces the risk of cerebral embolism.10,11 Identification of IPH may thus allow stratification of the risks of intraprocedural ischemic events in patients undergoing CEA or carotid artery stent placement.
IPH is generally assessed by using MR imaging based on T1-weighted sequences, such as cardiac-gated black-blood FSE, MPRAGE, 3D TOF-MRA, and 3D-FSE, because these sequences exploit the T1-shortening induced by the presence of methemoglobin.1,7,12,-,15 However, old chronic IPH may contain iron-rich hemosiderin, which can cause IPH to appear hypointense on T1-weighted images due to strong intravoxel signal dephasing, potentially leading to misdetection of IPH. In addition, the disadvantage of this MR plaque imaging includes displaying only methemoglobin as high signal intensity16 and the need for reference tissue, such as surrounding muscles.
Quantitative susceptibility mapping (QSM) is a postprocessing technique for quantifying magnetic susceptibility from the T2*-weighted magnitude/phase, which is easily obtained by commercial scanners.17 This technique has been used to assess the presence of hemorrhage, iron, and calcification in the brain.18,-,20 A recent ex vivo study showed that QSM for carotid plaque excised by CEA can quantify the degree of histologic intraplaque hemorrhage and iron deposition.21 On the other hand, comparisons between data from preoperative carotid QSM and histologic findings from excised carotid plaque in patients undergoing CEA have been reported only on a preliminary basis.22,23
Given this background, the purpose of the present study was to determine the diagnostic accuracy of preoperative QSM for detecting histologic intraplaque hemorrhage in cervical ICA stenosis by way of comparison with findings from preoperative T1-weighted 3D-FSE imaging in patients undergoing CEA.
MATERIALS AND METHODS
The protocol for the present prospective observational study was reviewed and approved by our institutional ethics committee. Written, informed consent was obtained from all participants or their next of kin before the study began.
Patients
Patients who underwent CEA at our hospital and met the following inclusion criteria were prospectively enrolled: 1) symptomatic (ischemic episodes present ≥2 weeks and <6 months before the patient visited our institution) ipsilateral ICA stenosis ≥70% or asymptomatic ipsilateral ICA stenosis ≥80%, as defined by the NASCET in association with DSA via arterial catheterization, and 2) a mRS score of 0–2 before surgery. Patients who satisfy the above criteria usually undergo CEA rather than carotid artery stent placement at our institute.
MR Plaque Imaging and Data Processing
MR imaging for cervical ICA stenosis was performed by using a 3T MR imaging scanner (Signa Architect, GE Healthcare) with a 19-channel head neck coil within 7 days before surgery. First, carotid plaque imaging was obtained by using a sagittal T1-weighted 3D-FSE sequence with variable flip angle and the following scan parameters: TR, 500 ms; TE, 10 ms; echo-train length, 14; FOV, 256 × 256 mm2; acquisition matrix size, 224 × 224; image matrix size, 512 × 512; section thickness, 1.4 mm; voxel size after zero-fill interpolation, 0.5 × 0.5 × 0.7 mm3; scan time, 1 minute 59 seconds. The location of most severe stenosis in the ICA ipsilateral to the scheduled CEA was visually determined on T1-weighted 3D-FSE images.
Subsequently, source data of carotid plaque imaging for QSM were also obtained with a 3D radiofrequency–spoiled gradient-echo sequence by using the same 3T MR imaging scanner; the parameters except TE and matrix were as follows: TR, 56 ms; flip angle, 15°; FOV, 200 × 200 mm2; section thickness, 1.0 mm; and parallel imaging factor, 1.5. Imaging covered from 20 mm proximal to 20 mm distal from the location of most severe stenosis as determined on T1-weighted 3D-FSE images. Eight patients were preliminarily scanned to determine optimal TEs (3.1/6.1/9.0/12.0/15.0/17.9 ms), number of excitations (1), and acquisition matrix size (200 × 200) (Online Supplemental Data). Final voxel size and scan time were 0.39 × 0.39 × 0.5 mm3 after zero-fill interpolation and 3 minutes and 59 seconds, respectively. QSM images were generated from magnitude and phase images of all TEs through the following reconstruction techniques. First, region-growing phase unwrapping and phase averaging with magnitude weighting were performed on phase images. Regularization-enabled sophisticated harmonic artifact reduction for phase data was then performed as a background field removal.24 For dipole inversion, least-squares estimation with adaptive edge-preserving filtering was used.25 We implemented in-house codes (Fujifilm Healthcare) to semiautomatically calculate final QSM images for objectively obtaining all images by using SPM12 (https://www.fil.ion.ucl.ac.uk/spm/) and Matlab (MathWorks). The implemented codes are not publicly available, but the present procedures were undertaken in accordance with descriptions in previous studies.26,27
In addition to a reformatted axial image at the location of most severe stenosis in the ICA, reformatted axial images at 5 mm proximal and 5 mm distal from the location of most severe stenosis were also generated on T1-weighted 3D-FSE images. One examiner (D.O.) blinded to patient information manually traced the circumference of the ICA and adjacent sternomastoid muscle on these 3 reformatted axial images for each patient (Figs 1 and 2).

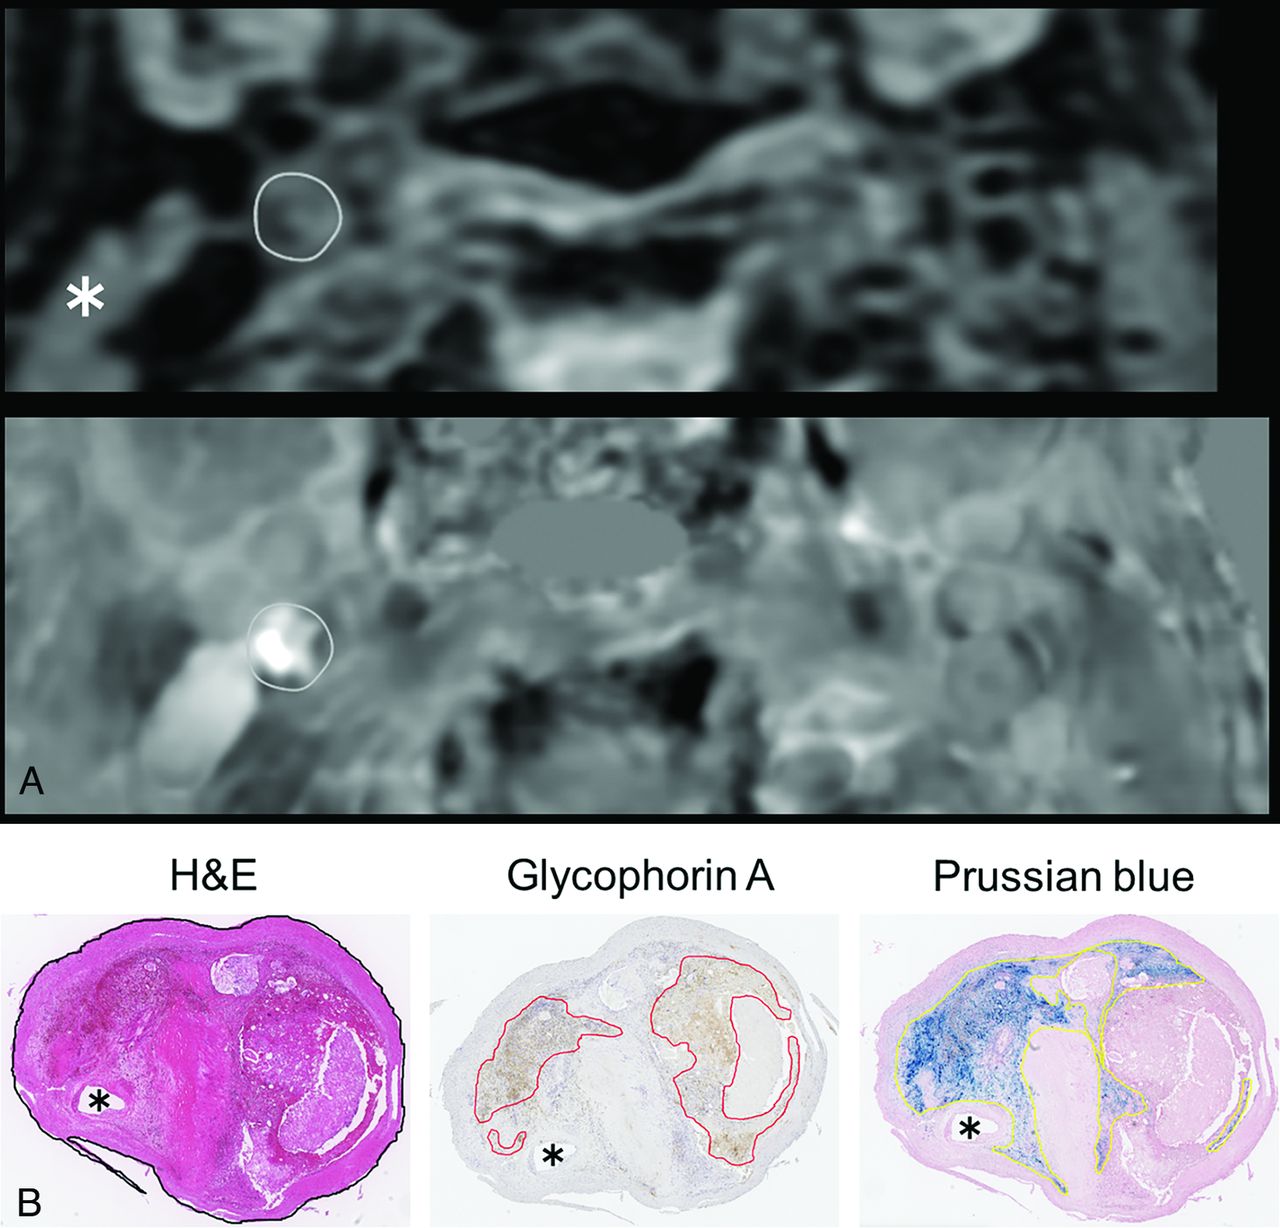
Preoperative reformatted axial MR images with the location of most severe stenosis in the right cervical ICA and histologic transverse sections of carotid plaques excised by carotid endarterectomy from a 61-year-old man with minor strokes complicated by left-sided hemiparesis. A, Whereas signal intensity of the plaque in the right cervical ICA (gray circle) appears equal to that of the sternocleidomastoid muscle (white asterisk) on T1-weighted 3D-FSE image (upper image), its susceptibility (gray circle) is obviously high when compared with that of the background on quantitative susceptibility mapping (lower image). B, Left, middle, and right images represent histologic sections stained with H&E, antibody against glycophorin A, and Prussian blue, respectively. The circumference of the whole plaque is traced with a black line on a histologic section stained with H&E (left image). Areas positive for antibody against glycophorin A (middle image) and Prussian-blue staining (right image) are also traced with red and yellow lines, respectively. Each black asterisk indicates a true lumen of the ICA.

Preoperative reformatted axial MR images with the location of most severe stenosis in the right cervical ICA and histologic transverse sections of carotid plaques excised by carotid endarterectomy for a 77-year-old man with minor strokes complicated by left-sided hemiparesis. A, Signal intensity of the plaque in the right cervical ICA (white circle) appears equal to that of the sternocleidomastoid muscle (white asterisk) on T1-weighted 3D-FSE image (upper image). Its susceptibility (gray circle) also appears equal to or lower than that of the background on quantitative susceptibility mapping (lower image). B, Left, middle, and right images represent histologic sections stained with H&E, antibody against glycophorin A, and Prussian blue, respectively. No areas positive for antibody against glycophorin A are observed (middle image). The circumference of the whole plaque is traced as a yellow line on a histologic section stained with H&E (left image). Areas positive for Prussian-blue staining are also traced with black lines (right image). Each black asterisk indicates a true lumen of the ICA.
When tracing the circumference of the ICA, the true lumen was included. Signal intensities of the ICA and adjacent sternomastoid muscle were measured on each reformatted axial image by using OsiriX MD (Pixmeo). Images were randomized, and the ICA and muscle were traced 3 times on each reformatted axial image. The resulting signal intensity values were averaged, then the average signal intensity of the ICA was divided by that of the muscle on each reformatted axial image. This value was defined as the T1-weighted, FSE-relative signal intensity (RSI).
Three reformatted axial images from T1-weighted 3D-FSE images were automatically transferred to QSM, and 3 ROIs on the ICA traced on T1-weighted 3D-FSE images were automatically superimposed on QSM for each patient. The susceptibility value was measured in each ROI of the ICA (Figs 1 and 2).
Intraoperative Management and Histologic Analysis for Carotid Plaque
CEA was performed under general anesthesia. Intraoperative transcranial Doppler monitoring (EME Pioneer TC2020 system, Nicolet Vascular) was performed for insonation of the middle cerebral artery ipsilateral to the carotid artery undergoing CEA.12 When microembolic signals were observed on transcranial Doppler during exposure of the carotid arteries, early clamping of the common and external carotid arteries was performed.9 Based on the results of intraoperative electroencephalography with a 12-channel montage, some patients received placement of an intraluminal shunt.28
Carotid plaque was excised en bloc without cutting into the plaque and was fixed in 10% neutral-buffered formalin solution. The location of most severe stenosis determined on T1-weighted 3D-FSE images was visually identified on the exterior of the specimen by comparing the shape on T1-weighted 3D-FSE images with that of the specimen. Locations 5 mm proximal and 5 mm distal from the location of most severe stenosis were also determined on the exterior of the specimen. Next, the specimen was embedded in paraffin and transverse 3-µm-thick sections of the specimen were carefully cut in the above-mentioned 3 locations. These 3 transverse sections in each plaque were stained with H&E, antibody against glycophorin A, sialoglycoprotein on the erythrocyte membrane to detect erythrocytes, and Prussian blue to visualize ferric iron (Fe3+) to identify hemosiderin deposits indicative of chronic hemorrhage. Stained sections of the specimen were transferred to a virtual slide system (Aperio Digital Pathology, Leica Biosystems), and all subsequent procedures were performed on this system.
One pathologist (R.S.) blinded to patient information manually traced the circumference of the whole plaque on a histologic section stained with H&E and automatically quantified the area of the whole plaque by using image analysis software (Aperio ImageScope, Leica Biosystems) (Figs 1 and 2). When tracing the circumference of the whole plaque, the true lumen was included (Figs 1 and 2). The same pathologist also manually traced the circumferences of areas positive for Prussian blue or antibody against glycophorin A, respectively, and quantified these areas in the same fashion (Figs 1 and 2). In addition, in the same histologic section, circumferences of areas positive for both Prussian blue and antibody against glycophorin A were manually traced and the areas were automatically quantified. Finally, in each histologic section, the relative area of histologic IPH (RA-histologic IPH) (%) was calculated as follows: 100 × (areas positive for Prussian blue plus areas positive for antibody against glycophorin A minus areas positive for both)/area of the whole plaque. Any histologic section showing RA-histologic IPH >40.7% was defined as plaque consisting primarily of IPH.12
RESULTS
A total of 24 patients were included in the present study: 8 patients served to determine optimal parameters for preoperative QSM plaque imaging of cervical ICA, and the remaining 16 patients underwent preoperative QSM plaque imaging by using optimally determined parameters and histologic analysis of the excised carotid plaque.
These 16 men had a mean age of 72 ± 6 years (range, 61–80 years). Twelve patients had ipsilateral carotid territory symptoms, and 4 had asymptomatic ICA stenosis. Mean ICA stenosis was 89% ± 8% (range, 75%–95%). Three reformatted axial images including the locations of most severe stenosis and 5 mm proximal and distal from the location of most severe stenosis were obtained from T1-weighted 3D-FSE images and QSM in all 16 patients. Three histologic sections corresponding to reformatted axial images on T1-weighted 3D-FSE were obtained from 15 patients. In the remaining patient, the distance between the location of most severe stenosis and the distal end of the plaque was 3 mm, so only 2 histologic sections (the location of most severe stenosis and 5 mm proximal to the location of most severe stenosis) were obtained. Forty-seven reformatted axial images and histologic sections were thus analyzed.
A significant positive correlation was observed between RA-histologic IPH and T1WI FSE-RSI (ρ = 0.413; P = .0052) or susceptibility (ρ = 0.691; P < .0001) for the 47 images and sections (Fig 3).

Comparisons of RA-histologic IPH and T1-weighted FSE-RSI (left graph) or susceptibility on quantitative susceptibility mapping (right graph) for each histologic section and each MR image. Each vertical dotted line denotes the cutoff point for indicating a histologic section consisting primarily of IPH (40.7% for RA-histologic IPH), and each horizontal dotted line denotes the cutoff point lying closest to the upper left corner of the receiver operating characteristic curve for detecting a histologic section consisting primarily of IPH (1.90 for T1-weighted FSE-RSI, 115.7 for susceptibility).
The latter coefficient was significantly greater than the former (P = .0259). Because ranges of values differed considerably among the 3 groups (0–53.6 for RA-histologic IPH; 0.63–2.56 for T1-weighted FSE-RSI; −302.5–365.4 for susceptibility), each value was standardized by using the following formula: (a value minus mean of the referenced group)/standard deviation of the referenced group. Bland-Altman analysis was performed by using these standardized values (Online Supplemental Data). No constant bias was detected for RA-histologic IPH and T1-weighted FSE-RSI (95% CI of difference, −2.10–2.10) or susceptibility (95% CI of difference, −1.46–1.46). Further, no proportional bias was identified for RA-histologic IPH and T1-weighted FSE-RSI (slope-of-regression equation, 0.04) or susceptibility (slope-of-regression equation, −0.04). Generalized linear mixed-effects models with a subject random intercept revealed a significant relationship between RA-histologic IPH and T1-weighted FSE-RSI (P < .05) or susceptibility (P < .05).
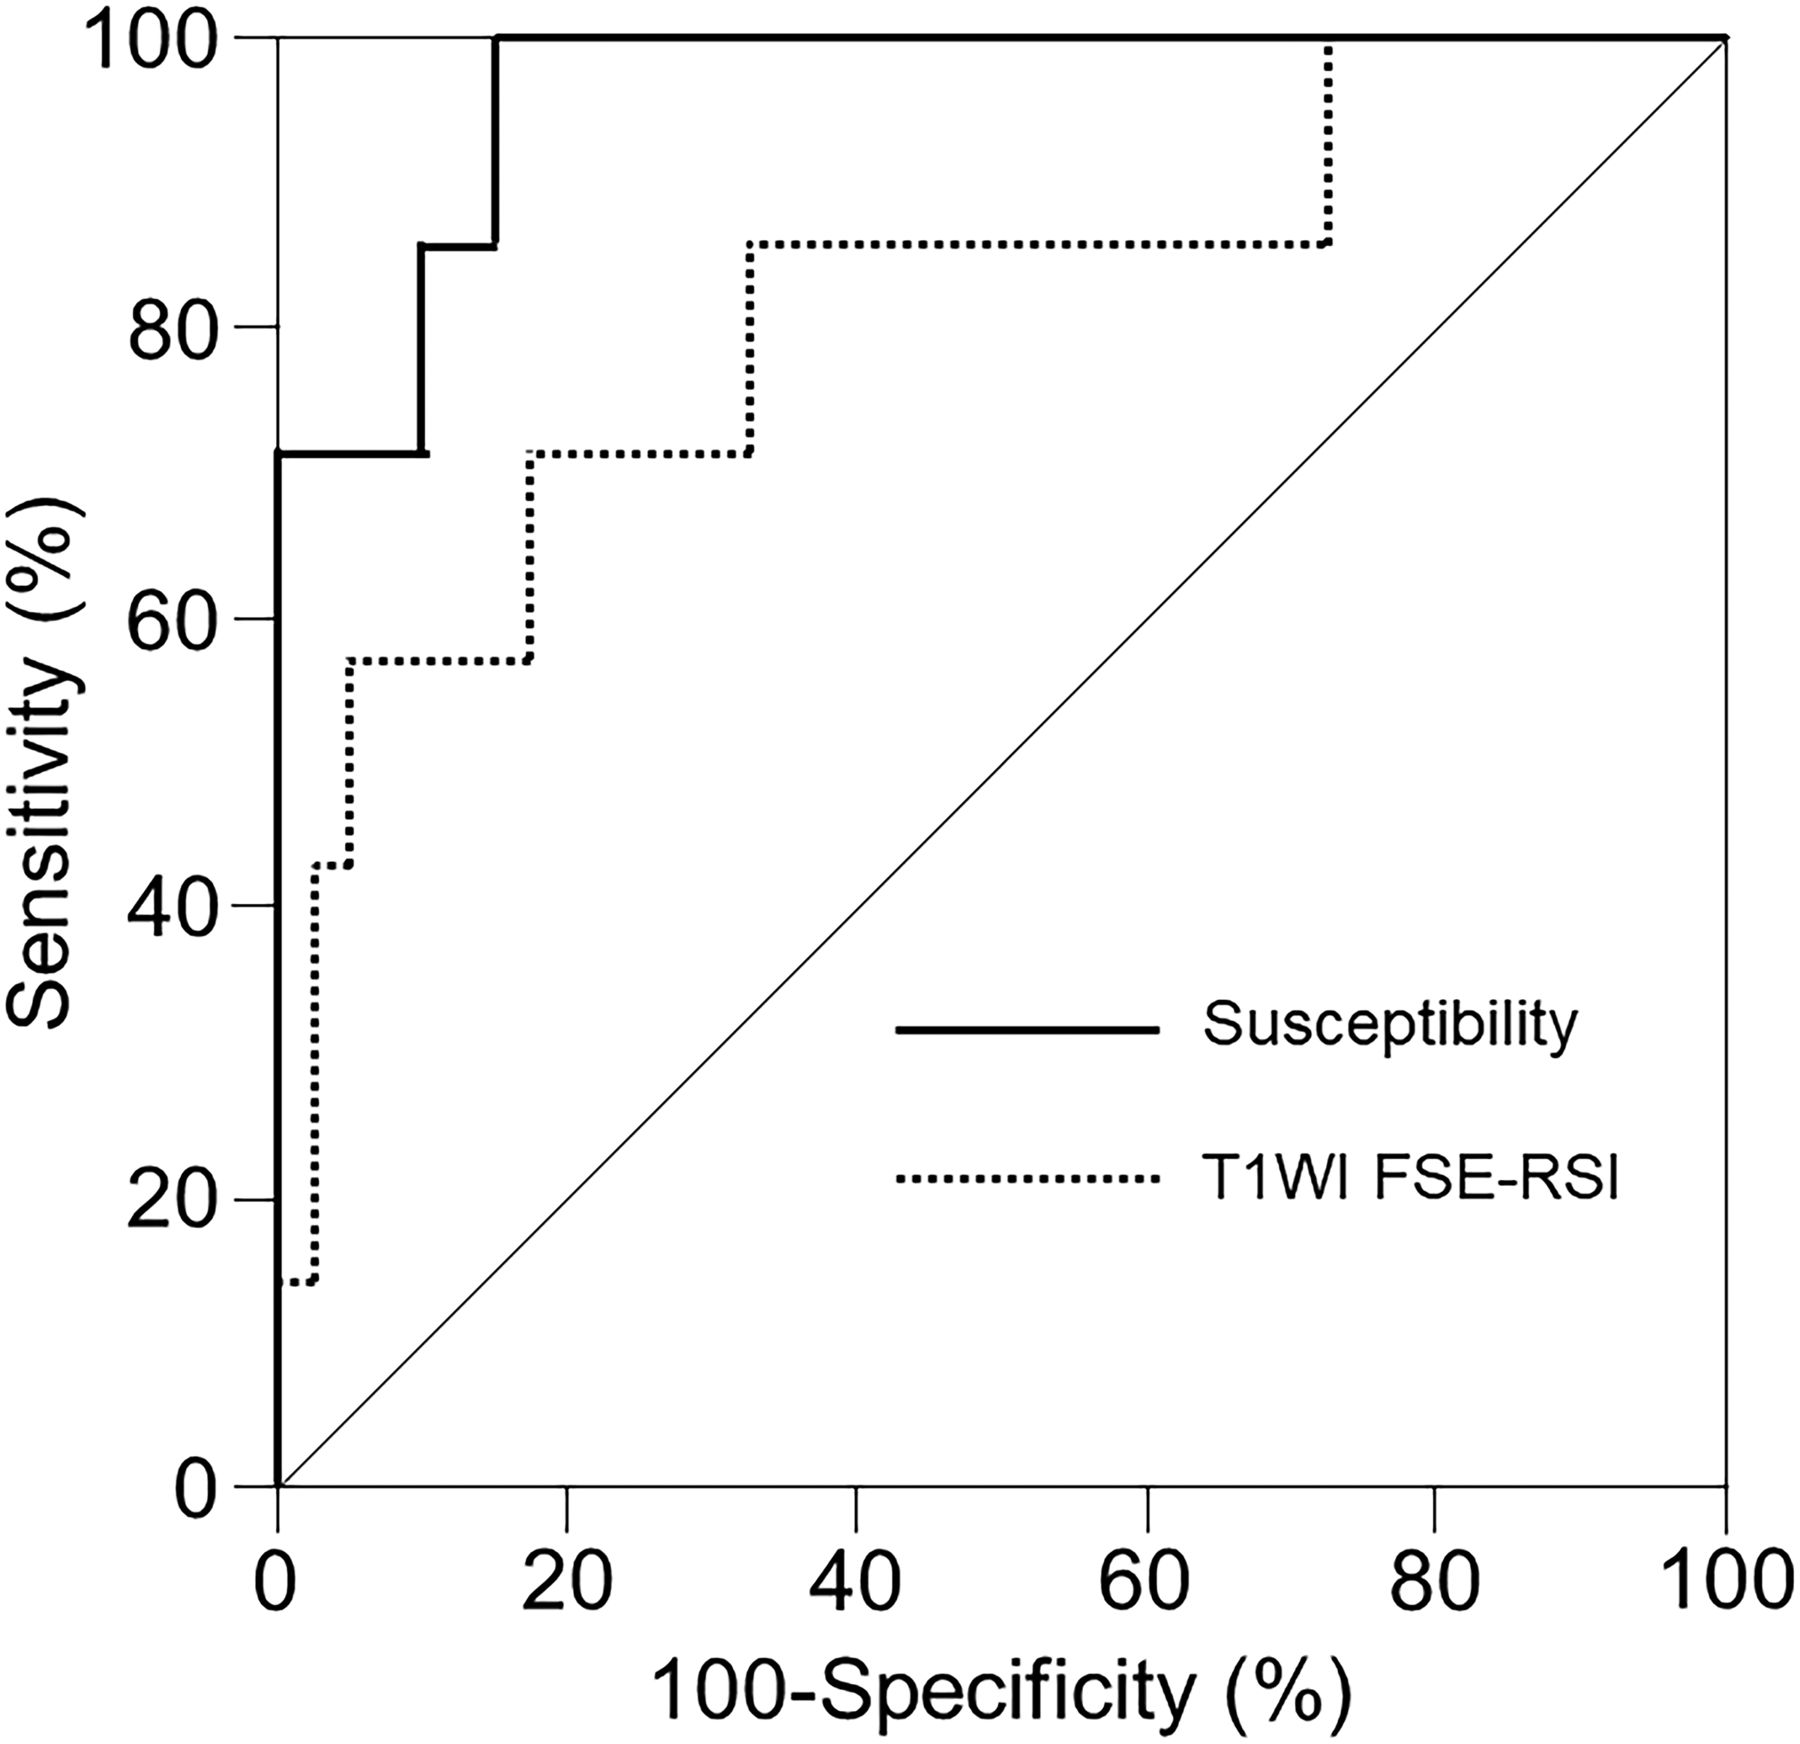
Of the 47 histologic sections analyzed, 7 (15%) were determined to show plaque consisting primarily of IPH. Areas under the receiver operating characteristic (ROC) curves for histologic sections consisting primarily of IPH tended to be greater for susceptibility (0.964; 95% CI, 0.910–1.000) than for T1-weighted FSE-RSI (0.811; 95% CI, 0.607–1.000), although areas did not differ significantly between the two (difference between areas, 0.154; P = .0820) (Fig 4).

Receiver operating characteristic curves used to compare the accuracy of T1WI FSE-RSI and susceptibility for detecting a histologic section consisting primarily of IPH. Areas under the curves tend to be greater for susceptibility (solid line) than for T1-weighted FSE-RSI (dotted line), although pair-wise comparison analysis shows no significant difference between the two.
Sensitivity, specificity, and positive and negative predictive values for the cutoff point lying closest to the upper left corner of the ROC curve for the detection of histologic sections consisting primarily of IPH were 71%, 83%, 42%, and 94%, respectively, for T1-weighted FSE-RSI (cutoff, 1.90) and 100%, 85%, 54%, and 100%, respectively, for susceptibility (cutoff, 115.7 ppb). Marginal homogeneity was observed between histologic sections consisting primarily of IPH and susceptibility (P = .0412), but not between histologic sections consisting primarily of IPH and T1-weighted FSE-RSI (P = .1824).
DISCUSSION
The results of this study demonstrated that pre-CEA QSM can detect histologic intraplaque hemorrhage in cervical ICA stenosis more accurately than preoperative T1-weighted FSE imaging among patients undergoing CEA.
Five distinct stages of hemorrhage can be defined: hyperacute (intracellular oxyhemoglobin); acute (intracellular deoxyhemoglobin); early subacute (intracellular methemoglobin); late subacute (extracellular methemoglobin); and chronic (ferritin and hemosiderin).16 The short T1 of methemoglobin is due to the paramagnetic dipole-dipole interaction, and MR imaging based on T1-weighted sequences such as T1-weighted FSE displays only methemoglobin before and after red cell lysis as high signal intensity.16 The magnetic susceptibility effect is responsible for the short T2 observed when deoxyhemoglobin, methemoglobin, or hemosiderin exists intra- or extracellularly.16 This T2 shortening due to magnetic susceptibility effects is enhanced on higher-field-strength systems and on the gradient-echo images used in the present study.16 QSM is thus theoretically superior to T1-weighted FSE on 3T MR imaging for detecting IPH that may comprise oxyhemoglobin, deoxyhemoglobin, methemoglobin, and/or hemosiderin. Our results were compatible with this hypothesis. On the other hand, antibody against glycophorin A staining is used to detect the erythrocyte membrane rather than iron, suggesting that antibody against glycophorin A staining may reflect oxyhemoglobin, deoxyhemoglobin, and methemoglobin before red cell lysis. Prussian-blue staining visualizes only hemosiderin deposits. Even a combination of these 2 stains may not reflect extracellular methemoglobin. Differences among staining by these methods represented the most serious limitations in the present study. Whereas Wang et al23 also showed a significant correlation between QSM-detected and histologic IPH areas in patients with carotid stenosis, IPH areas detected by QSM and T1-weighted FSE showed good agreement between the 2 methods (Online Supplemental Data). Differences between the latter results and our data may be attributable to methodologic differences, such as determination of the presence and area of IPH on QSM or T1-weighted FSE.
A previous study compared the development of transcranial Doppler-based microembolic signals during exposure of the carotid arteries in carotid endarterectomy with the percentage area of IPH in the carotid plaque and showed that the cutoff point lying closest to the left upper corner of the ROC curve for the percentage area of IPH in predicting the development of microembolic signals was 40.7%.12 Based on that finding, we defined histologic sections showing RA-histologic IPH >40.7% as consisting primarily of IPH. Based on this, the sensitivity and specificity for predicting carotid plaque consisting primarily of IPH were significantly greater for QSM than for T1-weighted FSE, and both the sensitivity and negative predictive value of QSM for such predictions were 100%. These data suggested that carotid plaque imaging by using QSM may allow more accurate stratification of the risk of further ischemic events for patients with cervical carotid stenosis, as well as the risk of embolic events during surgical interventions for cervical carotid stenosis, than imaging by using T1-weighted FSE. Based on these data, we propose the following practical clinical algorithm for determining whether carotid artery stent placement or CEA is indicated: when susceptibility on the stenotic lesion of the affected carotid artery exceeds the cutoff (115.7 ppb), the stenotic lesion is determined to consist primarily of IPH and, in principle, CEA is recommended over carotid artery stent placement. In CEA for such lesions, early clamping of the common and external carotid arteries before exposure of the ICA is recommended. When carotid artery stent placement is applied for such lesions, balloon occlusion of the common and external carotid arteries rather than filter protection for the ICA distal to the stenotic lesion is recommended.
QSM clearly displays hemorrhage, iron, and calcification but does not depict other tissues.18⇓–20 For this reason, carotid plaque cannot always be identified on QSM alone. In the present study, the location of carotid plaque was visually identified on T1-weighted 3D-FSE images and QSM of the identified carotid plaques was performed. An additional scan time of 2 minutes (total scan time, 6 minutes) is thus needed for the detection of IPH in cervical ICA stenosis by using QSM.
In addition to the limitations already listed above, some other issues need to be kept in mind when interpreting our results. First, the number of patients included in this study was quite small. Second, carotid plaque usually comprises lipid-rich necrotic core, fibrous tissue, and calcifications other than IPH. Regions of interest in the ICA might include calcifications that are displayed as hypointensity on QSM due to their diamagnetic properties. This characteristic of calcifications may reduce the accuracy of detecting IPH by using QSM. However, calcifications on histologic sections reportedly tend to be smaller than the voxel size of 0.2 × 0.2 × 1.0 mm3 on QSM images.21 The voxel size on QSM images in the present study (0.39 × 0.39 × 0.5 mm3) was similar, and paramagnetic hemoglobin or hemosiderin or both may exert stronger effects than diamagnetic calcifications. Third, the location of most severe stenosis determined on T1-weighted 3D-FSE images was visually identified from the exterior of the specimen excised in CEA by comparing the shape of the specimen with that on T1-weighted 3D-FSE images. Therefore, histologic sections may not have exactly matched the corresponding MR image. Lastly, the circumferences of the ICA and whole plaque were traced manually rather than automatically on reformatted axial MR images and on histologic sections, respectively. Further, both circumferences included the true lumen, which might have minimally affected our data because only patients with severe stenosis of the ICA participated in this study. Whether our findings are applicable for moderate or mild ICA stenosis should be examined in future work.
CONCLUSIONS
Pre-CEA QSM detects histologic intraplaque hemorrhage in cervical ICA stenosis more accurately than preoperative T1-weighted FSE imaging in patients undergoing CEA. The practical clinical algorithm for determining whether carotid artery stent placement or CEA is indicated based on this finding may reduce the incidence of development of intraoperative embolism or intraoperative procedure-related cerebral infarction.
Footnotes
This study was funded by Grant-in-Aids for Scientific Research from the Japan Society for the Promotion of Science (21K09108 and 21K09157).
Disclosure forms provided by the authors are available with the full text and PDF of this article at www.ajnr.org.
References
- Received February 28, 2024.
- Accepted after revision May 21, 2024.
- © 2024 by American Journal of Neuroradiology


Jump to section
Related Articles
Cited By...
- No citing articles found.