
Abstract
BACKGROUND AND PURPOSE: Menière disease (MD) manifests in 2 major endotypes: one with a hypoplastic, underdeveloped endolymphatic sac (MD-hp) and the other with a normally developed sac that degenerates over time (MD-dg). Determining the specific endotype in patients is important for predicting disease progression, tailoring patient counseling, and optimizing treatment strategies. Endotype diagnosis involves measuring an angular trajectory of the vestibular aqueduct (ATVA), with an ATVA ≥140° indicative of MD-hp and an ATVA ≤120° of MD-dg. However, assessing the ATVA can be challenging. This study aimed to explore the link between ATVA and the thickness of the retrolabyrinthine bone as an alternative diagnostic measure that could provide differentiation between MD endotypes using CT and MR imaging.
MATERIALS AND METHODS: Retrospective review of CT temporal bone imaging from 32 adult patients with definite MD (60 ears) and 33 age-matched controls without MD or other inner ear symptoms (61 ears) was performed. The ATVA and retrolabyrinthine bone thickness were measured using uniform methodology on standardized axial CT images. Comparative analyses were performed to determine the correlation between ATVA and retrolabyrinthine bone thickness. Additionally, from a separate cohort of 11 patients (22 ears), CT and MR examinations of the temporal bone were retrospectively reviewed for retrolabyrinthine bone thickness measurements, to verify the correlation across the 2 modalities.
RESULTS: The average retrolabyrinthine bone thickness was statistically significantly different between MD endotypes, being a mean of 0.8 (SD, 0.3) mm in patients with MD-hp (ATVA ≥140°) and 2.0 (SD, 0.9) mm in patients with MD-dg (ATVA ≤120°), with a consistent pattern of thin retrolabyrinthine bone in MD-hp and variable thickness in MD-dg. Receiver operating characteristic curve analysis within the MD cohort revealed that a retrolabyrinthine bone thickness ≥1.2 mm effectively rules out MD-hp. Excellent interrater reliability was noted for the retrolabyrinthine measurement, and there was near-perfect correlation between CT and MR measurements.
CONCLUSIONS: Retrolabyrinthine bone thickness proved to be a useful and straightforward alternative marker for distinguishing MD endotypes, being particularly useful for excluding MD-hp. Including information on retrolabyrinthine bone thickness should be considered a routine part of reporting in the context of MD imaging.
ABBREVIATIONS:
- ATVA
- angular trajectory of the vestibular aqueduct
- ES
- endolymphatic sac
- MD
- Menière disease
- MD-dg
- Menière disease degenerative endotype-phenotype
- MD-hp
- Menière disease hypoplastic endotype-phenotype
- RL
- retrolabyrinthine
- ROC
- receiver operating characteristic
- VA
- vestibular aqueduct
SUMMARY
PREVIOUS LITERATURE:
Emerging endotypes among patients with MD can be determined radiologically via the ATVA on CT and MR imaging, allowing refined diagnosis, treatment planning, and disease course prognosis. Specifically, the ATVA distinguishes an underdeveloped (hypoplastic/fetal) endolymphatic sac (patients with MD-hp) from a normally developed but degenerated endolymphatic sac (patients with MD-dg). However, reliably determining ATVA can be challenging, especially on MR imaging. Our research explores the use of RL bone near the vestibular aqueduct as a more reliable surrogate marker for diagnosing MD endotypes and detecting a fetal-oriented VA.
KEY FINDINGS:
RL bone thickness is reliably measured on CT and MR imaging. Mean RL bone thickness for patients with MD-dg and patients with MD-hp were 2.0 mm and 0.8 mm respectively (P < .001). A threshold of 1.2 mm reliably distinguishes between these groups, with thickness ≥1.2 mm ruling out MD-hp.
KNOWLEDGE ADVANCEMENT:
Measuring RL bone thickness on CT or MR imaging can serve as a complementary or alternative method to ATVA measurements, enhancing the accuracy of endotype diagnosis for patients with Menière disease.
The vestibular aqueduct (VA) is a bony channel located in the posterior part of the temporal bone, connecting the vestibule of the inner ear labyrinth to the posterior cranial fossa. In a fully developed temporal bone, the VA displays a configuration resembling a hockey stick in the axial plane: from its opening at the medial wall of the vestibule, the VA extends one-third of its length, then sharply angles at its isthmus and continues parallel to the posterior surface of the temporal bone toward its posterior opening, the operculum. The cross-sectional diameter of the VA gradually increases from the vestibule to the operculum, creating a funnel-like shape. The wider posterior VA portion (two-thirds) is usually visible on CT and often on MR images.1 Notably, the size and shape of this posterior portion vary considerably in adult temporal bones.2⇓-4 Unusually thin, short, straight (not angled), and filament-like VAs have been observed among patients with Menière disease (MD) since the times of radiography and tomography,2,5⇓-7 although the clinical significance of this radiologic finding was unclear at the time. More recently, authors have also described an obliterated or discontinuous VA seen on CT in the context of MD.8⇓-10
Recent studies using histologic and radiologic data from developing (fetal and early postnatal) and mature (adult) temporal bones, including those from patients with MD, demonstrated that about 30%–40% of patients with MD exhibit a fetal-like or underdeveloped VA, which is associated with a hypoplastic endolymphatic sac (ES); these patients belong to the hypoplastic ES endotype-phenotype of MD (MD-hp). This underdeveloped VA in patients with MD does not display the typical hockey-stick-like shape seen in adults but instead mirrors the short, straight configuration seen in fetuses. Thus, the angle of the VA is a key marker of its maturity. Bächinger et al11 introduced a method for measuring the angle between the anterior one-third and posterior two-thirds of the VA on axial temporal bone imaging, known as the angular trajectory of the VA (ATVA). An ATVA ≤120° signifies a normal (angled) VA, whereas an ATVA ≥140° indicates a hypoplastic (straight) VA.
This measurement is clinically important because it allows identification of patients with a hypoplastic endotype (MD-hp), now believed to be linked to developmental or genetic disease causes and more often exhibiting bilateral disease symptoms.12 The ATVA measurement separates patients with MD-hp from those with MD with the degenerative endotype (MD-dg), in whom the endolymphatic sac develops normally but subsequently undergoes degeneration of its lining. In patients with MD-dg, the VA has a normal orientation, with an ATVA ≤120°. Knowing the MD endotype-phenotype aids in assessing the risk of MD manifesting in the unaffected (second) ear and thus influences patient counseling and treatment decision-making. Of note, within their specimens, none displayed an angle between 120° and 140°; as such, currently, there is no histologically verified information on the VA/ES status for individuals with an ATVA in this angle range.
However, accurately measuring the ATVA on CT or MR images can be challenging and requires both expertise and specialized software tools,13 and even with those resources, determining the ATVA may not be feasible, particularly when image resolution is insufficient to resolve, for example, an extremely hypoplastic VA.14 Further research by Bächinger et al15 has demonstrated that in patients with MD with an underdeveloped VA, adjacent structures within the retrolabyrinthine (RL) region of the temporal bone, such as the mastoid air cell tract and the RL bone, are also underdeveloped, suggesting a more widespread developmental pathology in this region. Their findings indicated that the RL bone near the posterior semicircular canal, at its thinnest part, is typically <2 mm thick in the axial plane. A measurement exceeding 2 mm can effectively exclude an underdeveloped endotype and may serve as an additional radiologic marker for classifying patients with MD.
The current study re-evaluates RL bone thickness as a potentially more accessible and reliable surrogate marker than ATVA for identifying patients with MD with a hypoplastic endotype. Especially in MR imaging, the preferred imaging modality for assessing endolymphatic hydrops in patients suspected to have MD, measuring the RL bone thickness may be a more feasible and dependable marker than the ATVA. Advance has been made in recent years in the imaging diagnosis of MD, with the introduction of various types of delayed postcontrast MR images such as 3D FLAIR, 3D real inversion recovery (3D REAL-IR),16 and ZOOMit17 that can demonstrate MD imaging biomarkers such as saccular/vestibular hydrops, cochlear hydrops, and perilymph enhancement.18,19 However, these do not address the underlying MD disease endotypes and histologic associations. Since 2019, groups in Switzerland1 and the Netherlands12 have reported potential uses of VA morphology in the setting of MD to aid in disease endotyping, which has a bearing on the clinical presentation and symptomatology, as well as treatment selection and outcome. In this study, we focused on imaging features that may be helpful in identifying the specific underlying MD endotype-phenotype that reflects the histopathologic state of the ES. It would be impactful for imaging examinations to be able to pinpoint MD disease endotypes (subtypes of disease conditions that are defined by a distinct associated pathophysiologic and histologic mechanism),20 which can contribute to prognostic and therapeutic decision-making for patients with MD.
MATERIALS AND METHODS
This retrospective study received approval from the Massachusetts Eye and Ear/Massachusetts General Brigham Institutional Review Board (IRB Protocol No. 2020P001969).
Part 1: ATVA-RL Bone Thickness Correlation
Participants.
A retrospective review of temporal bone CT studies and medical records was performed for a diverse patient cohort comprising 121 ears. The cohort included the following: 1) 32 adult patients with a clinical diagnosis of definite MD,21 and 2) 33 age-matched adult patients without clinical or audiometric signs of sensorineural or mixed hearing loss, vertigo, dizziness, or aural fullness who underwent temporal bone CT for non-inner ear–related symptoms including otalgia, external auditory canal lesion, and facial palsy. All individuals underwent multidetector or conebeam CT using dedicated temporal bone scan protocols. For individuals with multiple temporal bone CT scans, only the most recent scan was used for data analysis. Imaging for the MD group was conducted between January 2012 and March 2022; for the control group, between January 2020 and December 2021. The ages of the patients at the time of imaging ranged between 18 and 80 years.
CT Imaging Acquisition.
Multidetector CT (Discovery CT750 HD; GE Healthcare) of the temporal bone was performed with 120 kV(peak), 240 mA, FOV = 100 × 100 mm, matrix = 512 × 512, section thickness = 0.6-mm with 0.3-mm overlap. Conebeam CT (3D Accuitomo; J Morita) of the temporal bone was performed with 90-kV(peak), 8-mA, high-resolution mode with an exposure time of 30.8 seconds, FOV = 64 × 64 mm, matrix = 512 × 512, and 0.5-mm section thickness. Standardized axial reformats of all temporal bones were created in a plane parallel to the lateral semicircular canal and used for image analyses. The study by Bächinger et al11 showed that both multidetector and conebeam CT allowed accurate measurement of the ATVA, verified with corresponding histologic sections of the scanned temporal bone specimens. Thus, both CT imaging techniques were permitted on this study.
Image Review.
A neuroradiologist with 7 years of experience (N.S.) and a focus on head and neck imaging, an otologist with 10 years of experience (K-Y.L.), and a head and neck radiologist with 15 years of experience (A.F.J.) underwent a group training period to develop a consistent and reproducible technique for reviewing images and obtaining measurements. The former 2 (N.S. and K-Y.L.) then independently reviewed all imaging studies. The readers were blinded to the original radiology reports, patient demographics, clinical diagnoses, and the other reader’s findings. In cases in which there were meaningful discrepancies (RL: >0.5 mm; ATVA: >15°) in measurements, the third reader (A.F.J.) joined the review process to achieve a consensus measurement with the group.
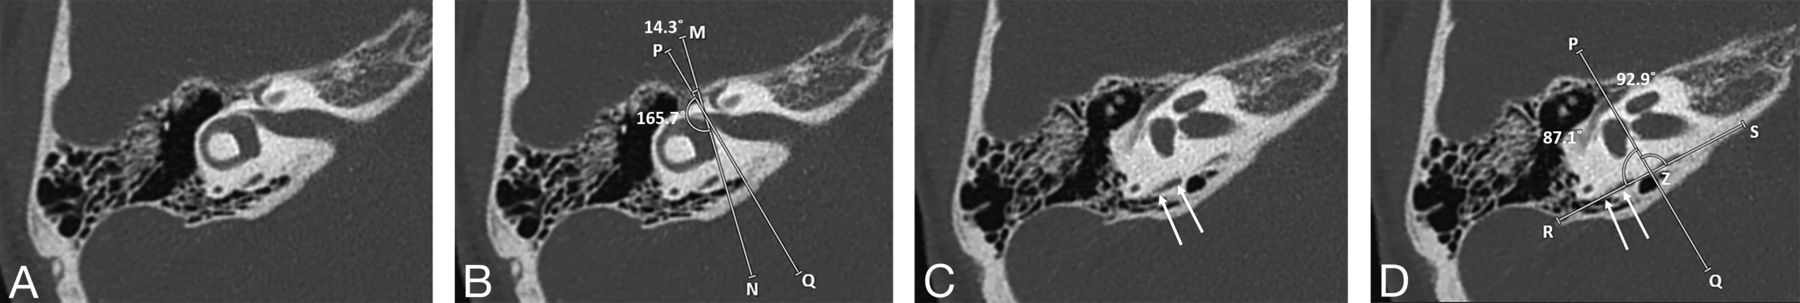
For each ear, the ATVA was assessed on standardized reformatted axial images in the plane of the lateral semicircular canal, with the following methodology as described by Bächinger et al11 (Fig 1). The 2-line angle measurement tool available on PACS (Visage 7; Visage Imaging Inc, Pro Medicus Limited) was used to adhere to the methodology of Bächinger et al and to avoid technical challenges that may relate to use of their proposed software as found by other authors:13
Using the 2-line angle function, 1 line was drawn parallel to the medial border of the vestibule (line MN), and a second line (line PQ) was drawn denoting the trajectory of the proximal/isthmus portion of the VA11 and enclosing a 14.3° angle with line MN. These 2 lines were cross-populated to be displayed on all axial images in the sequence (Fig 1A, -B).
By scrolling through consecutive axial images, the trajectory/long axis of the distal/descending portion of the VA near the operculum was identified. A line was drawn along this long axis of the VA (line RS) and made to be displayed on all axial images in the sequence (Fig 1C, -D).
The angle between line PQ and line RS was recorded. This was the angle made by the VA between its proximal/isthmus and distal/descending segments, termed the ATVA.

A and B, Axial CT image at the level of the vestibule. Line MN is drawn parallel to the medial wall of the vestibule. Line PQ is drawn forming a 14.3° angle with line MN. Line PQ reflects the trajectory of the anterior VA as it enters the vestibule. C and D, Axial CT image at a level that shows the course of the main posterior portion of the VA (double arrows in C and D). Line RS is drawn along the long axis of this main posterior VA segment. Line PQ is propagated to this image, intersecting line RS at point Z. The angle between the 2 lines, ∠PZR, is the ATVA, which in this case is 87.1°.
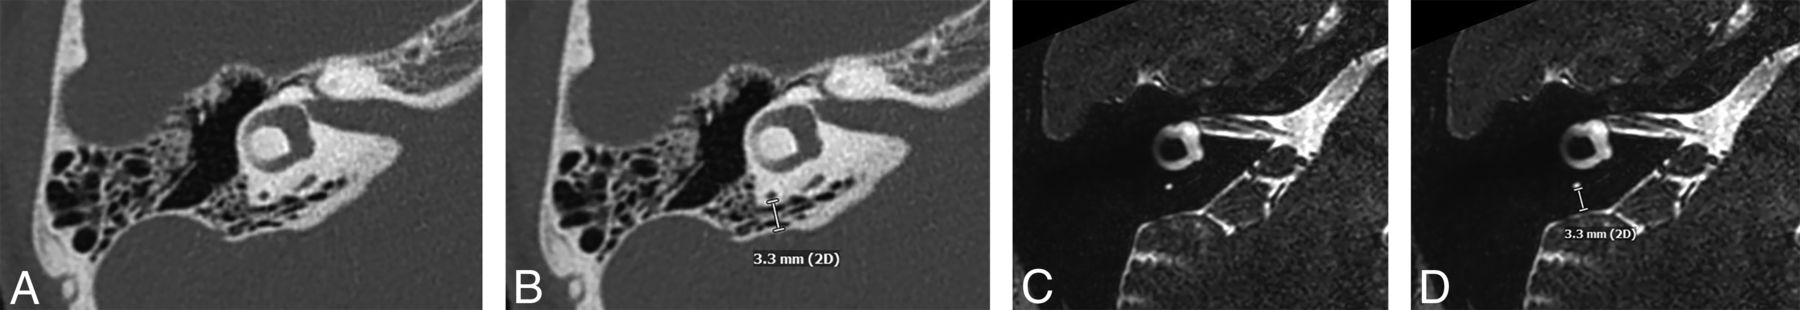
For each ear, the RL bone thickness was assessed on standardized reformatted axial images in the plane of the lateral semicircular canal, with the following methodology (Fig 2):
By scrolling through consecutive axial images, the 1 image that depicted the shortest distance between the posterior semicircular canal posterior bony wall and the posterior petrous ridge was selected (Fig 2A).
This shortest distance between the outer margin of the posterior semicircular canal posterior bony wall and the posterior petrous ridge was measured, along a line perpendicular to the surface of the posterior petrous ridge at that point (Fig 2B). This was the RL bone thickness.

Axial CT image (A) at the level showing the narrowest distance between the posterior margin of the posterior semicircular canal and the posterior petrous ridge is selected. A measurement of this narrowest distance is made by placing a ruler perpendicular to the posterior petrous ridge surface (B). The same is performed on the axial heavily T2-weighted MR image (C and D), reformatted such that the images are parallel to the plane of the lateral semicircular canal, for standardization in the same manner as for CT images.
Data Analysis.
A consensus data set was created for the ATVA and RL bone thickness based on the means of measurement values obtained by N.S. and K.-Y.L. and consensus measurement values from A.F.J. This consensus data set was used in correlation analyses of RL bone thickness and the ATVA measurements.
ATVA and RL bone thickness measurements were examined visually for normality. Descriptive statistics and comparison between the MD group and the control group were reported on the basis of the Wilcoxon Mann-Whitney test. The ATVA and RL bone thickness were analyzed for any correlation. Both the Pearson and Spearman correlation coefficients were reported.
Part 2: Menière Disease Patient Endotypes—Hypoplastic versus Degenerative ES
To determine an optimal cutoff threshold value of RL bone thickness that would help distinguish degenerative from hypoplastic MD endotypes, we divided the consensus ATVA measurements in the 32 patients with a clinical diagnosis of definite MD into 2 groups based on their ATVA values as described by Bächinger et al:11 MD-dg (ATVA of ≤120°) and MD-hp (ATVA of ≥140°). On the basis of this grouping, Wilcoxon Mann-Whitney tests were performed to compare the RL bone thickness between the 2 groups. Receiver operating characteristic (ROC) curves were generated for various RL bone thicknesses, and the optimal threshold value of RL bone thickness that maximizes Youden J statistic22 was determined.
Part 3: Interrater Reliability
The ATVA and RL measurements by readers N.S. and K.-Y.L. before consensus evaluation with A.F.J. were examined for correlation and reliability. The Pearson correlation coefficient was determined between the readers’ measurements. By means of the cutoff threshold value determined in Part 2, the measurements were dichotomized, and the Cohen κ statistic was calculated and reported.
Part 4: CT-MR Correlation
Participants.
MR imaging studies (internal auditory canal protocol) performed between May 1 and August 1, 2023, were reviewed. Patients with CT studies (temporal bone protocol) performed within 6 months of the MR imaging were selected. This step yielded 14 patients. Three were excluded due to motion artifacts on either the CT or MR imaging examination precluding accurate measurement of RL bone thickness, yielding 11 patients (22 ears).
CT and MR Imaging Acquisition.
CT imaging parameters were the same as in Part 1 above. All MR imaging studies were performed on a 3T unit; the high-resolution 3D heavily T2-weighted cisternographic sequence was analyzed (axial T2 3D driven equilibrium radiofrequency reset pulse [DRIVE]; Philips Healthcare). The imaging acquisition parameters for the 3T T2 DRIVE were set as follows: TR, 1700 ms; TE, 190 ms; number of excitations, 3; acquired pixel size in the axial plane, 0.45 × 0.45 mm; spacing, 0.5 mm; matrix, 412 × 337; scan time, 4 minutes 37 seconds. Reformatted axial images in a plane parallel to the lateral semicircular canal were used for analyses to ensure standardization.
Image Review.
For each ear, the RL bone thickness was assessed on CT with the same methodology as above (Fig 2). On MR imaging, multiplanar reformatted images were produced from the 3D heavily T2-weighted sequence to obtain reformatted axial images parallel to the plane of the lateral semicircular canal (Fig 2C). RL bone thickness was obtained using the same methodology as that for measurement on CT images (Fig 2D). Correlation analysis as well as a test of equivalence between measurements obtained on CT and MR were performed. For the latter, 2 one-sided t tests with the Wilcoxon signed-rank test (Wilcoxon TOST) was used, given paired data that did not have a normal distribution. The upper and lower equivalent bounds of the equivalent range were 0.5 and −0.5 mm, respectively, which is commensurate with the order of magnitude that typical PACS measurement calipers can offer.
Statistics.
All statistical analyses were performed using R (http://www.r-project.org/). P values < .05 indicated statistical significance. The Wilcoxon TOST was performed using the TOSTER package (https://cran.r-project.org/web/packages/TOSTER/TOSTER.pdf).
RESULTS
This study included 32 participants with MD and 33 control subjects in the section analyzing the correlation between ATVA and RL bone thickness. The included 32 participants among the MD cohort all fit the Bárány Society criteria for “definite MD,”21 comprising 24 with unilateral MD and 8 with bilateral MD. Of note, 2 of the 32 patients had previously undergone unilateral labyrinthectomy, and in 2 others, the VA was visible on one side but not on the other, resulting in a total of 60 ears in which the VA could be assessed. In the control group, 4 of the 33 individuals underwent unilateral conebeam CT, and in another the VA was visible only on 1 side, leading to a total of 61 ears in which the VA could be assessed. Additionally, 11 participants (22 ears) were included in the portion of the study focused on correlating CT and MR imaging data.
Part 1
Descriptive statistics for consensus RL thickness and ATVA measurements are reported in the Table. Only 1 ear had an ATVA within the range of 120° and 140°; all other ears had ATVA measurements that were either ≤120° or ≥140°. Similarly, all ears in the control group had ATVA measurements within these thresholds.
| MD. Group (n = 60) | Control Group (n = 61) | Overall (n = 121) | |||
|---|---|---|---|---|---|
| Degenerative (n = 47) | Hypoplastic (n = 12) | Indeterminate (n = 1) | |||
| RL (mm) | |||||
| Mean (SD) | 2.0 (0.9) | 0.8 (0.3) | 0.6 (NA) | 2.6 (1.2) | 2.17 (1.17) |
| Median [Min, Max] | 1.8 [0.7, 4.0] | 0.8 [0.6, 1.4] | 0.6 [0.6, 0.6] | 2.4 [0.6, 6.5] | 2.00 [0.550, 6.50] |
| ATVA (degrees) | |||||
| Mean (SD) | 101 (8.76) | 148 (6.33) | 133 (NA) | 103 (12.9) | 107 (17.8) |
| Median [Min, Max] | 100 [82.0, 118] | 147 [141, 160] | 133 [133, 133] | 103 [83.1, 163] | 103 [82.0, 163] |
Note:—NA indicates not applicable; Min, minimum; Max, maximum.
RL bone thickness and ATVA in patients with MD and controls
The mean RL bone thicknesses (in millimeters) for patients with MD with an ATVA ≤120° (MD-dg), patients with MD with an ATVA ≥140° (MD-hp), and controls were 2.0 , 0.8 , and 2.6 mm, respectively. The mean ATVA for patients with MD with an ATVA ≤120° (MD-dg), patients with MD with an ATVA ≥140° (MD-hp), and controls were 101°, 148°, and 103°, respectively.
A scatterplot depicting the relationship between ATVA and RL bone thickness in the main cohort is shown in Fig 3. The Pearson and Spearman coefficients were −0.28 and −0.19, respectively (P values = .002 and .040, respectively). When we examined the subset of patients with MD only, a moderately stronger negative correlation was observed, with Pearson and Spearman coefficients of −0.51 and −0.49, respectively (P values < .001 for both).

Scatterplot of ATVA and RL bone thickness among patients with Menière disease and controls. The horizontal dashed line indicates the optimal RL bone thickness cutoff threshold value of 1.2 mm.
Part 2
Among the cohort of patients with MD (60 ears), 47 ears had the MD-dg endotype-phenotype based on an ATVA ≤120°, and 12 ears had an MD-hp endotype-phenotype based on an ATVA ≥140°. One ear demonstrated an ATVA value of 133°, indeterminate in endotype, because this angle was not observed in a prior histologic-radiologic correlation study.11 A statistically significant difference was seen in RL bone thickness for the MD-dg and MD-hp groups, with mean thicknesses of 2.0 and 0.8 mm, respectively (P value < .001).
The ROC curve was generated using RL bone thickness cutoff values and an MD-dg versus MD-hp grouping (Fig 4). An RL bone thickness threshold of 1.2 mm was determined to be the optimal cutoff value with a specificity of 0.81 and sensitivity of 0.92. A cutoff value of 1.5 mm was associated with a specificity of 0.70 and a sensitivity of 1. A cutoff value of 0.7 mm was associated with a specificity of just below 1 (0.98) and sensitivity of 0.33. The area under the curve was 0.915.

ROC curve among the MD cohort to distinguish between the MD-hp and MD-dg groups. An optimal RL bone thickness cutoff value of 1.2 mm provides a specificity of 0.81 and sensitivity of 0.92. AUC indicates area under the curve.
With an ATVA ≥140°, corresponding to MD-hp, all patients had RL thicknesses < 1.2 mm when measured at the thinnest part of the bone between the posterior semicircular canal and the posterior petrous ridge, with only 1 outlier having an RL thickness of 1.4 mm (Fig 3). With an ATVA ≤120°, corresponding to MD-dg, approximately 81% had RL bone thicknesses of >1.2 mm, with a mean thickness of 2.5 mm (minimum of 1.3 mm, maximum of 4 mm).
Part 3
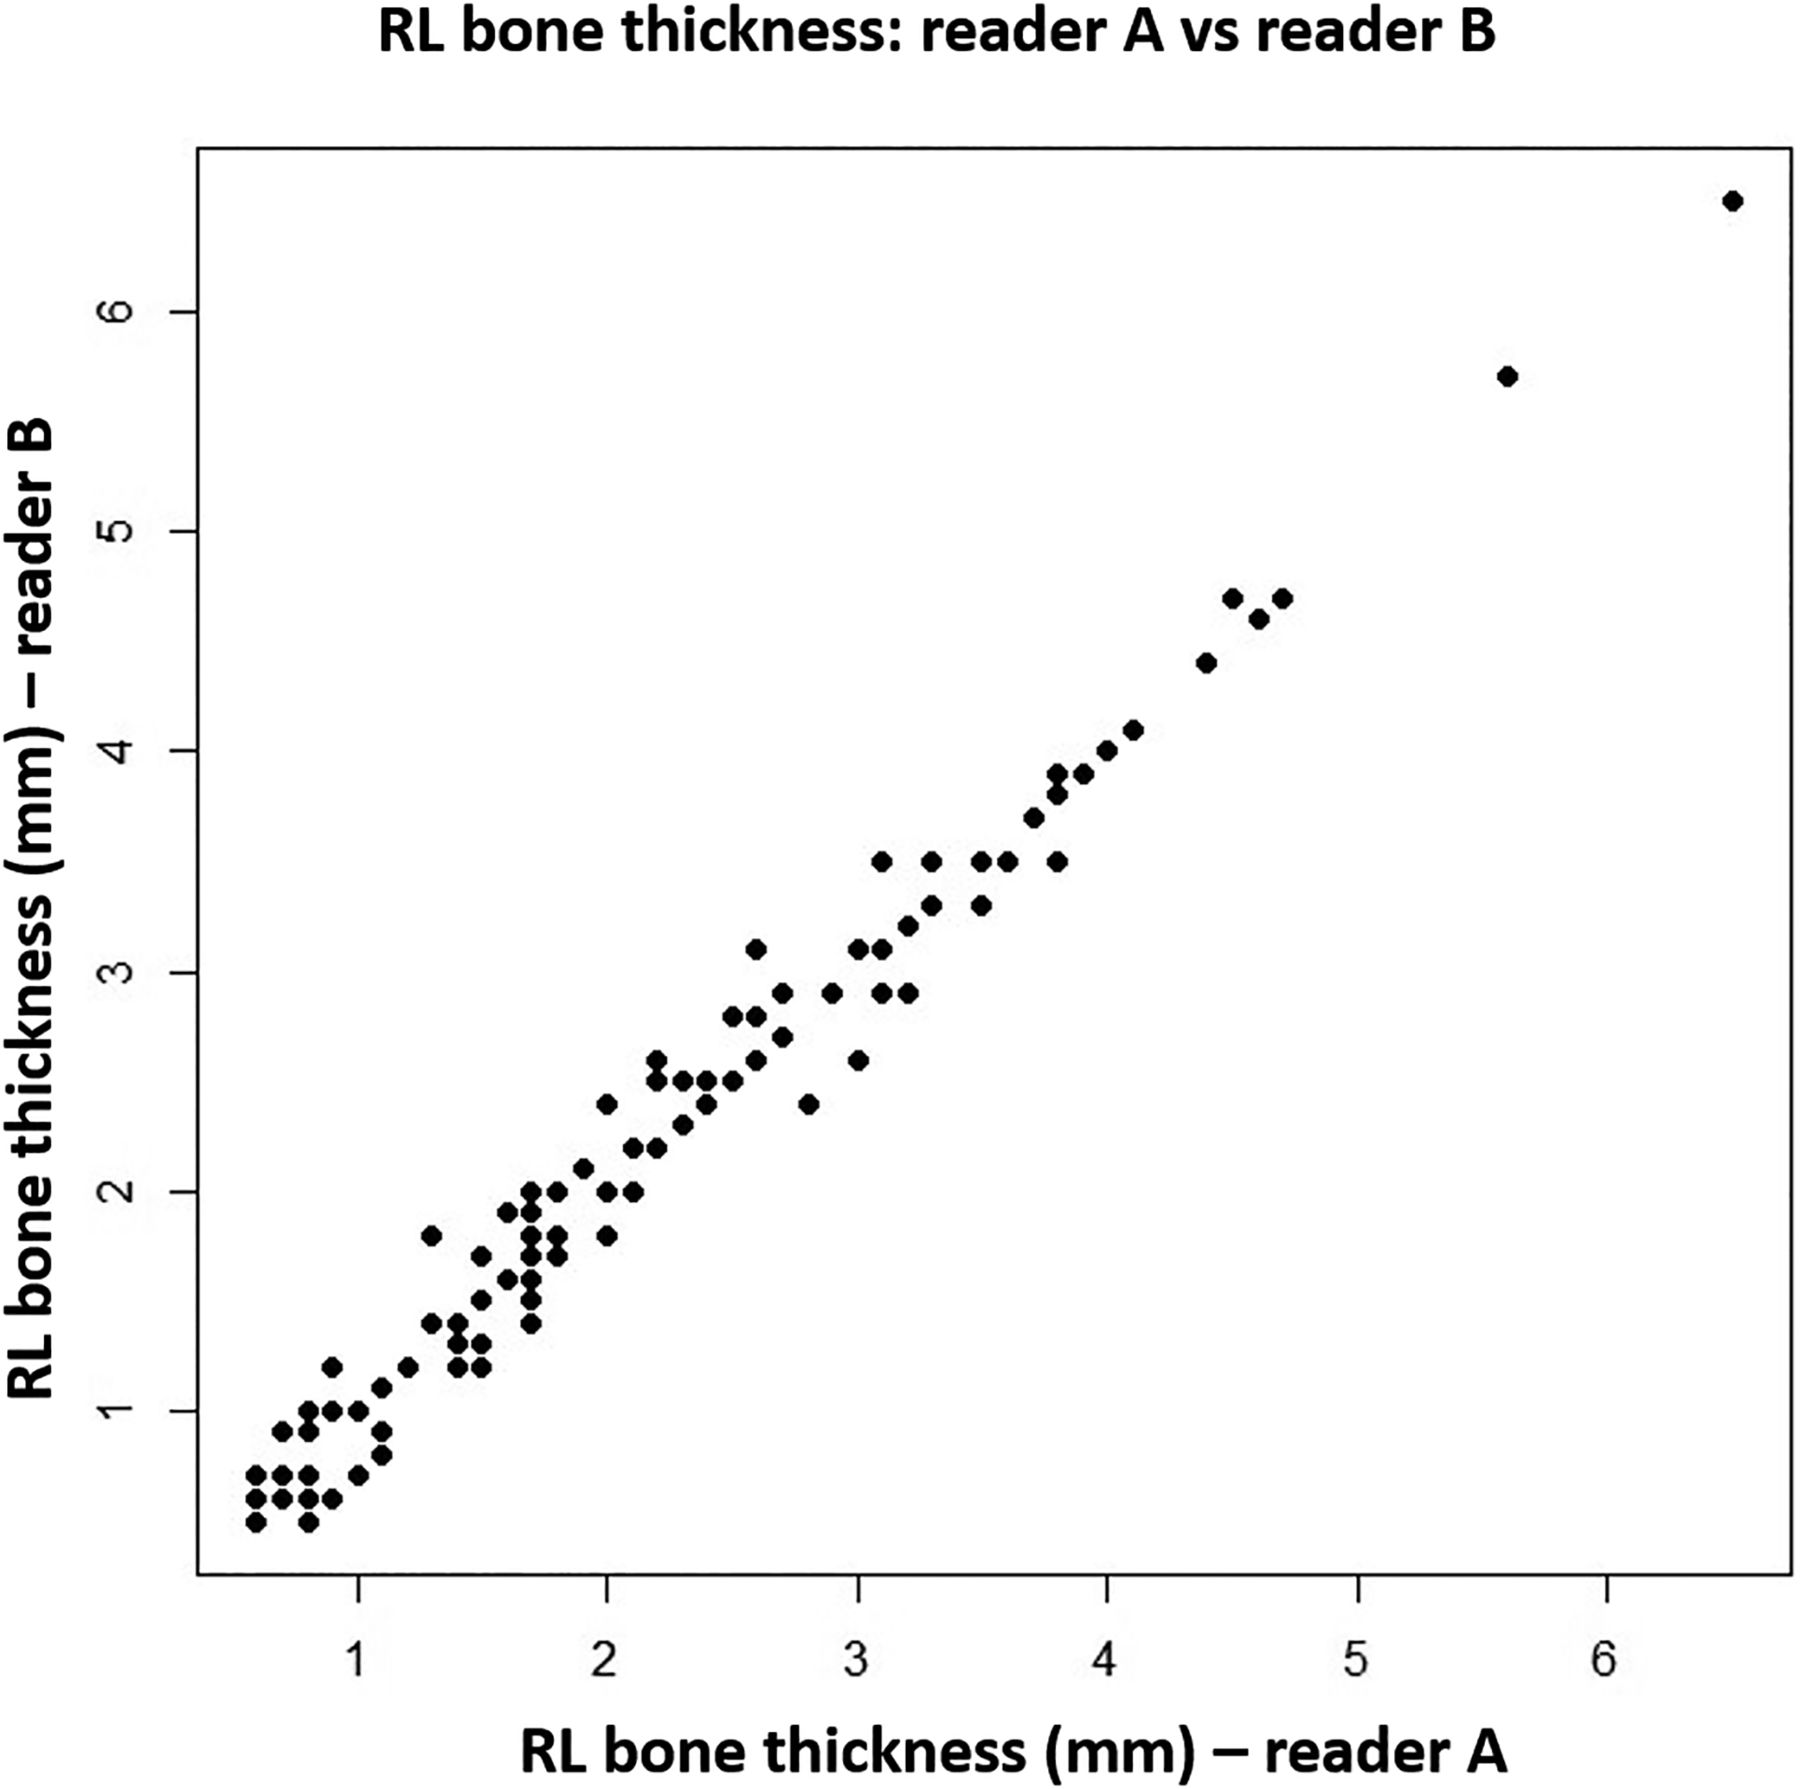
RL bone thickness measurements, as assessed by the 2 readers, demonstrated very strong correlations, with a Pearson correlation coefficient of 0.990 (P value < .001) (Fig 5). When the measurements were dichotomized on the basis of the optimal RL bone thickness cutoff value of 1.2 mm, there was only 1 instance of discrepancy between the 2 readers out of 121 total measurements. The Cohen κ statistic was 0.98, demonstrating near-perfect agreement (95% confidence interval, 0.93–1.00).

RL bone thickness measurements by reader A and reader B.
Part 4
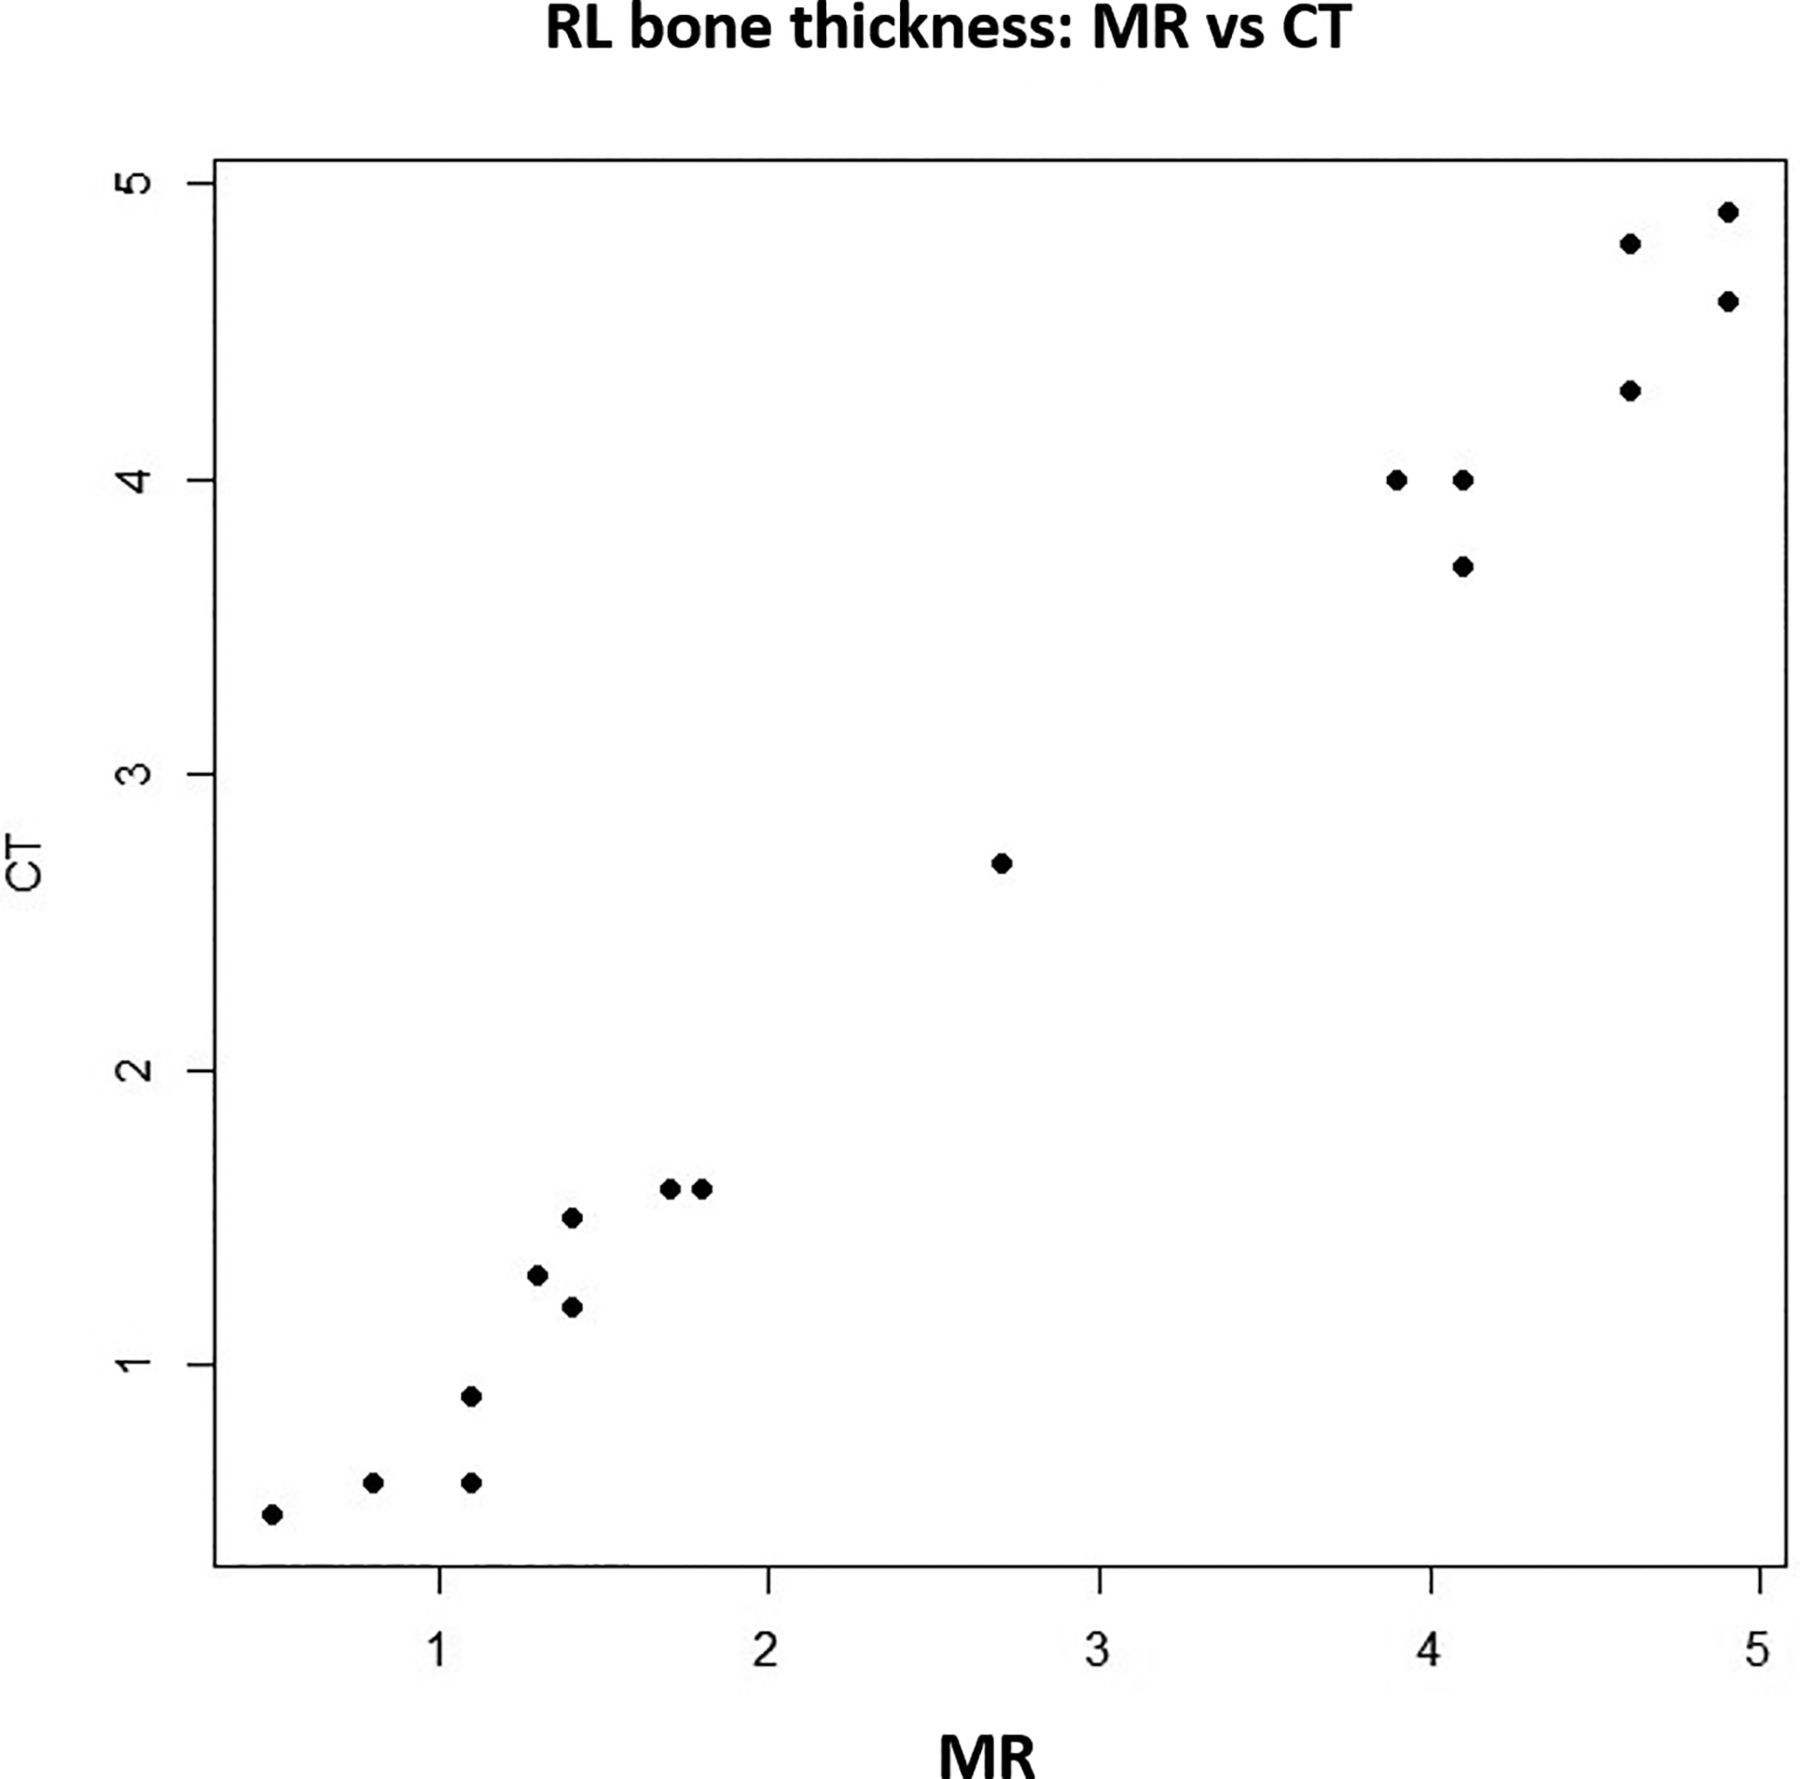
The correlative analysis of RL bone thickness obtained from CT and MR imaging data showed a very strong correlation, as indicated by a Pearson correlation coefficient of 0.994 (P value < .001) (Fig 6). Further confirmation of equivalence by the Wilcoxon TOST indicated significantly equivalent measurements between the 2 imaging modalities (upper and lower P values < .001).

RL bone thickness on MR versus CT.
DISCUSSION
Recent research has revealed distinct subgroups in patients with MD, delineated by specific pathologies of the ES: One patient subgroup (MD-hp) exhibits a congenitally underdeveloped (hypoplastic) ES, while the other (MD-dg) has an ES that initially developed normally but later underwent progressive degeneration.23 Each ES pathology, or “endotype,” is associated with distinct clinical presentations and disease progression patterns within the respective patient subgroup.11 Subsequent studies have linked each of the 2 ES pathologies to radiologically visible differences in the developmental status of the VA as determined by its angular trajectory (ATVA) in the axial imaging plane. These novel insights into the specific “endotype-phenotypes” in patients with MD, coupled with the ability to identify these endotypes using standard CT and MR imaging alongside ATVA measurements, ushers in a new era for personalized diagnostics and treatment strategies, as well as for investigating the varied etiologies of the disease across different patient subgroups.
Specifically, the MD-hp endotype is linked at the phenotype level with an increased likelihood of developing bilateral MD, especially when the ATVA is ≥140° in the second ear. Additionally, individuals in this subgroup typically have a trend toward male preponderance, encounter the onset of MD symptoms earlier in their lives, and have a longer history of vertigo, a higher prevalence of bilateral clinical disease, and a higher likelihood of developing symptoms in the contralateral ear, even if symptoms initially involved only 1 ear, resulting in a more prolonged and severe disease burden.12,24 Therefore, early and accurate diagnosis of the MD-hp endotype is critical for developing tailored diagnostic follow-up protocols and treatment strategies, effectively addressing the increased symptom burden faced by this group.
However, there can be technical difficulties in visualizing and measuring the ATVA,13 especially in patients with a small VA, such as those with a hypoplastic VA in the MD-hp group,22 on CT scans and even more on MR imaging due to its lower resolution and reduced capacity for bone imaging. Our present study investigated the use of RL bone thickness as an alternative marker to represent ATVA/VA orientation and hence the developmental state (hypoplastic versus initially normally developed) of the ES. We discovered that RL bone thickness consistently measures <1.2 mm in patients with MD with an ATVA of 140° or higher, characteristic of the MD-hp endotype. In contrast, a thickness >1.2 mm effectively excludes this endotype. When the ATVA is ≤120°, indicative of the degenerative MD endotype (MD-dg), RL bone thickness shows significant variability. Our results confirm a strong link between RL bone thickness measurements from both CT and MR imaging, indicating that both imaging techniques are effective for classifying endotypes based on RL bone thickness.
These findings build on recent previous research, which noted a thinner (hypoplastic) RL bone in patients with MD-hp compared with a more variable size found in patients with MD-dg.12 By establishing a quantitative threshold for RL bone thickness, our study provides a clear metric for this marker that enhances the differentiation between the MD-hp and MD-dg subgroups in clinical practice.
Nonetheless, this study has its limitations, such as its retrospective nature and the relatively small number of participants, compounded by the limited use of CT in the diagnosis and treatment of MD.
CONCLUSIONS
RL bone thickness is strongly correlated with ATVA, rendering it a reliable and simpler alternative marker for endotyping patients with MD. Our findings specifically indicate that an RL bone thickness ≥1.2 mm virtually excludes the hypoplastic MD endotype. This new marker can contribute toward imaging identification of MD endotypes for more targeted patient care. Including information on RL bone thickness and/or ATVA on a CT or MR imaging report of a patient with MD should be considered as a routine part of reporting in the context of MD imaging.
Footnotes
Kuei-You Lin is co-first-author.
Kuei-You Lin was partially supported by the National Science and Technology Council, Taiwan (MOST 111-2221-E-341-001-MY3) during his visiting research fellowship at Massachusetts Eye and Ear, Boston, Massachusetts.
Disclosure forms provided by the authors are available with the full text and PDF of this article at www.ajnr.org.
References
- Received March 13, 2024.
- Accepted after revision April 24, 2024.
- © 2024 by American Journal of Neuroradiology


Jump to section
Related Articles
Cited By...
- No citing articles found.