
Abstract
BACKGROUND AND PURPOSE: Feature variability in radiomics studies due to technical and magnet strength parameters is well-known and may be addressed through various preprocessing methods. However, very few studies have evaluated the downstream impact of variable preprocessing on model classification performance in a multiclass setting. We sought to evaluate the impact of Smallest Univalue Segment Assimilating Nucleus (SUSAN) denoising and Combining Batches harmonization on model classification performance.
MATERIALS AND METHODS: A total of 493 cases (410 internal and 83 external data sets) of glioblastoma, intracranial metastatic disease, and primary CNS lymphoma underwent semiautomated 3D-segmentation post-baseline image processing (BIP) consisting of resampling, realignment, coregistration, skull-stripping, and image normalization. Post-BIP, 2 sets were generated, one with and another without SUSAN denoising. Radiomics features were extracted from both data sets and batch-corrected to produce 4 data sets: (a) BIP, (b) BIP with SUSAN denoising, (c) BIP with Combining Batches, and (d) BIP with both SUSAN denoising and Combining Batches harmonization. Performance was then summarized for models using a combination of 6 feature-selection techniques and 6 machine learning models across 4 mask-sequence combinations with features derived from 1 to 3 (multiparametric) MRI sequences.
RESULTS: Most top-performing models on the external test set used BIP+SUSAN denoising–derived features. Overall, the use of SUSAN denoising and Combining Batches harmonization led to a slight but generally consistent improvement in model performance on the external test set.
CONCLUSIONS: The use of image-preprocessing steps such as SUSAN denoising and Combining Batches harmonization may be more useful in a multi-institutional setting to improve model generalizability. Models derived from only T1 contrast-enhanced images showed comparable performance to models derived from multiparametric MRI.
ABBREVIATIONS:
- BIP
- baseline image processing
- CE
- contrast-enhanced
- ComBat
- Combining Batches
- ET
- enhancing tumor
- GB
- glioblastoma
- ICC
- intraclass correlation coefficient
- IMD
- intracranial metastatic disease
- mAUC
- multiclass area under the receiver operating characteristic curve
- ML
- machine learning
- PCNSL
- primary central nervous system lymphomas
- PTR
- peritumoral region
- SD
- SUSAN denoising
- SUSAN
- Smallest Univalue Segment Assimilating Nucleus
Glioblastoma (GB), intracranial-metastatic disease (IMD), and primary central nervous system lymphomas (PCNSL) are the 3 most common malignant intra-axial brain tumors. Because the treatment strategies are different, their accurate noninvasive diagnosis would be ideal but is difficult due to overlapping imaging appearances, which are well-described in the neuroradiology literature.1⇓⇓–4 Several prior studies have addressed noninvasive image-based differentiation among GB, IMD, and PCNSL using machine learning (ML), either as a binary or a 3-class problem.1⇓–3,5 Many studies have shown encouraging results, often better than human readers. However, one of the potential drawbacks with these studies is the variability in preprocessing steps that were followed before model training, either at the image or at radiomics level.4
Even though some studies have previously addressed the impact of various image-acquisition and processing parameters on the radiomics feature repeatability and reproducibility, many studies used healthy volunteers or phantoms.6⇓⇓⇓–10 These studies have shown baseline variability in radiomics features based on acquisition parameters, scanner strength, acquisition protocols, slice thickness, and so forth, which may be improved with preprocessing steps such as resampling, intensity normalization, denoising, bias field correction, and harmonization.7,8,11,12 These preprocessing methods can potentially improve the repeatability and reliability of the radiomics results.13 However, the impact of these processing parameters on the final model classification has seldom been comprehensively evaluated with a large data set.
Smallest Univalue Segment Assimilating Nucleus (SUSAN) denoising is often used to help reduce image noise and improve SNR, given its ability to simultaneously detect and preserve edges in an image.13,14 The technique works on a pixel-by-pixel basis and smooths out pixel intensities on the basis of a thresholding method. Combining Batches (ComBat), on the other hand, is a data-driven postprocessing method that was initially used to correct “batch effects” in genomic studies.11,15 More recently, it has been used to address scanner effects to improve downstream analysis in radiomics studies. Unlike other preprocessing methods, ComBat is applied to already-extracted features at the radiomics level rather than the image level. Between 2017 and 2022, at least 51 articles reported the use of ComBat in radiomic studies on MRI (36%), CT (34%), and PET imaging (28%) with 41% reporting higher performance and 18% not reporting any additional benefit with ComBat.15,16
We aimed to investigate if the application of SUSAN denoising (SD), working at the image level to reduce noise, and ComBat harmonization, working at feature level to harmonize radiomic features, either alone or in combination, would improve the classification performance for a 3-class problem (GB versus IMD versus PCNSL) involving malignant brain neoplasms compared with models not using either of these methodologies. Similar to the prior seminal work by Moradmand et al,13 image resampling, coregistration, skull-stripping, and intensity normalization were considered as baseline image processing and were common to all feature sets. Herein, we present our findings on multiple ML models derived from single or multiparametric conventional MR images (derived from a combination of T2WI, FLAIR, ADC, and T1 contrast-enhanced [CE] sequences) with (a) baseline image processing (BIP), (b) BIP with SD, (c) BIP with ComBat harmonization, and (d) BIP with both SD and ComBat harmonization.
MATERIALS AND METHODS
Data Collection
The dual-institutional study was approved by the respective institutional review boards and informed consent was waived, given the retrospective nature of the study. For the training data, institutional cancer registries from the first hospital were searched for patients with GB, PCNSL, and IMD (from a lung, breast, or melanoma primary) between 2010 and 2020 who underwent CE brain MRI. Inclusion criteria were the following: 1) at least 1 enhancing lesion of >1 cm, 2) the availability of index pretherapy MRI, 3) the availability of required sequences, 4) histologic confirmation (for GB and PCNSL cases) or either histologic confirmation or known systemic malignancy with imaging appearance consistent with metastatic disease (for IMD cases), and 5) the absence of motion degraded images. This search yielded a total of 547 cases (GB: 231; IMD: 247; PCNSL: 69). Cases were excluded if there was ≥1 missing sequence (axial T1, T2, FLAIR, ADC, and T1-CE) (n = 30), failure of any of the below-described image-preprocessing steps (n = 15), or any of the masks for the lesions not being available (n = 92). The latter was to avoid imputing values that could confound the impact of preprocessing steps. A total of 410 cases were eventually included in the internal data set (GB: 171; IMD: 188; PCNSL: 51).
In addition, the external test set, obtained from another institution, included a total of 83 cases (GB: 25; IMD: 32; PCNSL: 26). Cases were again collected using the same inclusion criteria and processed using identical pipelines as detailed below. The overall study workflow is provided in Fig 1.

Schematic depicting the study workflow.
Image Acquisition
Images were acquired on either a 1.5T (Aera, Avanto; Siemens) or 3T (Magnetom Skyra, Magnetom Trio; Siemens) system. The typical scanner parameters of the sequences used at both institutions are provided in the Online Supplemental Data. T1-weighted CE images were acquired 3–5 minutes after administration of gadobenate dimeglumine (MultiHance; Bayer Healthcare Pharmaceuticals) or gadobutrol (Gadavist; Bayer Healthcare Pharmaceuticals) injected at the dose of 0.1 mL/kg body weight.
Image Preprocessing
Following image anonymization and conversion of the DICOM images to NIfTI format, BIP was performed on all images as follows: 1) resampling (1 × 1 × x 1 mm3); 2) reorientation to the left-posterior-superior coordinate system; 3) alignment of T1 precontrast images to the SRI24 atlas; 4) coregistration; 5) skull-stripping; and 6) intensity normalization to [0.255] (details in the Online Supplemental Data).
SD was also performed, thereby creating 2 sets of cases, one with and other without SD (BIP±SD).
Tumor Segmentation
Semiautomated 3D volumetric tumor segmentation was performed on axial T1-CE and FLAIR images by 2 board-certified radiologists (N.S. and G.B.) in consensus using LOGISMOS (https://iibi.uiowa.edu/research/logismos-image-segmentation), as detailed previously.17 In patients with multiple lesions, only the largest lesion was segmented. Two ROIs (masks) were segmented using T1-CE and FLAIR images: 1) Enhancing Tumor (ET, enhancing tumor inclusive of any necrotic/hemorrhagic intratumoral components on T1-CE images) and 2) region of FLAIR abnormality, including tumor and peritumoral region (PTR). The PTR mask for each lesion was generated by subtracting the ET from the corresponding FLAIR mask.
In addition to the segmentation of the internal and external cohorts, approximately 17% of the internal patient cohort was randomly resegmented (n = 69, GB: 30; IMD: 28; PCNSL: 11). This segmentation was used for the ML pipelines as described below.
Model Development
Feature Extraction and Harmonization.
For each tumor, radiomic features were extracted from the ET and PTR masks using PyRadiomics Version 3.0 (https://pypi.org/project/pyradiomics/).18 This was done for both data sets, with and without denoising. Radiomic features were harmonized by implementing the neuroCombat package in R, Version 4.2.2 statistical and computing software (http://www.r-project.org/), under default settings for both data sets, thereby resulting in 4 data sets for model training (BIP, BIP+SD, BIP+ComBat, BIP+SD+ComBat).19 Details about extracted features and harmonization are provided in the Online Supplemental Data. Because there were several possible mask and sequence combinations, a few select mask-sequence combinations were chosen on the basis of prior literature to assess the classification performance. The following abbreviations follow “sequence_mask” nomenclature throughout the text unless stated otherwise. ([1] CE_ET and FLAIR [F]_PTR; [2] CE_ET and T2_PTR; [3] CE_ET, ADC [A]_ET and F_PTR; [4] CE_ET only).1,2,20
Feature Selection
Feature selection and reduction methods included the following: 1) a linear combination filter, 2) correlation-based filtering, 3) principal components analysis, 4) supervised least absolute shrinkage and selection operator variable selection, and 5) intraclass correlation coefficient (ICC) filtering based on the resegmentation analysis (detailed description in Online Supplemental Data). In addition, the entire feature set without a priori feature selection was used.
Model Training
ML algorithms used included kernel support vector machines using the polynomial and Gaussian kernels, multinomial elastic net, extreme gradient boosting, generalized boosted regression models, and random forest. These ML models were chosen given their diverse nature and common use in neuro-oncology ML literature.
Model training was performed using masks derived from 1 to 3 different sequences, either alone or in combination, across a total of 4 sequence permutations as mentioned earlier. To assess performance on the internal data set, we performed 5-fold nested cross-validation, and performance was summarized using the mean of the leave-out outer-fold discrimination statistics. The top-performing algorithms for each of the 4 sequence permutations were then trained on the complete internal data set before performance evaluation on the external test set.
Statistical Analysis
Multiclass discrimination performance measures in leave-out test data were computed using the mlr3measures R package (https://cran.r-project.org/web/packages/mlr3measures/index.html), including a multinomial log loss, multiclass Brier score, and the multiclass area under the receiver operating characteristic curve (mAUC) defined by Hand and Till.21,22 Brier scores were calculated using the originally outlined definition, which is extensible to multiclass problems and has a range of 0–2. A purely “noninformative” model that always assigns uniform probabilities to all classes under a 3-class problem will correspond to a Brier score of 0.666. All statistical analyses and ML model fitting were performed using R 4.2.2.22
RESULTS
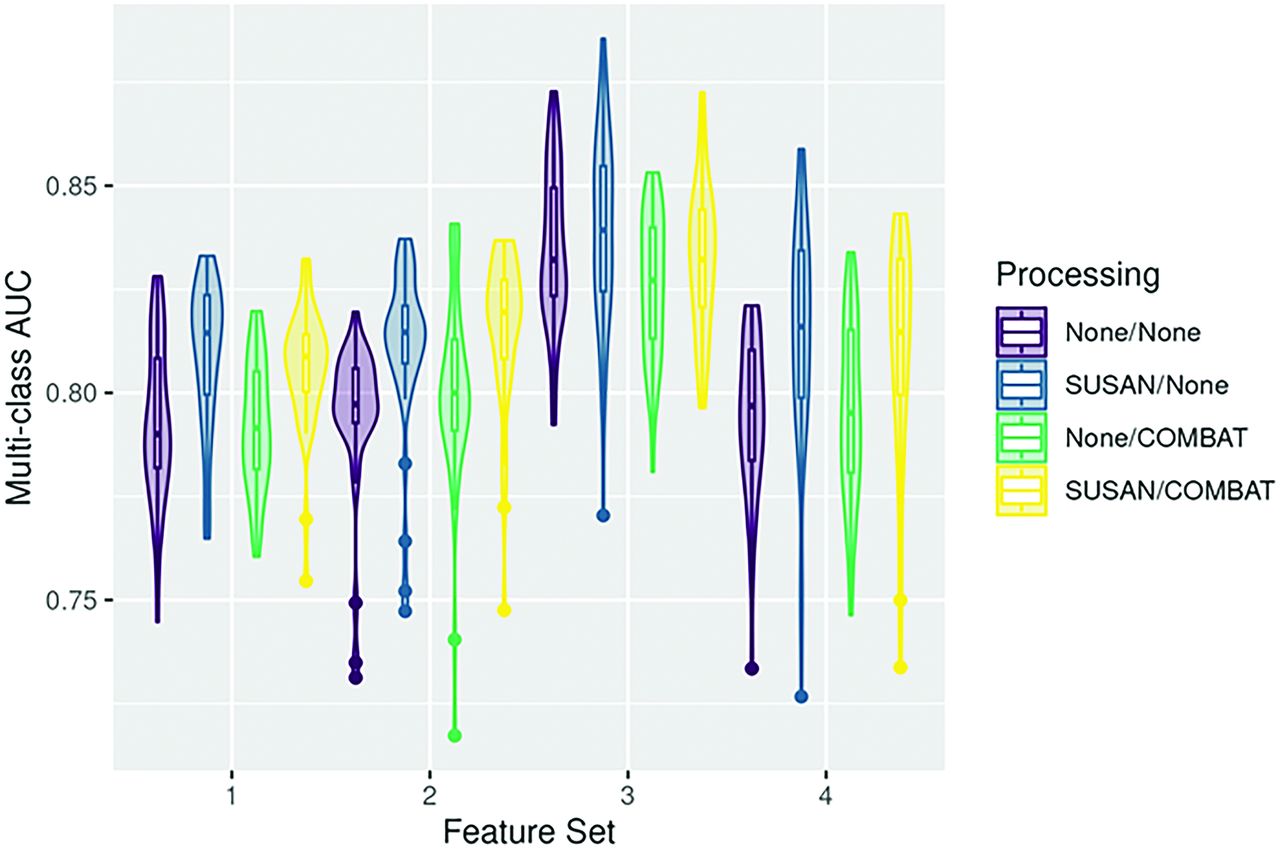
The patient demographic details, scanner, and class distributions for the internal data, resegmented data, and external data are provided in Table 1. Figure 2 (violin plots) depicts the range of mAUC for all 4 image-processing pipelines for the different feature sets derived from the 4 mask-sequence combinations for the external data. A similar representation of model performance on the internal data set is provided in the Online Supplemental Data. In general, models using 3 masks (CE_ET, A_ET and F_PTR), showed slightly better performance (maximal mAUC: 0.873–0.886), which was, nevertheless, comparable with the other models, including those using only the CE_ET masks (maximal mAUC: 0.856–0.859). Table 2 shows the top 3 models for each mask-sequence combination for the external data. The top 3 models for the internal data are provided in the Online Supplemental Data. Figure 3 shows the maximum mAUC for the internal and external data for the various models based on the ML algorithm. A histogram plot showing differences between internal and external data model performance for the different pipelines is presented in Fig 4 and shows a minimal mean drop in the mAUC between the internal and external validation data sets across all 4 processing pipelines with a mean drop of <0.1 in the mAUC across all pipelines.

Violin plots for all 4 feature sets using the external data show the range of mAUC across different pipelines. Feature set 1: CE_ET and F_PTR; 2: CE_ET and T2_PTR; 3: CE_ET, A_ET and F_PTR; 4: CE_ET only. A indicates ADC; F, FLAIR.

Maximum mAUC heatmaps for the internal and external data for the various models based on the ML algorithm. svmRBF indicates support vector machine-Gaussian kernel; XGB, extreme gradient boosting; RF, random forest; GBRM, generalized boosted regression mode; ENET, multinomial elastic net; MAX, maximum; svmPoly, support vector machine-polynomial kernel.

Histogram plot showing mean differences between the internal and external data model performance for the different pipelines. The red line depicts the mean difference in model performance.
Patient demographic details, scanner, and class distributions in the internal and external data sets
Summary of top 3 performing models in the external data set for each feature set
In general, the addition of SD to the preprocessing led to slightly improved performance over BIP, with improvement in the mAUC ranging between 0.009 and 0.040 on the external data set (Table 3). Most of the top 3 performing models for each mask-sequence combination used SD, while only 1 of the models in the same list was derived from only BIP data (Table 2). Most interesting, none of the top 3 models from all 4 mask-sequence combinations used ComBat on the internal data set, while 4 of the models among the top performers for each mask-sequence combination on the external test set used ComBat, which may suggest that ComBat may be helpful when testing models on data derived in a multi-institutional setting. The change in mAUC on the external data set when comparing BIP only with BIP+ ComBat—derived models for the 4 mask-sequence combinations ranged between −0.037 and +0.033 (Table 3). Of note, all 3 top-performing models using the CE_ET and T2_PTR used ComBat (Table 2).
Top performing model for each feature set, along with the 3 other data-preprocessing results using the same modeling strategy (external data)
Bootstrapping of the mAUC was also performed using the various pipelines under the same image preprocessing as a single cluster, and 5000 bootstrap samples were drawn for the percentile-based 95% CI limit calculations. These did not reveal any significant differences between the pipelines (Online Supplemental Data). However, each cluster had about 144 ML pipelines (4 sequence combinations, 6 feature selections, and 6 ML models) and was evaluating the class difference in the image-processing pipelines as a whole and not just the top-performing models.
We further performed the nonparametric Kruskal-Wallis test to assess the impact of image preprocessing on feature importance. This was done for the top 15 radiomic features across all pipelines that corresponded to a P value < .01 in at least 1 analysis. Results are presented in the Online Supplemental Data for internal and external data sets, respectively. For the internal data set, these showed that ComBat tended to attenuate associations among these features, whereas the application of SUSAN had mixed results (Online Supplemental Data).
To evaluate any differences in prediction performance between disease classes (GB versus IMD versus PCNSL), we evaluated individual 1-versus-rest AUC values by class. Violin plots (Online Supplemental Data) suggest that there may be some evidence that SUSAN helps with PCNSL-specific discrimination performance, but this suggestion is difficult to assess systematically, given the additional confounders.
Finally, bar plots (Online Supplemental Data) were constructed to quantify the sources of variability attributable to class and batch (ie, scanner type) on the multivariate radiomics feature distributions using principal variance component analysis. These showed that features derived from the CE_ET mask in general trended toward stronger class signal.
DISCUSSION
In this study, we investigated the impact of preprocessing steps (SD and ComBat harmonization) on the eventual classification performance in a 3-class (GB versus IMD versus PCNSL) problem involving malignant brain tumors. This was done across 4 mask-sequence combinations using several ML pipelines and feature-reduction methods. We found that even though the mean mAUC across the various pipelines was similar (BIP, BIP+ SD, BIP+ComBat, BIP+SD+ComBat), several of the top 3 models across all mask-sequence combinations on the external test set used SD. Similarly, 4 of the top models across the various mask-sequence combinations used ComBat harmonization on the external data set, including all 3 top-performing models which used a peritumoral mask derived from T2WI (Table 2). The variability in model performance for the top-performing models in the external data is exemplified in table 3 which shows performance metrics for the same tumor-mask combination and ML pipelines but variable application of SD and ComBat.
These findings contrast with the top-performing models on the internal data set, in which most of the models used neither SD nor ComBat harmonization. Our findings suggest that the use of preprocessing pipelines such as SD and ComBat harmonization may be more helpful in a multi-institutional setting and possibly helpful in improving model generalizability. A precise explanation of how these image preprocessing steps impacted model performance is, however, difficult to separate out, given the multiple confounders. This difficulty is partly because the classification performance is also considerably affected by the specific feature-selection techniques and ML model used. Additionally, comparison with baseline preprocessing also muddies the waters in the sense that the baseline steps such as resampling and intensity normalization by themselves can affect radiomics features and therefore impact classification performance. A few potential insights into the impact of image preprocessing and model performance may be obtained through the Online Supplemental Data, which evaluates the impact of image preprocessing on important radiomics features as well as the class-wise impact of image preprocessing on 1-versus-others AUC. From the Online Supplemental Data, it is evident that preprocessing steps can variably alter the feature importance of various radiomic features, which can potentially impact how they are valued in ML pipelines. Additionally, as shown in the Online Supplemental Data, SD can potentially improve the model classification performance for PCNSL regardless of the sequences used, likely also impacting the overall model performance.
Another takeaway from the study is that even though models using 3 mask-sequence combinations tended to perform marginally better for GB versus IMD versus PCNSL, the performance was overall similar to models using data from the CE_ET mask only. As shown in the Online Supplemental Data, the radiomics features of the CE_ET mask tend to more dependent on the underlying disease class rather than those from other sequences, which may partly explain why T1-CE-derived features may perform comparably with other multiparametric sequence-derived models. This finding is in line with previous studies and may imply that using a single mask-sequence combination may yield similar results and be easier to implement logistically in the clinical setting.1,2
Previous studies have evaluated the impact of preprocessing steps on the radiomics features, generally in terms of feature robustness and reproducibility. Several of these studies have been performed on phantoms or healthy volunteers and primarily focused on identifying reproducible features.7,9,23 Some of the prior studies also used patient-level data and assessed the impact of image-preprocessing steps on evaluating patient survival, glioma grades, or the impact on tumor subregions.12,13,24,25 However, none of the prior studies, to the best of our knowledge, have extensively evaluated the impact of preprocessing steps on eventual classification performance in a multiclass problem (of GB versus IMD versus PCNSL) in neuro-oncology. Even though the variation in radiomics features with differences in sequence parameters, vendors, scanner strength, and slice thickness are known, their impact on eventual classification problems in a GB versus IMD versus PCNSL scenario remains less well-explored.
In the current study, models using SD or ComBat on the internal data set did not outperform models using neither of these preprocessing steps. A potential explanation may be that within the same institution, there is limited protocol and scanner heterogeneity, and the effect of the additional preprocessing steps on model performance may be negligible. Additionally, the BIP in our study involved resampling and intensity normalization. Bologna et al,6 previously noted that image-preprocessing steps such as normalization, resampling, Gaussian filtering, and bias field correction improved the stability of features on the T1 and T2WI phantom data. Similarly, Carré et al24 noted that intensity normalization considerably improved the robustness of first-order features and subsequent model classification performance for glioma grading. Similarly, Li et al11 and Um et al12 noted that resampling voxels to 1 × 1 × 1 mm could remove some of the scanner effects. Because our BIP included resampling and image normalization, it is possible that the additional benefits of further preprocessing were not apparent on the internal data set, which is expected to be less heterogeneous.
On the other hand, in the external data set, the additional postprocessing steps, especially SD, were likely useful across various mask-sequence combinations. All top 3 models using the T2_PTR mask used ComBat on the external data set, which may suggest that ComBat harmonization may be more important in models using features derived from T2WI in a multi-institutional setting. As shown in the Online Supplemental Data, ComBat does seem to disproportionately improve the feature importance of T2_PTR-derived sequences, possibly helping explain why it was useful. One difference between the 2 institutions is that the T2 WI internal data set was acquired before and the external data set was acquired after contrast injection. Although this does not visibly change the appearance of the T2-based images, it is possible that it may affect the underlying radiomics features.
Limitations of our study include the retrospective nature and a modest sample size. We also did not evaluate the effect of other preprocessing steps such as bias field correction or various types of image and feature normalization methods, including more recently described deep learning approaches.26,27 Such a task would further complicate the current analysis by introducing the confounding effect of additional variables, which may be better evaluated separately in future studies. Our choice of choosing only noise filtering/SD and Combat harmonization was based on selecting a preprocessing step that works at the image level and another that works at radiomics feature level. We also did not perform any bias field correction as part of BIP on our data. However, both Um et al12, and Li et al11 noted that bias field correction had no impact on radiomics feature reproducibility in their analysis when there were no obvious bias field effects on the MR images. Next, we also did not compare our performance with that of expert readers because the primary focus of the study was to assess the impact of image preprocessing on eventual model performance. Additionally, given that feature selection and ML models work in different ways and can have considerable variability by themselves, independent of the image preprocessing steps, an exhaustive assessment of each ML pipeline was beyond the scope of current work. We, therefore, focused on broad trends in model-classification performance instead of trying to select a clear winner. Finally, not all cases of IMD in our study were pathologically proved, being not practically feasible in a clinical setting. We, therefore, relied on the availability of additional imaging and follow-up data, including clinical records and institutional cancer registries to identify patients with IMD.
CONCLUSIONS
Imaging-preprocessing steps such as SD and ComBat harmonization may help achieve marginally improved classification performance in a multi-institutional setting. Their impact is likely negligible in a single-institution setting where scanner and protocol heterogeneity are likely limited. Finally, models derived from multiparametric MRI show classification performance similar to that of models derived only from the T1-CE sequences.
Footnotes
This work was supported, in part, through the ACS-Holden Cancer Center grant.
Disclosure forms provided by the authors are available with the full text and PDF of this article at www.ajnr.org.
References
- Received February 19, 2024.
- Accepted after revision April 5, 2024.
- © 2024 by American Journal of Neuroradiology


Jump to section
Related Articles
Cited By...
- No citing articles found.