
Abstract
BACKGROUND AND PURPOSE: After repeat administration of gadolinium-based contrast agents (GBCAs), the association between gadolinium retention in the central and peripheral nervous systems and the main manifestations of myelopathy and progressive neurologic symptoms remains unclear. We investigated the effects of the repeat administration of GBCAs on gadolinium retention in the central and peripheral nervous systems and the sensory, cognitive, and athletic implications.
MATERIALS AND METHODS: Forty-eight male Wistar rats (6 weeks of age) were randomly divided into 4 experimental groups (12 rats in each group): the gadodiamide group (linear and nonionic GBCAs), the gadopentetate dimeglumine group (linear and ionic GBCAs), the gadoterate meglumine group (macrocyclic and ionic GBCAs), and the control group (0.9% saline solution). The brains of the rats were scanned using 9.4T MRI. Sensory behavioral tests were performed to assess the effect of GBCAs on pain sensitivity function. Gadolinium deposition in the brain, spinal cord, and peripheral nerves was determined by inductively coupled plasma mass-spectrometry. Transmission electron microscopy was used to observe the microscopic distribution of gadolinium after deposition in the spinal cord. The histopathologic features in the spinal cord were analyzed by H&E staining, Nissl staining, glial fibrillary acidic protein staining, and neuron-specific enolase staining after administration of GBCAs.
RESULTS: All GBCAs resulted in gadolinium deposition in the central and peripheral nerve tissues, with the highest deposition in the sciatic nerve tissue (mean, 62.86 [SD, 12.56] nmol/g). Decreased muscle power, impairment of spatial cognitive function power, and pain hypersensitivity to thermal and mechanical stimuli were observed after exposure to gadodiamide. At the spinal cord, transmission electron microscopy found that the region of gadolinium depositions had a spheric structure similar to “sea urchins” and was mainly located near the vascular basement membrane.
CONCLUSIONS: Multiple injections of GBCAs caused gadolinium deposition in the brain, spinal cord, and peripheral nerves, especially in the spinal cords of the gadodiamide group. Gadodiamide led to pain hypersensitivity and decreased muscle power and cognitive ability. For the patients who are hypersensitive to pain and need multiple MRI examinations, we recommend using macrocyclic GBCAs and the lowest dose possible.
ABBREVIATIONS:
- DCN
- deep cerebellar nucleus
- GBCA
- gadolinium-based contrast agent
- Gd
- gadolinium
- GFAP
- glial fibrillary acidic protein
- ICP- MS
- inductively coupled plasma mass-spectroscopy
- NSE
- neuron-specific enolase
- NSF
- nephrogenic systemic fibrosis
- TEM
- transmission electron microscopy
Gadolinium-based contrast agents (GBCAs) have been widely used in enhanced MRI examinations for > 30 years and are the most commonly used contrast agents. They were considered relatively safe until several reports in 2006 associated nephrogenic systemic fibrosis (NSF) with multiple GBCA exposures. However, the safety of GBCAs attracted attention again in 2013, and recent studies have revealed that the signal intensity in the deep cerebellar nucleus (DCN) on unenhanced T1WI may be the result of previous multiple GBCAs administrations.1⇓-3 Further studies detected gadolinium (Gd) deposits in brain tissues. However, the clinical and neurobiological effects of GBCA deposition remain unclear. The common adverse reactions after GBCA deposition in the brain were reported to be visual and hearing changes, dry eyes, disorientation, and headache.4⇓-6
Previous studies have mainly focused on Gd deposition in the CNS; few studies have been conducted in the peripheral nervous system. While deposits also occur in the peripheral nervous system, the main manifestations are myelopathy and progressive neurologic symptoms, including paresthesia of the peripheral nervous system, numbness of the hands and feet, ataxia, and limb weakness.4,7 There is also needle-stinging or burning pain in a glovelike or socklike distribution. Pain is mainly distributed in the arms and lower extremities and rarely in the trunk. These symptoms decrease with time and are presumably caused by the deposition of Gd due to metal substitution.8 The functional impact of Gd retention on the peripheral nerve, such as pain sensitivity and muscle performance, remains to be elucidated.
The purpose of this study was 3-fold: first, to investigate whether exposure to GBCAs leads to the deposition of Gd in peripheral nervous tissue; second, to assess the effects of GBCAs on sensory behavior, cognition, and pain hypersensitivity to thermal and mechanical stimuli; and third, to investigate how multiple exposures of rats to GBCAs and Gd deposition affect the pathologic manifestations of the spinal cord.
MATERIALS AND METHODS
Animals and Study Design
Forty-eight male Wistar rats (220–240 g, 6 weeks of age) used in the experiments were purchased from the Xiamen University Laboratory Animal Center. The animals were housed in standard laboratory conditions with free access to water and food under a 12-hour light-dark cycle. Before the formal experiment, the rats were underwent for 7 days for acclimatization. All experimental studies were approved by the Animal Ethics Committee of Xiamen University.
The Wistar rats were randomly divided into 4 experimental groups (12 rats in each group): the gadodiamide group (linear and nonionic GBCAs, Omniscan, 500 mmol Gd/L; GE Healthcare), the gadopentetate dimeglumine group (linear and ionic GBCAs, Magnevist, 500 mmol Gd/L; Bayer HealthCare Pharmaceuticals), the gadoterate meglumine group (macrocyclic and ionic GBCAs, Dotarem, 500 mmol Gd/L; Guerbet), and a control group (0.9% saline solution). GBCAs were injected via the tail vein for 4 consecutive days per week for 4 weeks at a daily dose of 0.6 mmol/kg.9 This dose was equivalent to the normal human dose of 0.1 mmol/kg recommended by the FDA. The control group received the same equivalent of 0.9% saline solution. A flow chart of MR scanning and the administration of GBCAs is presented in Fig 1.

Flow chart of experimental design. The experimental timeline of GBCA injections, MR scanning (days 0, 7, 14, 21, 28, and 42), inductively coupled plasma mass-spectroscopy (day 28), TEM (day 42), heat and mechanical hyperalgesia tests (days 0, 28, and 42), the accelerated rotarod test and the Morris water maze test (days 0, 28, and 42), immunohistochemical test (days 28 and 42), and euthanasia time point. In total, 48 rats were used in the experiment. The number of rats used in each experiment is indicated in the diagram. M-maze indicates the Morris water maze test; inj., injection.
MR Imaging and Analysis
The rats were anesthetized (2.0% isoflurane) and placed on a mechanical ventilator. Mean body temperature was maintained at 37.0°C [SD, 0.5°C] using a heated circulating water pad. The rats were placed in the prone position in a stereotactic stent for MRI. The MRI experiments were performed on a horizontal-bore 9.4T scanner operating on an AVANCE platform (Bruker 9.4T Biospec). The ventilation unit continuously ventilates isoflurane gas while scanning. T1-weighted MRI with a fast spin-echo sequence was performed on the brains of the rats (field of view = 50 × 50 mm, bandwidth = 348.77 kHz, matrix size = 256 × 256, scan slices = 15, slice thickness = 1.0 mm, TE = 8.5 ms, TR = 1366.9 ms, and number of excitations = 15).10,11
After MRI scanning the original images were sent to the 9.4T Micro MRI experimental workstation (Bruker 9.4T Biospec) for image data analysis. All images were analyzed in blinded and randomized fashions. The ROIs were located in the bilateral DCN and cerebellum of the rat brain. Quantitative evaluations of the DCN T1 signal intensity were performed by positioning the ROIs over the bilateral DCN and cerebellum zones according to the anatomy of the rat brain. The DCN T1 signal intensity was quantitatively evaluated. The signal intensity ratio was calculated as follows:12,13
Inductively Coupled Plasma Mass-Spectroscopy Analysis for Gd Detection and Quantification
Rats were euthanized with excessive sodium pentobarbital anesthesia. Subsequently, the heart was exposed and rapidly perfused with 0.9% saline solution through the left atrium to remove excess blood from the brain. After the liver completely turned white, the sample tissue was quickly removed. Cerebellar, whole spinal cord, and peripheral nerve (sciatic nerve) samples were isolated according to the anatomic atlas of rats and extracted on ice.13 The samples were weighed (about 200 mg) and sealed in quartz tubes, immersed in 2.0 mL of concentrated nitric acid, and subjected to digestion for 90 minutes. Then, each sample was transferred to a polypropylene tube and diluted to 10 mL with ultrapurified water. Gd standard solution and internal standard solution were prepared as quality controls. Subsequently, the accumulation of 158 in each sample was measured using inductively coupled plasma mass-spectroscopy (ICP-MS) (7700x; Agilent Technologies; internal standard indium 115). The concentration of Gd was monitored using a standard curve of inorganic Gd (0.1–50 μg/L) and expressed as nanomoles of Gd per gram of wet tissue weight.
Transmission Electron Microscopy Analysis for the Observation of Gd Deposition
Rats were euthanized with excessive sodium pentobarbital anesthesia. The cerebellum, whole spinal cord, and sciatic nerve were separated as soon as possible on ice according to the rat anatomy atlas and washed with cold saline. Then, the spinal cord tissue was quickly fixed with 2.5% glutaraldehyde, and 1-mm3 samples were collected. The samples were rinsed in 0.1 mol/L Na-cacodylate buffer (pH = 7.4) 3 times, fixed in 1% osmic acid for 2 hours, and then washed with saline 3 times. The samples were then dehydrated with graded ethanol and acetone series, immersed in Epon812 epoxy resin (Beyotime, Shanghai, China) for 12 hours, dried, and polymerized in an oven at 70°C for 24 hours. Next, ultrathin sections (0.1 μm) were cut and stained with 2% lead citrate glued to a copper grid. The ultrastructure was observed by transmission electron microscopy (TEM). Elemental composition analysis used energy-dispersive x-ray, and the distribution of concentrated GBCA particles was observed.
Heat Hyperalgesia and Mechanical Hyperalgesia Test
The test was conducted by radiant heat stimulation applied to the plantar surface of the hind paw to produce a pain response at a set temperature (intensity of 40 infrared units). When the rat received the stimulation to withdrawal the paw, it was regarded as a pain response, and the withdrawal latency was the time from stimulus onset to paw withdrawal. About 30 minutes before the test, the rats were individually placed in clear plastic cages for accommodation. Heat stimuli were applied 3 times with a 10-minute rest between trials. The averages of 3 times withdrawal latency were recorded. The experiment was performed before the injection of GBCAs and at days 28 and 42 after the first injection of GBCAs.
A von Frey filament (Ugo Basile, Milan, Italy) with a bending force of 15 g was applied to the plantar surface of the rat hind paw, and the frequency of paw withdrawal was recorded. At the beginning of the test, the plantar surface was poked successively 5 times at 5-minute intervals, and the paw withdrawal frequency was reported. The mean of the 5 tests was calculated. The experiment was performed before the injection of GBCAs and on days 28 and 42 after the injection of GBCAs.
Accelerated Rotarod Test and Morris Water Maze Test
The assessment of the Morris water maze task was slightly modified as previously described.14 The rats were screened before the experiment to identify those that could not swim. The tests were conducted before the injection of GBCAs and at days 28 and 42 after the injection of GBCAs twice daily. In each test, all animals were tasked with finding a hidden, transparent plastic platform (10 cm in diameter) placed 50 cm from the water maze wall (150 cm in diameter and 60 cm in depth) and 1 cm below the water. The test was done blindly, and all animals were randomized in each group. The rats faced the pool wall before being released, and the time it took to reach the hidden platform was recorded. The rats were allowed to rest on the platform for 30 seconds during the test.
The abilities of motor skills and coordination in rats were measured with an accelerated rotarod apparatus. The speed was accelerated from 0 to 40 rpm for >4 minutes.15 The rats received once-daily training sessions of 3 trials separated by 30-minute intervals for 3 consecutive days before the injections of GBCAs. The longest time each rat stayed on the rod was recorded as the baseline. At days 28 and 42 after the injections of GBCAs, rats were tested 3 times on the rotarod, and the best performance of each rat was recorded on that day.
Histologic Observations
Rats were euthanized with an overdose of sodium pentobarbital anesthesia. Subsequently, the spinal cords were isolated and extracted on ice quickly and then fixed in 4% buffered paraformaldehyde for 48 hours. The samples were then dehydrated, embedded in paraffin, cut into 5-μm sections, and stained with H&E, Nissl, neuron-specific enolase (NSE, 1:1000, 24330; CST), and glial fibrillary acidic protein (GFAP, 1:1000, ab7260; Abcam) stains. GFAP is a type III intermediate filamentous protein mainly distributed in astrocyte glial cells of the nervous system and is a marker of astrocyte activation. In the case of neuronal injury, GFAP expression is elevated, suggesting astrocyte gliosis.16 In the nervous system, NSE is a soluble cytoplasmic protein that is continuously expressed by mature neurons and neuron-derived cells. It is a brain tissue–specific glycolytic enzyme that plays an important role in the process of cellular energy metabolism. Elevated NSE expression can be detected in nervous system injury.17 Immunohistochemical analysis was performed microscopically by Xiang Yao with >10 years of experience (M2700 P; Leica). Histologic evaluation of the spinal cord was performed, including the observation of neuronal cell degeneration and obvious necrosis and the expression of NSE and GFAP. The evaluators were blinded to the treatment groups. ImageJ software (National Institutes of Health) was used to analyze the results.
Statistical Analysis
All statistical analyses were performed by using SPSS 17.0 (IBM) or GraphPad Prism 8 software (GraphPad Software), and the data are expressed as mean (SD). For the analysis of immunohistochemistry and Gd deposition, 1-way ANOVA was used, followed by post hoc analysis with the Tukey test. For the sensory tests, a mixed-design ANOVA was performed. One-way ANOVA was used to detect heat hyperalgesia and mechanical hyperalgesia experiments, and the Dunnett test was used for post hoc analysis. P < .05 was considered a significant difference.
RESULTS
Animal Observations
All rats successfully completed the study and survived the entire study without any adverse health-monitoring reports. During the treatment period and after administration, there was no significant difference in the weight of the rats in the 4 groups or the cumulative injection dose of GBCAs.
Signal Intensity Analysis of DCN and Cerebellum on T1WI
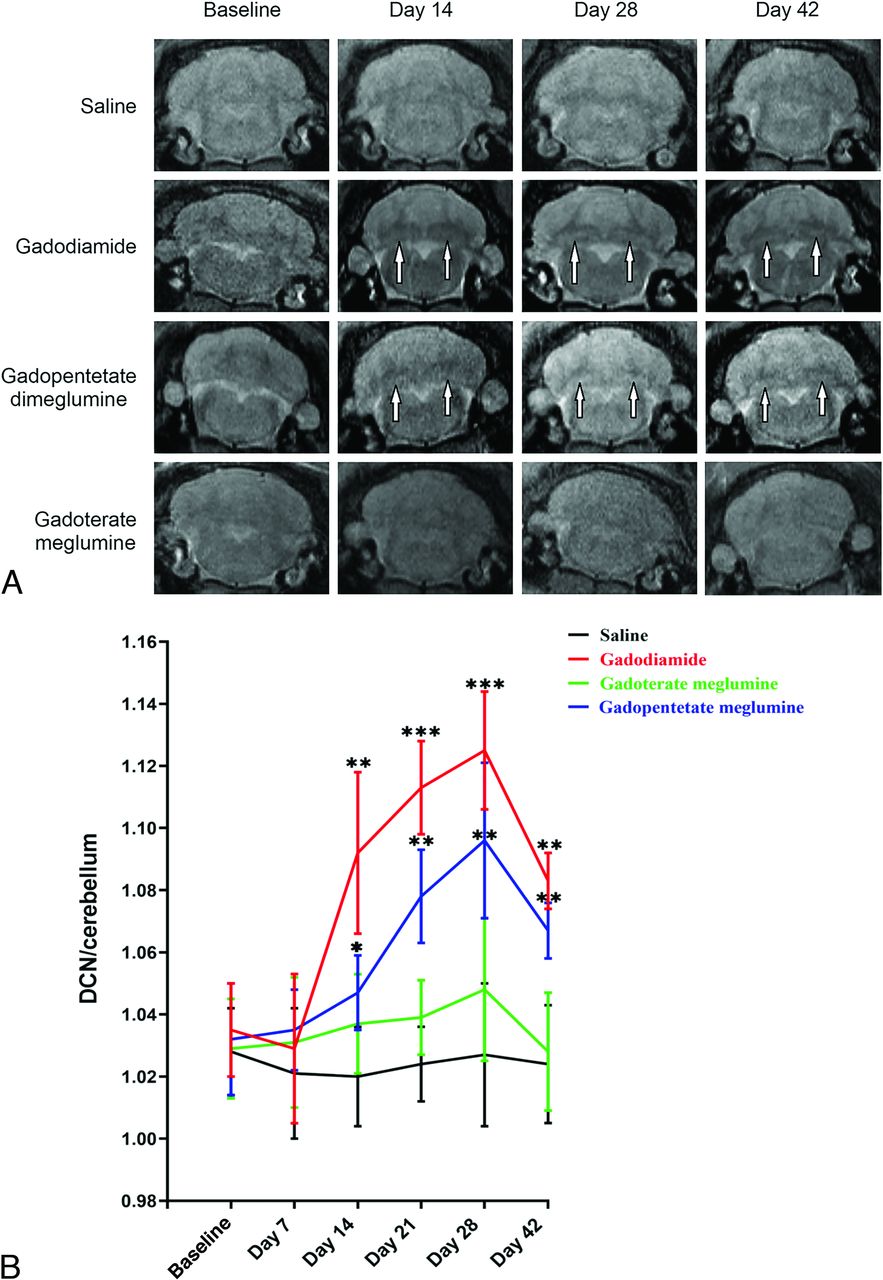
Rats injected with gadodiamide and gadopentetate dimeglumine gradually showed high signals in the DCN on T1-weighted MRI scans. Generally, there is an obvious high signal in the third week after injection. Figure 2 shows representative T1-weighted MR images of the DCN of each group at different time points after the administration of saline, gadodiamide, gadopentetate dimeglumine, and gadoterate meglumine. After multiple injections of gadodiamide, the T1 signal intensity ratios gradually increased. The third week after gadodiamide injection, the signal intensity ratio was significantly higher than the baseline level and remained at a high signal state until 2 weeks after the injections were terminated (P < .05). Compared with the gadodiamide group, the gadopentetate dimeglumine group had lower T1 signal intensity ratios. However, the signal intensity ratio was still significantly higher than the baseline level and remained at a high signal state until 2 weeks after the injections were terminated (P < .05). There was no significant difference in T1 signal intensity ratios between the macrocyclic gadoterate meglumine group and the control group during the entire process of injection and the period after the injections were stopped (P > .05).

Representative T1-weighted MR images of the DCN in mice on days 14, 28, and 42 after the injections of saline, gadodiamide, gadopentetate dimeglumine, and gadoterate meglumine (A). High signal intensity in the DCN on unenhanced T1-weighted imaging is indicated by white arrows (B). Bar graph depicts the quantitative analysis of the T1-weighted DCN to cerebellum signal ratio on MR images. Error bar represents the SD. Single asterisk, P < .05; double asterisks, P < .01; and triple asterisks, P < .001 compared with the saline group.
Gd Deposition in the Cerebellum and Peripheral Nervous System of Rats
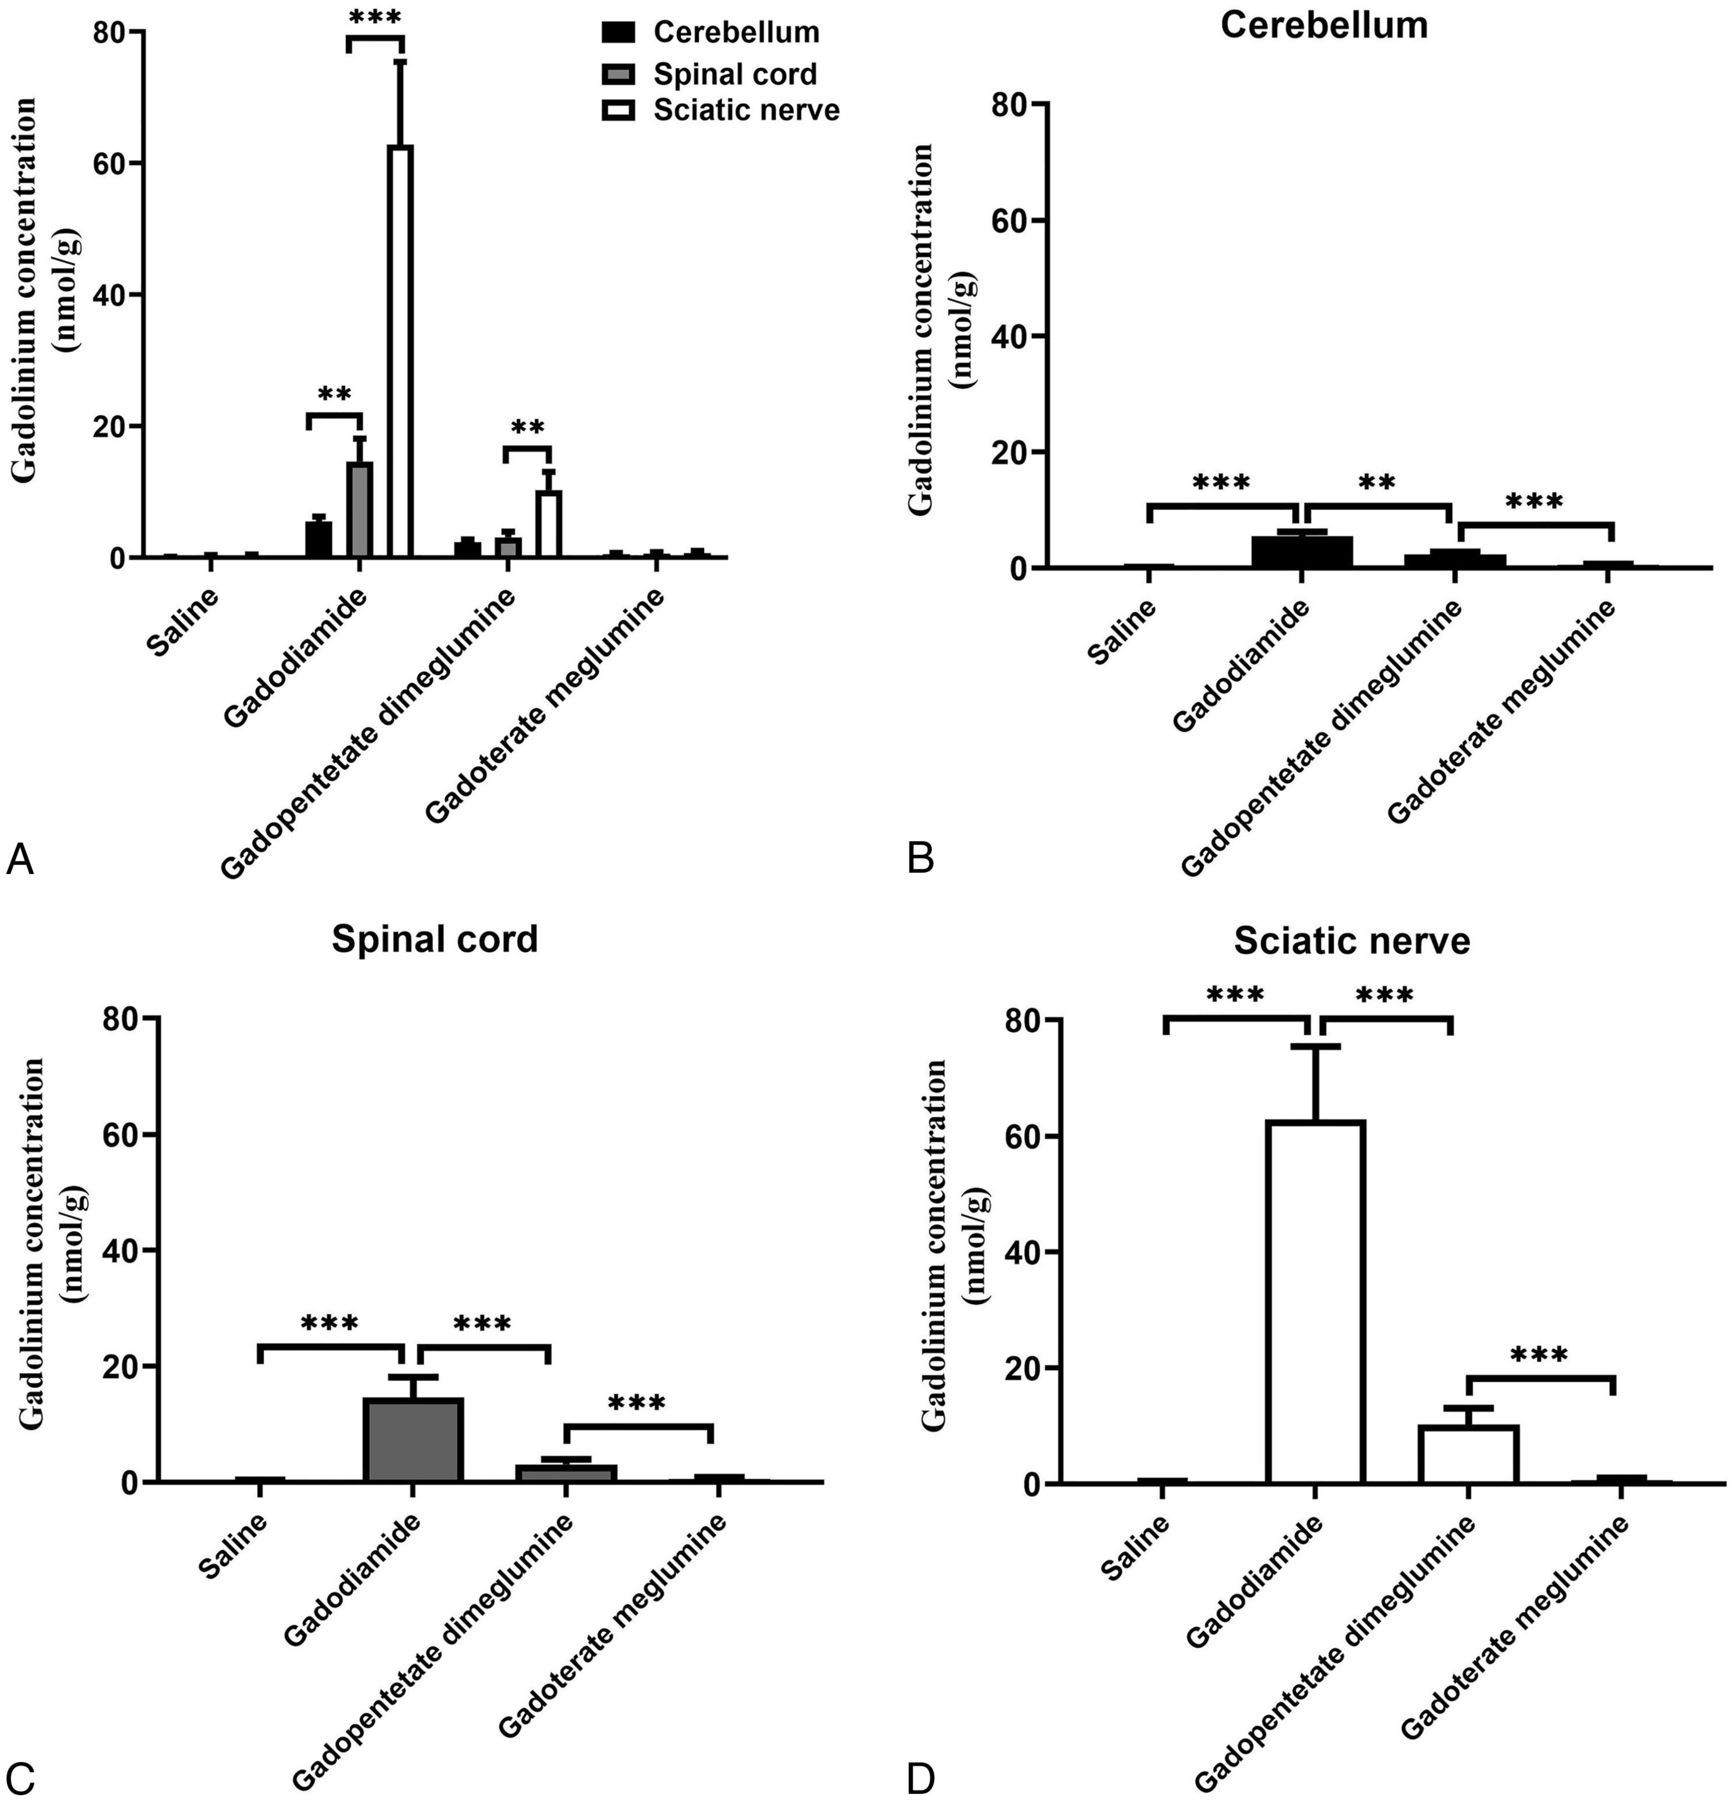
Multiple injections of GBCAs into the tail vein of the rats resulted in Gd deposition in the cerebellum, spinal cord, and sciatic nerve, as observed by ICP-MS. Figure 3 shows the deposition of Gd in the cerebellum, spinal cord, and sciatic nerve of the gadodiamide, gadopentetate dimeglumine, and gadoterate meglumine groups 28 days after injection. The amount of Gd in the cerebellum, spinal cord, and sciatic nerve of rats receiving tail vein injections of both GBCAs (0.6 mmol/kg) was significantly higher than that of the control group except for gadoterate meglumine treatment in the sciatic nerves. The deposition of Gd in the gadodiamide group in the sciatic nerve was significantly higher than that of the gadopentetate dimeglumine and gadoterate meglumine groups (mean, 62.8 [SD, 12.56] nmol/g versus 10.29 [SD, 2.78] nmol/g and 0.71 [SD, 0.33] nmol/g for gadopentetate dimeglumine and gadoterate meglumine, respectively). The same results were found in the cerebellum (5.53 [SD, 0.73] nmol/g versus 2.41 [SD, 0.37] nmol/g and 0.58 [SD, 0.14] nmol/g for gadopentetate dimeglumine and gadoterate meglumine, respectively) and spinal cord (14.63 [SD, 3.51] nmol/g versus 3.10 [SD, 0.86] nmol/g and 0.62 [SD, 0.23] nmol/g for gadopentetate dimeglumine and gadoterate meglumine, respectively). The deposition of Gd in the sciatic nerve was significantly higher than that in the cerebellum and spinal cord in the gadodiamide group (mean, 62.86 [SD, 12.56] nmol/g versus 5.53 [SD, 0.73] nmol/g and 14.63 [SD, 3.51] nmol/g for the cerebellum and spinal cord, respectively) and gadopentetate dimeglumine group (10.29 [SD, 2.78] nmol/g versus 2.41[SD, 0.37] nmol/g and 3.10 [SD, 0.86] nmol/g for the cerebellum and spinal cord, respectively).

Bar graph depicting the Gd deposition in the cerebellum, spinal cord, and sciatic nerve after the administration of saline, gadodiamide, gadopentetate dimeglumine, and gadoterate meglumine. Error bar represents the SD. Double asterisks indicate P < .01; and triple asterisks, P < .001.
TEM Analysis of Gd Deposits in Cerebellum, Spinal Cord, and Sciatic Nerve
During the TEM evaluation, Gd electron-dense granules were found in the cerebellum, spinal cord, and sciatic nerve of the gadodiamide and gadopentetate dimeglumine groups. These electron-dense granules were mainly observed in the endothelial walls of the capillaries and had a spheric structure similar to sea urchins, with a diameter of 200–300 nm (Fig 4). Energy-dispersive x-ray showed that the electron-dense granules were Gd electron-dense granules. However, no such electron-dense granules were found in either the saline or gadoterate meglumine groups.

Localization of Gd deposits in the cerebellum, spinal cord, and sciatic nerve on day 28 by TEM. Electron-dense granules are indicated by white arrows.
Effect of GBCA Exposure on Heat Hyperalgesia and Mechanical Hyperalgesia
Compared with baseline (right paw, 7.45 [SD, 0.48] seconds; left paw, 7.52 [SD, 0.47] seconds) and the control group (right paw, 7.78 [SD, 0.56] seconds; left paw, 8.02 [SD, 0.54] seconds), on day 28, heat hyperalgesia was found in the right (4.12 [SD, 0.33]seconds [P < .05]) and left paws of the rats in the gadodiamide group (4.03 [SD, 0.23] seconds [P < .05]). Similar trends were observed on day 42 (P < .05) (Fig 5A1, -A2).

Bar graph depicting the effect of GBCA exposure on heat and mechanical hyperalgesia. The time course of heat hyperalgesia in the left (A) and right (B) hind paws of rats treated with GBCAs or saline on days 28 and 42 of the GBCA or saline exposure period. Time course of mechanical hyperalgesia in the left (C) and right (D) hind paws of rats treated with GBCAs or saline. Single asterisk, P < .05; double asterisks, P < .01, compared with the saline group; # indicates P < .05; ##, P < .01, compared with the baseline.
The exposure of the rats to gadodiamide also resulted in mechanical hyperalgesia on day 28 in both the right (withdrawal frequency, 3.78 [SD, 0.53] withdrawals per trial [P < .05 versus the control group and P < .05 versus baseline group]) and left paws (withdrawal frequency, 3.98 [SD, 0.45] withdrawals per trial [P < .05 versus control group and P < .05 versus baseline group]) (Fig 5B1, -B2). In the group treated with gadopentetate dimeglumine, mechanical hyperalgesia was also found on day 28 in both the right (withdrawal frequency, 2.24 [SD, 0.26] withdrawals per trial [P < .05 versus the control group and P < .05 versus baseline group]) and left paws (withdrawal frequency, 2.03 [SD, 0.21] withdrawals per trial [P < .05 versus control group and P < .05 versus the baseline group]). The same results were also observed on day 42. There was no significant difference in heat hyperalgesia and mechanical hyperalgesia between the gadoterate meglumine group compared with baseline and the control group, respectively.
Effect of GBCA Exposure on Spatial Cognitive Function and Muscle Power
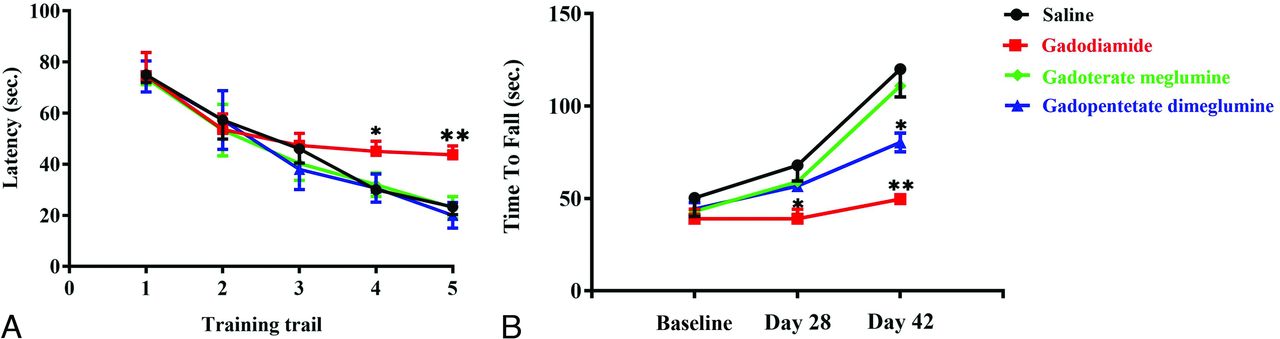
On days 28 and 42 after the injections of GBCAs, the rats in the control, gadopentetate dimeglumine, and gadoterate meglumine groups reached the hidden platform in a significantly shorter time than those in the gadodiamide group (P < .05) (Fig 6A). Similarly, on days 28 and 42 after the injections of GBCAs, the time for rats in the gadodiamide group to stay on the accelerating rotarod was significantly shorter than that in the control, gadopentetate dimeglumine, and gadoterate meglumine groups (P < .05) (Fig 6B). The same results were also observed on day 42.

Effect of GBCA exposure on the Morris water maze test (A) and the accelerated rotarod test (B). The Morris water maze test in rats treated with 0.9% saline solution, gadodiamide, gadopentetate dimeglumine, and gadoterate meglumine before the injection of GBCAs (training trail 1), 28 and 42 days after the injection of GBCA exposure period (A). The tests were conducted on days 28 (training trail 2 and 3) and 42 (training trail 4 and 5) after the injection of GBCAs twice daily. The accelerated rotarod test in rats treated with 0.9% saline solution, gadodiamide, gadopentetate dimeglumine, and gadoterate meglumine before the injection of GBCAs and 28 and 42 days after the injection of GBCA exposure period (B). Error bar represents the SD. Single asterisk, P < .05; double asterisks, P < .01 compared with the saline group.
Histologic Toxicology Findings
The effect of GBCA exposure on spinal cord neurons was assessed by counting the number of neuronal cells and observing the morphology of neurons on days 28 and 42. After 28 and 42 days of tail vein injections of gadodiamide, gadopentetate dimeglumine, and gadoterate meglumine in rats, no morphologic changes or changes in the number of neurons in the spinal cord were induced (Online Supplemental Data). Representative H&E- and Nissl-stained images of the spinal cord region are shown in the Online Supplemental Data. There was no difference among the 4 groups in the structure and morphology of NSE-positive neurons in the spinal cord after 28 days of GBCA injections (Online Supplemental Data). No obvious abnormalities were found in the morphology of GFAP-positive astrocytes among the 4 groups (Online Supplemental Data).
DISCUSSION
The present study evaluated the effects of several common GBCAs on the nervous system of rats. Our results showed that the repeat administration of linear GBCAs and macrocyclic GBCAs resulted in Gd deposition in the brain, spinal cord, and peripheral nerves of rats. Gd detection in the brain is consistent with our previous studies, which showed that linear GBCAs lead to higher Gd deposition than macrocyclic reagents. In general, most studies showed that linear drugs increased the signal intensity of the DN and GP, whereas macrocyclic drugs did not, and the intensity of signal increase was related to the dosage.1,3,13 TEM showed electron-dense Gd deposition in the cerebellum of rats treated with linear GBCAs. These studies mainly focused on the DN in rats. Gd deposits had a spheric spiny shape resembling a sea urchin with a diameter of 200–300 nm and were located in the interstitial space and close to the vascular basement membrane. It is speculated that Gd oxide would be endocytosed by glial cells and eventually accumulate in lysosomes in the form of the nondegradable pigment lipofuscin.18 Some studies showed that TEM found Gd in lipofuscin in the DCN after multiple injections of GBCAs.18,19
At the same time, we found that after Gd deposition, there were no significant effects of GBCAs on pathologic changes in the spinal cord in the number of normal cells, the observation of neuronal cell degeneration, or obvious necrosis. No histopathologic findings were observed on H&E-, Nissl-, and GFAB-stained paraffin sections in the spinal cord. The results of the present study are well in line with histologic observations in other preclinical studies in the brain of rats.20 However, our results indicated that the repeat administration of gadodiamide could cause heat and mechanical hyperalgesia in rats. This possibility suggests that linear GBCAs may trigger the sensitization of spinal nociceptive neurons, consistent with a report by Miller et al,21 who reported that perinatal exposure to linear GBCAs could cause behavioral changes in young rats, mainly manifested as interruptions in motor coordination, tactile sensitivity, and decreases in muscle strength, especially after repeat injections of Gd. Murata et al22 assumed that the ionic radius of free Gd was closed to free calcium and could block the activity of some calcium-dependent enzymes, leading to muscle contractions or nerve-conduction problems. In addition, it can also inhibit some transcription factors, the reticuloendothelial system, phagocytosis, and K+/Cl cotransport channels.23,24 Recent studies found that Gd might affect the energy metabolism of cells by damaging mitochondria and promoting hepatocyte apoptosis by binding with membrane protein mercaptan groups.25 Moreover, our results are consistent with the recent study of Lauer et al,26 and further support the study by Ray et al,27 which showed that a single direct injection of GBCA into the CSF will cause neurotoxic effects, including cognitive impairment. Another in vitro study showed that when neurons were exposed to 1 millimole/liter of linear GBCA, the number of neurites decreased.28 At the same time, it was observed that the energy metabolism of cells decreased significantly, especially during glycolysis. A clinical study showed that patients receiving 1–4 administrations of GBCA had lower accumulations of fluorodeoxyribose on PET/CT examinations compared with patients who had never received GBCA.29
CONCLUSIONS
In general, our results found a significant amount of retained Gd in the spinal cord and peripheral nerves after the administration of both GBCAs. The retention of Gd in the spinal cord and peripheral nerves may cause sensory symptoms and burning pain in the torso and extremities in some patients after GBCA administration. Our findings are important for individuals who are hypersensitive to pain and need multiple MRI examinations. For these patients, we recommend using macrocyclic GBCAs and the lowest dose possible. Gadodiamide decreased the ability of cognition and muscle power. Future research should focus on the mechanism of Gd retention and the effects on sensory and motor neuronal activities after Gd retention.
Acknowledgments
The authors appreciate the assistance of Zicheng Huang from the Center for Molecular Imaging and Translational Medicine of Xiamen University for her technical assistance with the MRI procedures.
Footnotes
This work was supported by Fujian Health Science and Technology Program (grant no. 2023QNB007), the Opening Foundation of Yunnan Provincial Key Laboratory of Entomological Biopharmaceutical R&D (grant no. AG2022014), and Xiamen Science and Technology Program (grant no. 3502Z2020034).
Disclosure forms provided by the authors are available with the full text and PDF of this article at www.ajnr.org.
References
- Received October 6, 2023.
- Accepted after revision March 17, 2024.
- © 2024 by American Journal of Neuroradiology


Jump to section
Related Articles
Cited By...
- No citing articles found.