
Abstract
BACKGROUND AND PURPOSE: Automated CTP postprocessing packages have been developed for managing acute ischemic stroke. These packages use image processing techniques to identify the ischemic core and penumbra. This study aimed to investigate the agreement of decision-making rules and output derived from RapidAI and Viz.ai software packages in early and late time windows and to identify predictors of inadequate quality CTP studies.
MATERIALS AND METHODS: One hundred twenty-nine patients with acute ischemic stroke who had CTP performed on presentation were analyzed by RapidAI and Viz.ai. Volumetric outputs were compared between packages by performing Spearman rank-order correlation and Wilcoxon signed-rank tests with subanalysis performed at early (<6 hours) and extended (>6 hours) time windows. The concordance of selecting patients on the basis of DAWN and DEFUSE 3 eligibility criteria was assessed using the McNemar test.
RESULTS: One hundred eight of 129 patients were found to have adequate-quality studies. Spearman rank-order correlation coefficients were calculated on time-to-maximum >6-second volume, time-to-maximum >10-second volume, CBF <30% volume, mismatch volume, and mismatch ratio between both software packages with correlation coefficients of 0.82, 0.65, 0.77, 0.78, 0.59, respectively. The Wilcoxon signed-rank test was also performed on time-to-maximum >6-second volume, time-to-maximum >10-second volume, CBF <30% volume, mismatch volume, and mismatch ratio with P values of .30, .016, <.001, .03, <.001, respectively. In a 1-sided test, CBF <30% was greater in Viz.ai (P < .001). Although this finding resulted in statistically significant differences, it did not cause clinically significant differences when applied to the DAWN and DEFUSE 3 criteria. A lower ejection fraction predicted an inadequate study in both software packages (P = .018; 95% CI, 0.01–0.113) and (P = .024; 95% CI, 0.008–0.109) for RapidAI and Viz.ai, respectively.
CONCLUSIONS: Penumbra and infarct core predictions between Rapid and Viz.ai correlated but were statistically different and resulted in equivalent triage using DAWN and DEFUSE3 criteria. Viz.ai predicted higher ischemic core volumes than RapidAI. Viz.ai predicted lower combined core and penumbra values than RapidAI at lower volumes and higher estimates than RapidAI at higher volumes. Clinicians should be cautious when using different software packages for clinical decision-making.
ABBREVIATIONS:
- AIS
- acute ischemic stroke
- EF
- ejection fraction
- EVT
- endovascular treatment
- LVO
- large-vessel occlusion
- LKW
- last known well
- Tmax
- time-to-maximum peak
SUMMARY
PREVIOUS LITERATURE:
Automated CTP postprocessing packages have emerged as valuable tools in managing acute ischemic stroke. Multiple software packages are currently available with different algorithms. Their ability to generate comprehensive perfusion maps aids clinicians in swiftly evaluating brain tissue viability, guiding timely interventions, and enhancing stroke care. Differences in Volumetric outputs and triaging large-vessel occlusion using DAWN and DEFUSE 3 criteria between RapidAI and Viz.ai packages are limited. Herein, we aimed to compare these commonly available postprocessing packages.
KEY FINDINGS:
RapidAI and Viz.ai postprocessing packages correlated well in predicting penumbra and infarct core volumes, resulting in equivalent large-vessel occlusion triage using DAWN and DEFUSE3 criteria. However, Viz.ai predicted lower combined core and penumbra values than RapidAI at lower volumes and higher estimates than RapidAI at higher volumes.
KNOWLEDGE ADVANCEMENT:
Both RapidAI and Viz.ai postprocessing packages resulted in equivalent large-vessel occlusion triage using DAWN and DEFUSE 3 criteria. Clinicians should be mindful of potential penumbra and infarct core variability between the packages, particularly in extreme volumes, as it may impact patient selection for mechanical thrombectomy.
Large-vessel occlusion (LVO) strokes of the anterior circulation contribute disproportionately to stroke-related dependence and mortality.1 Mechanical thrombectomy is cost-effective and substantially reduces LVO stroke disability.2⇓-4 Delayed reperfusion leads to worse outcomes. Therefore, accurate and timely LVO identification and endovascular team notification are critical to maximizing the benefit of proved reperfusion therapies.5,6 The use of advanced neuroimaging has been endorsed by the American Heart Association guidelines after the positive results of the Clinical Mismatch in the Triage of Wake Up and Late Presenting Strokes Undergoing Neurointervention with Trevo (DAWN) and Endovascular Therapy Following Imaging Evaluation for Ischemic Stroke 3 (DEFUSE 3) trials in well-selected patients beyond 6 hours of onset of ischemic stroke symptoms.7⇓-9 These 2 trials were based on automated postprocessing results derived from the RapidAI software package (iSchemaView) to triage patients and have proved beneficial for patients with perfusion mismatch. Advances in image analysis software and artificial intelligence technology have facilitated the development of automated infarct core analysis and LVO detection.10⇓-12 The role of CTP is to differentiate between irreversibly infarcted (unsalvageable ischemic core) and potentially salvageable (penumbral) tissues. The brain is repeatedly scanned during the IV infusion of iodinated contrast media to create an attenuation-time curve. Perfusion measurements can then be calculated, such as relative CBV, relative CBF, MTT, and time to maximum peak (Tmax). These are then displayed on a brain map with color scales. Multiple software packages are currently available, and they differ in how the perfusion maps are calculated, possibly resulting in lesion volume variability.13 RapidAI uses a Fourier transform deconvolution algorithm.14,15 In our literature search, we did not find any reference to the implementation details of the Viz.ai algorithm (https://www.viz.ai/). In this study, we assess the outcomes of the 2 most commonly available commercial automated packages: RapidAI and Viz.ai. We also compared the difference between these two software packages in triaging patients for endovascular treatment (EVT) by DAWN or DEFUSE 3 criteria.
MATERIALS AND METHODS
Ethics Approval
Ethics approval HCA Houston Healthcare Kingwood Institutional Review Board has determined this retrospective research activity to be exempt or excluded from Institutional Review Board (IRB) oversight in accordance with current regulations and institutional policy. Our internal reference number for this determination is 2022-1055. There was no direct patient contact in performing this study. In addition, our patients sign a data usage form at registration related to data collection and utilization of their data for research. The research was overseen in our research protocol submitted for IRB review and research committee who holds monthly ethics reviews.
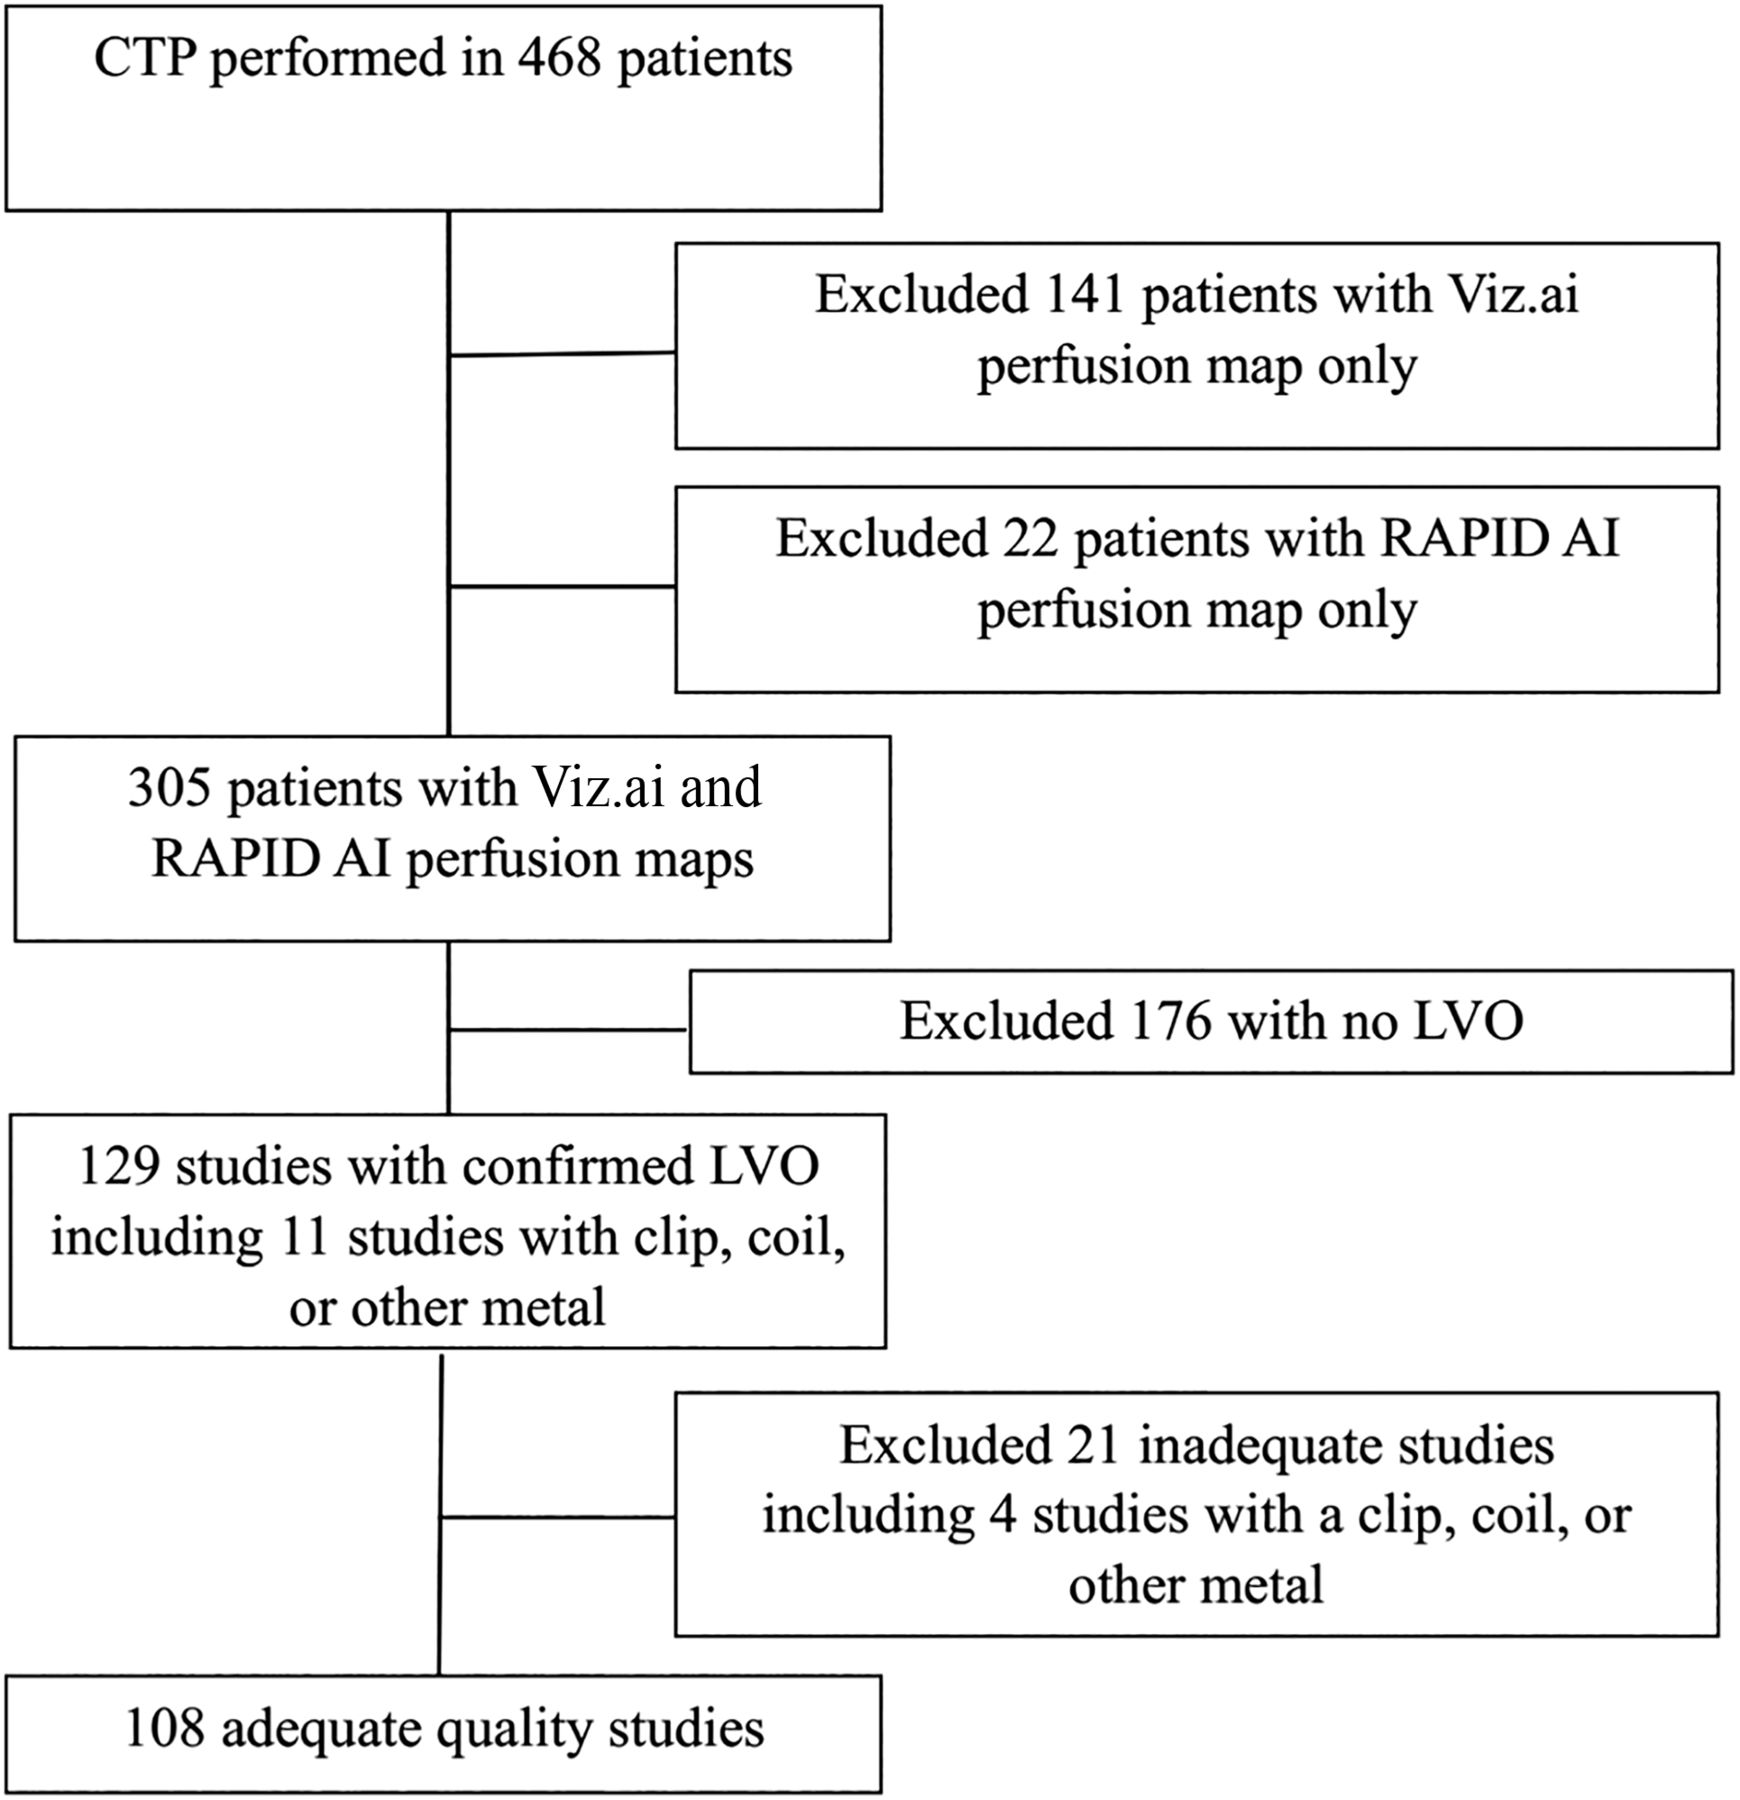
This was a multicenter retrospective study. We reviewed 1025 patients with acute ischemic stroke (AIS) admitted to 3 comprehensive stroke centers in Texas. We excluded patients who did not have both RapidAI and Viz.ai perfusion maps. We then excluded any patients without LVO, resulting in 129 patients from HCA Houston Healthcare Kingwood (n = 60, 46.51%), HCA Houston Healthcare Northwest (n = 24, 18.60%), and Valley Baptist Medical Center Harlingen (n = 45, 34.88%) between October 2020 and August 2023 (Fig 1). We analyzed clinical and radiologic data, including patient sex, age, ethnicity, vascular risk factors, NIHSS score, and intracranial atherosclerosis. We also collected CTP outcome maps. We included patients who met the following criteria: 1) CTP performed on arrival at the comprehensive stroke center within the early (<6 hours) or late (≥6 hours) window from the last known well (LKW), 2) 18 years of age or older, 3) NIHSS score ≥6, and 4) AIS caused by intracranial large-artery occlusion.

Flowchart for patients with LVO and adequate studies. This flow chart illustrates 468 patients with acute ischemic stroke who underwent a CTP study; 305 patients had concurrent RapidAI and Viz.ai perfusion maps available. Analysis was performed on 108 patients with LVO after excluding inadequate studies.
The software packages used in these hospitals during the study period were RapidAI and Viz CTP (Version 1.11; Viz.ai). These software packages create threshold-based output for relative CBF, relative CBV, and time-to-maximum of the residue function Tmax. Preprocedural predicted infarct core volume was calculated on the basis of the relative CBF of <30% threshold, and hypoperfused tissue was calculated on the basis of Tmax of 6 seconds.16 We have compared the perfusion map results from RapidAI and Viz.ai and the agreement between both software packages at different time windows using the Spearman rank-order correlation coefficient and the Wilcoxon signed-rank test. The magnitude of agreement was classified according to the following values: from 0.0 to 0.20 indicating poor agreement; 0.21 to 0.40 indicating fair agreement; 0.41 to 0.60 indicating moderate agreement; 0.61 to 0.80 indicating substantial agreement; and 0.81 to 1.0 indicating excellent agreement.17 Statistical analysis was performed using (Scipy Stats 1.9.1; https://docs.scipy.org/doc/scipy-1.9.1/reference/stats.html).18 The data supporting the findings of this study are available from the corresponding author on reasonable request.
RESULTS
A total of 129 patients were included in the analysis. Of 129 cases, 62 patients presented in the early time window. The NIHSS score on arrival was available in all patients (mean = 16). One hundred seventeen of 129 had a transthoracic echo with an ejection fraction (EF) documented. Nine patients had posterior circulation strokes. Summary statistics related to sex, race, age, comorbidities, smoking status, and features extracted from imaging are shown in the Online Supplemental Data. Viz.ai determined that 115 of the 129 studies were adequate for evaluation. RapidAI determined that 118 of the studies were adequate for evaluation. For the adequate studies, Spearman rank-order correlation coefficients were calculated for a Tmax of >6-second volume, Tmax >10-second volume, CBF <30% volume, mismatch volume, and mismatch ratio, and all were found to be concordant between both software packages of 0.82, 0.65, 0.77, 0.78, 0.59, respectively. The correlation coefficients at the extended time windows remained concordant at 0.88, 0.61, 0.7, 0.87, 0.80 for ≥6 hours and 0.74, 0.63, 0.83, 0.69, 0.78 for <6 hours, respectively (Online Supplemental Data). A 2-sided Wilcoxon signed-rank test was also performed on Tmax >6-second volume, Tmax >10-second volume, CBF <30% volume, mismatch volume, and mismatch ratio with P values of .306, .016, <.001, .03, and <.001. There was a statistically significant difference in CBF <30% volume at <6 hours (P < .001) and >6 hours (P = .007) between RapidAI and Viz.ai. We also performed a subanalysis using the median as a cutoff and directional Wilcoxon signed-rank tests. This showed that Tmax >6-second Viz.ai predicted lower values than RapidAI at volumes lower than the median (Tmax >6-seconds < 78.5 mL, P < .001), but at high volumes, Viz.ai predicted higher values than RapidAI at volumes higher than the median (Tmax >6 seconds > 78.5 mL, P = .029). In contrast, for CBF <30%, Viz.ai predicted greater irreversible ischemic core volumes at volumes above CBF <30% < 9.5 mL, P = .002 and below the median (CBF <30% > 9.5 mL, P < .001).
Plots of the values and the lines of best fit are shown in Figs 2–5. We also ran a logistic regression on RapidAI and Viz.ai on whether the study was determined to be inadequate for analysis. The variance inflation factor was calculated for each variable to look for violations in the multicollinearity assumption of the logistic regression. Decreased EF predicted an inadequate study in Viz.ai (P = .024) and RapidAI (P = .018). Also, in Viz.ai, there were no intracranial hemorrhages in the data set to determine how that would impact study adequacy. There were 11 total studies with a clip, coil, or other metal, and 4 of these studies were marked as inadequate by Viz.ai, and none were marked as inadequate by RapidAI. Statistically, in Viz.ai, the presence of a clip, coil, or other metal predicted an inadequate study (P = .042). In contrast, in RapidAI, all studies with a clip, coil, or other metals were adequate (Table). We could not run a model with perfect separation, which was not included in the logistic regression with RapidAI. Additionally, we applied the DAWN and DEFUSE 3 criteria to the 35 eligible patients and performed a McNemar test on the confusion matrix. There was no significant statistical difference in triaging patients to thrombectomy intervention based on the DAWN and DEFUSE 3 eligibility criteria, as shown in Fig 6. Eligibility criteria are shown in the Online Supplemental Data. We have calculated the mean of the difference between the Tmax >6 seconds and CBF <30% volumes and found that the means of the absolute value of the differences were 32.36 and 9.5 mL, respectively. We partitioned the data because our clinicians reported a larger discrepancy between the software packages with larger infarct core and penumbra values. For Tmax >6 seconds, the mean absolute value of the difference was 16.81 (SD, 15.65) mL when volumes were less than the median of 78.5 and 38.40 (SD, 38.47) mL when the volumes were greater. For CBF <30%, the mean absolute difference was 1.8 (SD, 2.3) mL when volumes were less than the median of 9.5 and 15.07 (SD, 13.28) mL when the volumes were greater. Additionally, we calculated the mean (SD) of the absolute difference between the volumes of Viz.ai and RapidAI. In patients in whom the LKW was ≥6 hours, the mean absolute difference of Tmax >6 seconds was 34.05 (SD, 35.08) mL and CBF <30% was 10.35 (SD, 11.37) mL. For patients with an LKW of <6 hours, the mean absolute difference of Tmax >6 seconds was 33.00 (SD, 40.06) mL and CBF <30% was 8.84 (SD, 12.79 ) mL.

Tmax RapidAI and Viz.ai scatterplot of values with regression lines. This figure shows scatterplots and regression lines for Tmax >4 seconds (A), Tmax >6 seconds (B), Tmax >8 seconds (C), and Tmax >10 seconds (D). The regression equation is noted in the top left of each subplot.

CBF RapidAI and Viz.ai scatterplot of values with regression lines. This figure shows scatterplots and regression lines for CBF <20% (A), CBF <30% (B), CBF <34% (C), and CBF <38% (D). The regression equation is noted in the top left of each subplot.

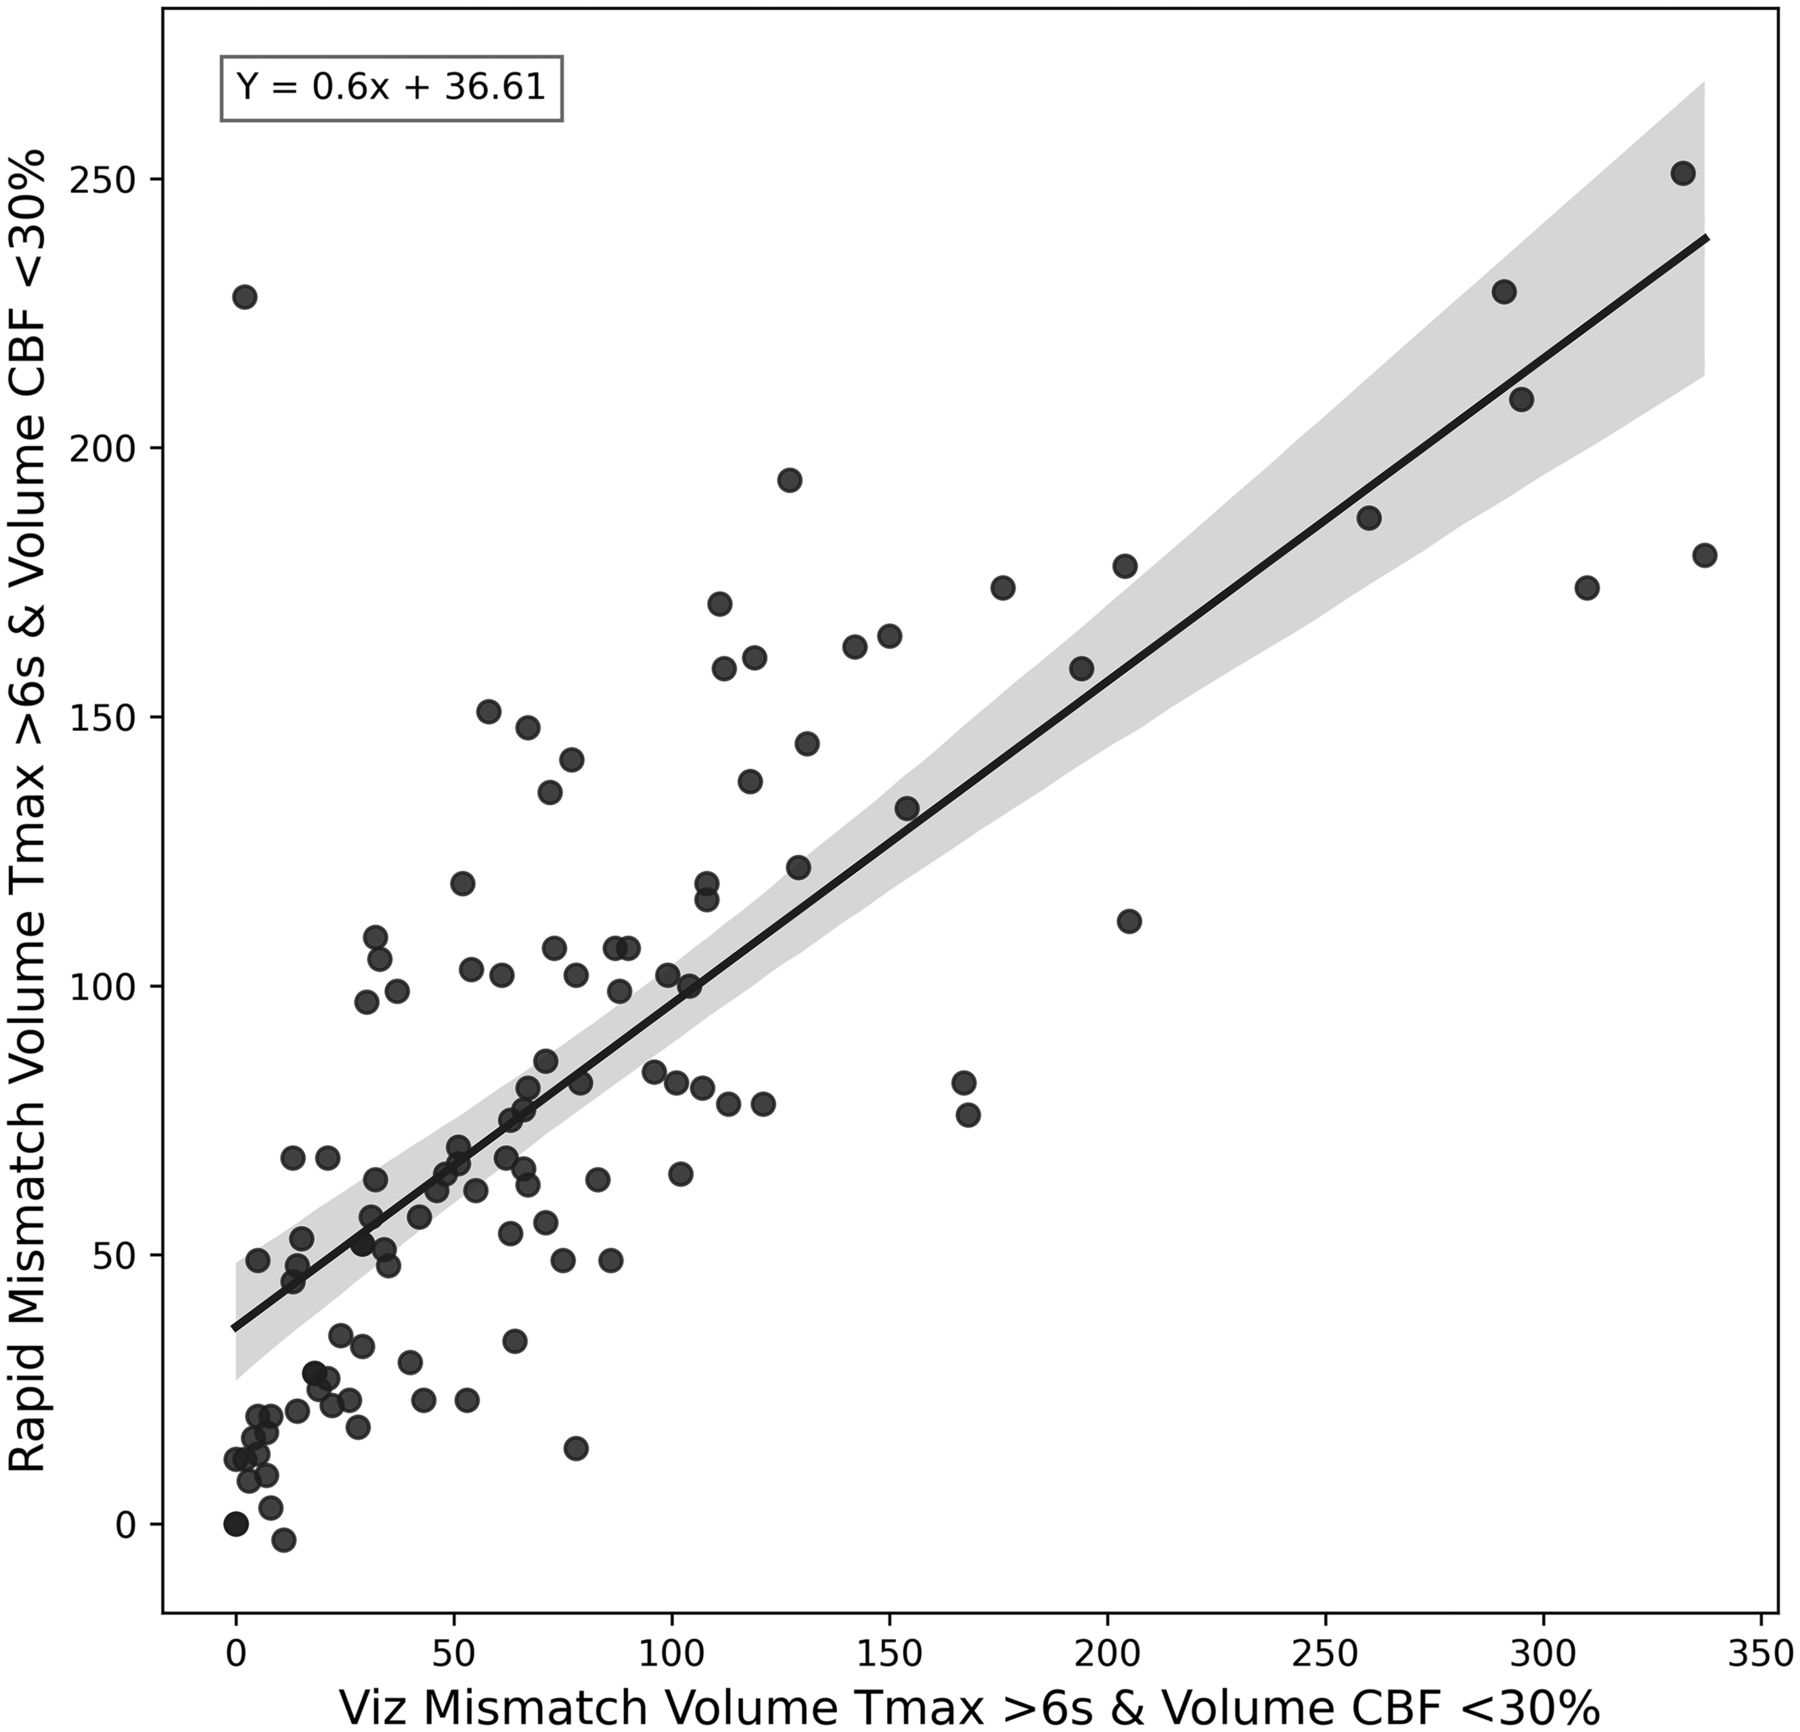
Mismatch volume comparison between RapidAI and Viz.ai. This figure shows a scatter plot and a regression equation between the mismatch volumes calculated from the CBF <30% and the Tmax <6 seconds. The regression equation is shown in the top left of the plot.

Mismatch ratio comparison between RapidAI and Viz.ai. This figure shows a scatterplot and a regression equation between the mismatch ratio calculated from the CBF <30% and the Tmax <6 seconds. The regression equation is shown in the top left of the plot. If either software produced a nan (not a number) or inf (infinity) value the point was removed from the plot.

DAWN and DEFUSE 3 confusion matrices. This figure shows the DAWN and DEFUSE 3 confusion matrices for patients who had an ICA or proximal MCA occlusion. These matrices show whether a patient is a candidate for thrombectomy based on these criteria. A McNemar test was performed on these matrices that did not show a statistically significant marginal inhomogeneity of states.
DISCUSSION
CT perfusion imaging has become an important tool for triaging patients with AIS and determining the need for recanalization. Automated imaging analyses are increasingly used as selection tools for the EVT of LVO in the 6- to-24-hour time window. RapidAI software has been widely used in several large trials to estimate the volumes of ischemic core and perfusion lesions, with several guidelines relying on these trials.7⇓⇓-10 We compared RapidAI and Viz.ai software packages directly on the same image set to determine agreement with commonly used perfusion map parameters, predictors of poor quality CT perfusion studies, and differences between RapidAI and Viz.ai on selecting patients with LVO stroke based on DAWN or DEFUSE 3 criteria.
RapidAI CTP and Viz.ai CTP software packages were highly correlated with correlation coefficients of 0.82 and 0.77, respectively, but produced statistically significantly different irreversibly ischemic cores (P < .001). This correlation remained significant in different time windows from LKW. The software packages were highly correlated at an early time window (<6 hours), with Tmax >6 seconds (correlation coefficient = 0.86) and CBF <30% (correlation coefficient = 0.71). There was also excellent correlation at an extended time window (≥6 hours) for Tmax >6 (correlation coefficient = 0.87) and substantial for CBF <30% (correlation coefficient = 0.87), but the estimates of the ischemic core were statistically significantly different by the Wilcoxon signed-rank matched pairs test. This finding shows that values can be correlated but are different. For Tmax >6 seconds, Viz.ai showed statistically significantly lower values than RapidAI at volumes lower than the median (P < .001). In contrast, at volumes of Tmax >6 seconds higher than the median of 78.5mLs, Viz.ai predicted higher values than RapidAI (P = .029). We have also shown that Viz.ai consistently predicts higher irreversibly infarcted core (CBF <30%) than RapidAI.
The software differed by increased volumes at larger penumbra and core infarct values. The linear regression used to create the line of the Tmax >6-second plot had an intercept of 39 and a slope of 0.614. This finding indicates that RapidAI had larger predictions at lower volumes and Viz.ai had larger values at larger volumes, consistent with the subanalysis performed with the Wilcoxon signed-rank test. This prediction asymmetry suggests imperfections in the core and penumbra estimates from one or either software and merits additional investigations and potential optimization. In future studies, we will examine how this impacts the final infarct volumes on MR DWI sequences after thrombectomy. Our study illustrates that in clinical practice, RapidAI and Viz.ai software produce statistically significantly different-but-highly correlated perfusion maps, and differences in volumes that are produced do not significantly change which patients are selected for thrombectomy on the basis of the predicted infarct core and penumbra volumes in the DAWN and DEFUSE 3 criteria. With the increase of large core infarct trials, the DAWN and DEFUSE 3 criteria are being used less in clinical practice, and the situations in which clinicians decide to use CTP are evolving.19,20 With CTP being applied in different clinical scenarios, it is incredibly important that physicians understand that using different software packages may produce different results that can impact their decisions.
A recently published study21 reviewed 242 patients with anterior circulation LVO and compared preprocedural prediction of final infarct volumes. The authors used RapidAI, Version 4.5.0, to analyze CTP maps on patient presentation. Then, Viz CTP, Version 1.3 (Viz.ai) automated software package was retrospectively applied to patients with ICA or MCA M1 occlusions. The median time from LKW to CTP time was 402 (interquartile range = 181–790) minutes. Similar to our findings, this study revealed that RapidAI and Viz.ai had an excellent correlation for Tmax >6 seconds (correlation coefficient = 0.81) and a substantial correlation for CBF <30% (correlation coefficient = 0.76), but the study did not look directly at differences in volumes. Our study is unique because RapidAI and Viz.ai were mostly run concurrently, with some images run after image collection to augment our sample size. Running the software packages concurrently provides a real-world comparison of the 2 software packages with their competing versions, can potentially reduce bias, and gives real-world insight to hospitals looking to adopt these packages. Also, we included LVOs in the MCA M1, MCA M2, and ACA as well as the posterior circulation. We included patients in the ultra-early window presenting within 3 hours from the onset of symptoms and patients with unknown LKW. The median LKW to CTP time was 300 (interquartile range = 142.5–607.5) minutes.
Our Wilcoxon signed-rank tests showed that Viz.ai consistently predicts larger core infarcts better than RapidAI at all volumes and timeframes. Overestimation of the infarct core is well-described in the literature and is considered a critical pitfall of CTP in patients presenting in the early time window.22 Clinicians should be aware of this ghost infarct core (defined as initial core minus final infarct >10 mL) and exercise caution. We could not find a clear difference in predictions of the irreversibly ischemic core infarct when patients had CTP performed at <6 hours and at >6 hours by either software package.
The estimation of the ischemic core volume and tissue at risk (penumbra) is an important step in the evaluation and triaging of patients with LVO. In a subgroup of our cohort (35 patients of 129), we evaluated the performance of RapidAI and Viz.ai software packages in triaging patients with LVO based on DAWN and DEFUSE 3 selection criteria. Clinical and/or neuroimaging eligibility criteria included in DAWN and DEFUSE 3 were applied for individual patient triaging to determine the concordance of treatment decisions based on these 2 software packages. Specifically, mismatched profiles and mismatched volumes were calculated accordingly by using volumetric results. Then eligibility for mechanical thrombectomy was derived from each package for individual patients with AIS, and the agreement of patient triage was measured (represented on the confusion matrix). We performed a McNemar test on the confusion matrix and found that there was no significant difference between triage classification based on DAWN criteria (P = 1.00), which suggests that clinicians can use either software to triage patients with LVO for the extended time window. This finding is consistent with a recent study from the University of Cincinnati that analyzed 54 patients in whom the authors found no difference in the final decision to proceed with EVT by using either software when both DEFUSE 3 and DAWN criteria were considered.23 Another recent study compared RapidAI and RealNow (http://drbrain.net/product-nb_en.aspx) software packages, and a diagnostic agreement based on DEFUSE 3 criteria was analyzed in a subgroup of patients. Concordance on the triaging agreement was found in 16/19 (84%) cases in subgroups with package-A-based infarct core volume of > 70 mL and in 143/155 cases (92%) in the subgroup with infarct core volume < 70 mL. A subgroup with a large ischemic core or core of <70 mL led to discordance in mismatched profiles, which affected patient selection for mechanical thrombectomy.24
Finally, we evaluated the factors that contributed to inadequate interpretation by the software packages. In both RapidAI and Viz.ai, we found that a lower EF led to an inadequate study (P = .018; 95% CI, 0.01–0.113) and (P = .024; 95% CI, 0.008–0.109) for RapidAI and Viz.ai, respectively. To our knowledge, our study is the first to reveal this finding. A recent study evaluated CTA in 47 patients with LVO and found that a low EF was a predictor of incorrect identification of the LVO in both RapidAI and Viz.ai software packages.25 A study that evaluated contrast curve truncation in CTP protocols found that reduced left ventricle EF and hypertension resulted in the truncation of CTP data and a lower-quality study.26 In our study, there were no intracranial hemorrhages in the data set to determine how that would impact study adequacy. In the Viz.ai software, we found that the presence of a clip, coil, or other metal predicted an inadequate study (P = .042; 95% CI, −3.225 and −0.057), but the software only labeled 4/11 of the studies as inadequate. This result is likely because the software has a step during preprocessing that detects images with metal and removes those images. This explanation indicates that the software’s metal-detection algorithm of the software could detect some of the metal. RapidAI has included the feature in a future version but this was not available to us at the time of this publication.
There are several limitations in our study. This is a retrospective study design with an inherent risk of bias. However, the data are from 3 high-volume comprehensive stroke centers, and automated perfusion images were obtained during an overlap period on the same patient population using RapidAI and Viz.ai. Second, we did not collect data on the brands of CT scanners used to obtain the images. The CTP acquisition protocol (section thickness and collimator) information was not collected. Looking at final infarct volumes on MR DWI is outside the scope of this study, but in a future study, we will certainly make volume measurements of this MR DWI after thrombectomy and compare this volume with the CTP CBF <30% prediction of the irreversible ischemic core. Our goal was to determine whether there was a difference between the output of these 2 software packages to determine whether clinicians could use these data to make similar conclusions, and we have found that Viz.ai produces higher values than RapidAI. In a future study, we will compare CBF and the final infarct volume and look at how the CTP maps may predict poor thrombectomy outcomes.
CONCLUSIONS
Infarct core and penumbra predictions between Rapid and Viz.ai software were highly correlated but statistically different and resulted in equivalent patient triage based on DAWN and DEFUSE 3 eligibility criteria. Viz.ai produced consistently higher predictions of irreversible infarct core volumes than RapidAI. Viz.ai predicted lower combined core and penumbra values than RapidAI at lower volumes and predicted higher combined core and penumbra estimates than RapidAI at higher volumes. Users should be aware of these differences in triaging patients for mechanical thrombectomy, and further investigation should be performed into the accuracy of these two software packages.
| Study | Coefficient | Standard Error | Z | P >|z| | [0.025 | 0.975] |
|---|---|---|---|---|---|---|
| Viz adequate study | ||||||
| Age | −0.0179 | 0.021 | –0.858 | .391 | −0.059 | 0.023 |
| Sex | 0.0418 | 0.634 | 0.066 | .947 | −1.2 | 1.284 |
| Diabetes | −0.1406 | 0.628 | –0.224 | .823 | −1.371 | 1.09 |
| CHF | 1.422 | 1.082 | 1.314 | .189 | −0.699 | 3.543 |
| EF | 0.0583 | 0.026 | 2.265 | .024 | 0.008 | 0.109 |
| Clip, coil, or other metal | −6559 | 0.816 | –2.029 | .042 | −3.255 | –0.057 |
| NIHSS on arrival | –0.0187 | 0.034 | -0.557 | .577 | −0.084 | 0.047 |
| RapidAI adequate study | ||||||
| Age | −0.019 | 0.021 | –0.898 | .369 | –0.061 | 0.023 |
| Sex | 0.2462 | 0.662 | 0.372 | .71 | −1.052 | 1.544 |
| Diabetes | −0.0579 | 0.652 | –0.089 | .929 | −1.335 | 1.219 |
| CHF | 1.4731 | 1.089 | 1.353 | .176 | −0.661 | 3.607 |
| EV | 0.0615 | 0.026 | 2.357 | .018 | 0.01 | 0.113 |
| NIHSS on arrival | 0.0368 | 0.034 | 1.088 | .277 | −0.03 | 0.103 |
Note:—CHF indicates congestive heart failure.
↵a We performed a logistic regression to find predictors of adequate and inadequate studies. The table includes P values, confidence intervals, and coefficients for each predictor.
Logistic regression study adequacy for RapidAI and viz.aia
Footnotes
This research was supported (in whole or in part) by HCA Healthcare and/or an HCA Healthcare affiliated entity. The views expressed in this publication represent those of the author(s) and do not necessarily represent the official views of HCA Healthcare or any of its affiliated entities.
The HCA Healthcare has a minority equity stake in Viz.ai and also purchases products from the company for use in its facilities. Ameer Hassan is a consultant and a speaker for Viz.ai, which develops the Viz LVO algorithm that we tested, and he is also involved in a study sponsored by Viz.ai called the LVO Synchronise Study, which looks at the impact of a Viz LVO implementation on patient timing and outcomes.
Disclosure forms provided by the authors are available with the full text and PDF of this article at www.ajnr.org.
References
- Received November 12, 2023.
- Accepted after revision February 6, 2024.
- © 2024 by American Journal of Neuroradiology


Jump to section
Related Articles
Cited By...
- No citing articles found.