
Abstract
BACKGROUND AND PURPOSE: Previous studies have reported metal accumulation and microstructure changes in deep gray nuclei (DGN) in Wilson disease (WD). However, there are limited studies that investigate whether there is metal accumulation and microstructure changes in DGN of patients with WD with normal-appearing routine MRI. This study aimed to evaluate multiparametric changes in DGN of WD and whether the findings correlate with clinical severity in patients with WD.
MATERIALS AND METHODS: The study enrolled 28 patients with WD (19 with neurologic symptoms) and 25 controls. Fractional anisotropy (FA), mean diffusivity (MD), and magnetic susceptibility in globus pallidus, pontine tegmentum, dentate nucleus, red nucleus, head of caudate nucleus, putamen, substantia nigra, and thalamus were extracted. Correlations between imaging data and the Unified Wilson’s Disease Rating Scale (UWDRS) neurologic subitems were explored.
RESULTS: FA, MD, and susceptibility values were higher in multiple DGN of patients with WD than controls (P < .05). Patients with WD without abnormal signals in DGN on routine MRI also had higher FA, MD, and susceptibility values than controls (P < .017). We found that UWDRS neurologic subscores correlated with FA and susceptibility values of DGN (P < .05). In addition, we also found that FA and susceptibility values in specific structures correlated with specific neurologic symptoms of WD (ie, tremor, parkinsonism, dysarthria, dystonia, and ataxia) (P < .05).
CONCLUSIONS: Patients with WD have increased FA, MD, and susceptibility values even before the lesion is morphologically apparent on routine MRI. The increased FA and susceptibility values correlate with clinical severity of WD.
ABBREVIATIONS:
- CN
- head of the caudate nucleus
- DGN
- deep gray nuclei
- DN
- dentate nucleus
- FA
- fractional anisotropy
- GP
- globus pallidus
- GRE
- gradient echo
- ICC
- intraclass correlation coefficient
- MD
- mean diffusivity
- PT
- pontine tegmentum
- Put
- putamen
- QSM
- quantitative susceptibility mapping
- RN
- red nucleus
- SN
- substantia nigra
- TH
- thalamus
- UWDRS
- Unified Wilson’s Disease Rating Scale
- WD
- Wilson disease
Wilson disease (WD) is a rare autosomal recessive disorder marked by the pathologic deposition of copper, primarily in the liver and brain.1 A few postmortem studies reported edema, demyelination, gliosis, and metal deposition in the brain of patients with WD.2⇓⇓-5 Because of the lack of reliable, practical, and easily available in vivo markers for the evaluation of pathologic changes in the brain of patients with WD, the understanding of the pathophysiology of WD-related neurodegeneration and the exploration of potential neuroprotective treatments have all been hampered. Presently, advancements in MR imaging enable the investigation of evolving pathologic changes in WD through utilization of quantitative parametric mapping measures.6,7
DTI is a noninvasive technique for the evaluation of microstructure changes of the brain based on the diffusion properties of water molecules.8 Fractional anisotropy (FA) is the main parameter of DTI and is commonly used to identify microstructure changes of the brain tissue and mean diffusivity (MD), which provides a comparison mechanism for identifying regions of increased bulk diffusivity that may represent the increase of tissue water content.8 Abnormal FA in the basal ganglia and brainstem of patients with WD has been previously reported.9⇓-11 Another novel MRI technology is the evaluation of metal content in the brain. A postmortem histopathology study has confirmed the iron deposition in the basal ganglia of patients with WD.5 Paramagnetic metal deposition in the brain, particularly iron, can be estimated by quantitative susceptibility mapping (QSM).12 Studies using QSM have revealed increased susceptibility values in the basal ganglia, thalamus (TH), red nucleus (RN), and substantia nigra (SN) of patients with WD.6,13⇓⇓-16 Nonetheless, most of the studies have not explored the presence of microstructural abnormalities and metal deposition in the basal ganglia and brainstem of patients with WD before detecting abnormal signals on routine MRI scans. Although studies have found that susceptibility values and diffusion parameters in deep gray nuclei (DGN) are associated with the clinical severity of WD,15⇓-17 there has been no study to investigate correlations between imaging data and Unified Wilson’s Disease Rating Scale (UWDRS) neurologic subitems.
We hypothesized that patients with WD may have microstructural abnormalities and metal accumulation before the lesion is morphologically apparent on conventional MRI, and tissue metal deposition and microstructure changes in specific structures may be associated with specific symptoms of WD. The study aimed to investigate microstructural abnormalities and metal accumulation in DGN of patients with WD and whether the findings correlated with the neurologic symptoms of patients with WD.
MATERIALS AND METHODS
Subjects
This prospective observational study was approved by the local Medical Ethics Committee. From December 2018 to November 2020, 31 WD subjects and 25 healthy volunteers were enrolled in the study, and informed consents were signed before participation. WD was diagnosed according to the Leipzig diagnostic scoring system,18,19 and the diagnosis was established if the total score ≥4. Neurologic symptoms of WD were evaluated by 2 neurologists with consensus (X.-Z.J., >5 years of experience; X.-Z.Y., >5 years of experience) by using UWDRS neurologic subscale, consisting of 27 items with a total of 208 points.20 Any disparities in opinions were resolved through consultation and were finally confirmed by a third neurologist (X.-P.W., >35 years of experience) (Online Supplemental Data). MRI data were collected on 1.9 ± 0.6 days after UWDRS data were collected. The exclusion criteria included a history of other neuropsychiatric diseases and liver disorders, severe hepatic decompensation, and hepatic encephalopathy. Controls were enrolled from college students and their families or friends, and their age and sex distribution were comparable to those patients with WD.
Imaging Acquisition
All the participants were imaged by a 3T MRI scanner (Prisma Fit, Siemens Healthineers) with a 20-channel head coil. The DTI data were acquired by using a spin-echo echo-planar-imaging sequence with the following parameters: TR = 8500 ms, TE = 63 ms, 64 noncoplanar gradients orientations with a b-value of 0 and 1000s/mm2, FOV = 224 mm × 224 mm, matrix = 112 × 112, slice thickness = 2 mm, number of slices = 75, and scan time = 10 min 56 seconds. QSM images were generated from a 3D spoiled multi-echo gradient echo (GRE) sequence, and imaging parameters were: TR = 31 ms, flip angle = 12°, number of echoes = 6, TE1 = 4.07 ms, ΔTE = 4.35 ms, FOV = 240 × 200 mm2, matrix size = 288 × 240, slice thickness = 0.8 mm, number of slices = 192, parallel imaging acceleration factor = 2, voxel size = 0.83 × 0.83 × 0.80 mm3, scan time = 7 min 22 seconds. High-resolution T1-weighted structural images, T2-weighted images, and T2-weighted fluid-attenuated inversion recovery images were also acquired.
Data Processing
QSM reconstructions were performed using the Morphology Enabled Dipole Inversion (MEDI) toolbox, including phase unwrapping, field fitting, background field removal, and field-to-source inversion.21 A more detailed description of the methods was discussed in our previous work.15
The FMRIB Software Library was used for the preprocessing of DTI data.22 The first scan image of the DTI was used as a reference image for eddy current and head motion correction. The gradient directions were then rotated in response to the eddy current corrections, and nonbrain tissue was removed from the diffusion volumes by using BET. Diffusion tensor maps were created from the eddy current and motion-corrected volumes by using an open-source library diffusion in Python (also called Dipy).23
ROIs contained SN, putamen (Put), globus pallidus (GP), pontine tegmentum (PT), head of the caudate nucleus (CN), dentate nucleus (DN), RN, and TH. ROIs were drawn manually on QSM images by using insight toolkit-snake automatic partitioning (ITK-SNAP) software (www.itksnap.org) by 2 raters (X.-Z.J., >5 years of experience; X.-Z.Y., >5 years of experience) (Fig 1). The images with a b-value of zero were acquired from the DTI data with a b-value of 0. So we could maintain the same ROIs used for DTI index and susceptibility value, the images with a b-value of 0 were registered to the first echo of magnitude images from GRE by using linear registration. Then, the transformation matrix was applied to FA and MD maps. ROIs segmented on QSM images were applied to FA and MD maps after registration. The average FA, MD, and susceptibility values within ROIs were calculated for further analysis.

QSM images, FA, and MD maps from a healthy control (30-year-old man). Regions of interest (1st column) drawn on the QSM images were applied to fractional anisotropy maps (3rd column). ppb indicates parts per billion.
Statistical Analyses
The χ2 test was applied to analyze sex differences between patients with WD and controls. The interrater reliability of manual ROI segmentation was assessed by using intraclass correlation coefficients (ICCs) for the 2 raters. A Kolmogorov-Smirnov test was employed to assess the distribution of continuous variables before data analysis. A general linear model framework, including a Student t test (controls versus all patients with WD) and one-way analysis of variance (controls versus patients without visual abnormalities in DGN versus patients with visual abnormalities in DGN), with age and sex as covariates, was applied to compare FA, MD, and susceptibility values between groups. Associations of FA, MD, and susceptibility values with clinical indicators were assessed through partial correlation analysis to control for differences in age, sex, and disease duration. The P values of multiple comparisons and correlation analysis were corrected by controlling the false discovery rate at a level of .05. Pair-wise comparisons were performed among 3 groups, post hoc comparisons were corrected by Bonferroni correction, and P < .017 (0.05/3) was considered significant. Data analyses were undertaken by using SPSS Statistics 25 (IBM).
RESULTS
Subject Characteristics
Two patients with motion artifacts and 1 patient with T1 hyperintensities in the GP were excluded from the study. A total of 28 patients with WD and 25 controls were included for further analysis. Of the 28 patients with WD, 19 patients presented with neurologic symptoms (neuro-WD), including tremor (16, 84%), parkinsonism (14, 74%), dysarthria (13, 68%), dystonia (10, 53%), ataxia (6, 32%), and choreoathetosis (1, 5%). There was no significant difference in sex and age between patients with WD and controls. Demographic and clinical characteristics of WD and controls are summarized in the Online Supplemental Data.
Interrater Reliability
The interrater reliability of ROI voxel volume manually segmented by 2 raters was evaluated by using ICC analysis. The ICC value of voxel volume ranged from 0.981 to 0.993, indicating a good interrater consistency across all ROIs (Online Supplemental Data). Owing to the excellent consistency between the 2 raters, the results of FA, MD, and susceptibility values were the average values measured by the 2 raters.
Conventional MRI Findings
In our study, 24 of 28 patients with WD exhibited abnormal signals in 1 or more DGNTH were 16 (57%), 8 (29%), 16 (57%), 12 (43%), 18 (64%), 14 (50%), 14 (50%), and 19 (68%), respectively. Signal abnormalities in DGN of WD can be found in the Online Supplemental Data.
Quantitative Evaluation Using DTI and QSM
The FA values of patients with WD were significantly greater than those of controls in the CN (d = 0.876, P = .005), DN (d = 1.269, P < .001), GP (d = 1.141, P < .001), Put (d = 1.989, P < .001), RN (d =1.202, P < .001), and SN (d = 0.624, P < .022) (Fig 2A and Online Supplemental Data). The MD values of patients with WD were significantly increased in the CN (d = 0.892, P = .003), Put (d = 1.289, P < .001), RN (d = 2.172, P = .001), and TH (d = 1.578, P < .001) compared with controls (Fig 2B and Online Supplemental Data). Susceptibility values in patients with WD were significantly increased in the CN (d = 1.204, P < .001), GP (d = 1.623, P < .001), Put (d = 1.865, P < .001), RN (d = 1.022, P < .001), SN (d = 1.732, P < .001), PT (d = 1.468, P < .001), and TH (d = 1.751, P < .001) compared with controls (Fig 2C and Online Supplemental Data).

Comparison of fractional anisotropy (A), mean diffusivity (B), and susceptibility values (C) in DGN between patients with WD (n = 28) and healthy controls (n = 25). * indicates P < .05; **, P < .01; and ***, P < .001; Error bars indicate the standard error of the mean; ppb, parts per billion.
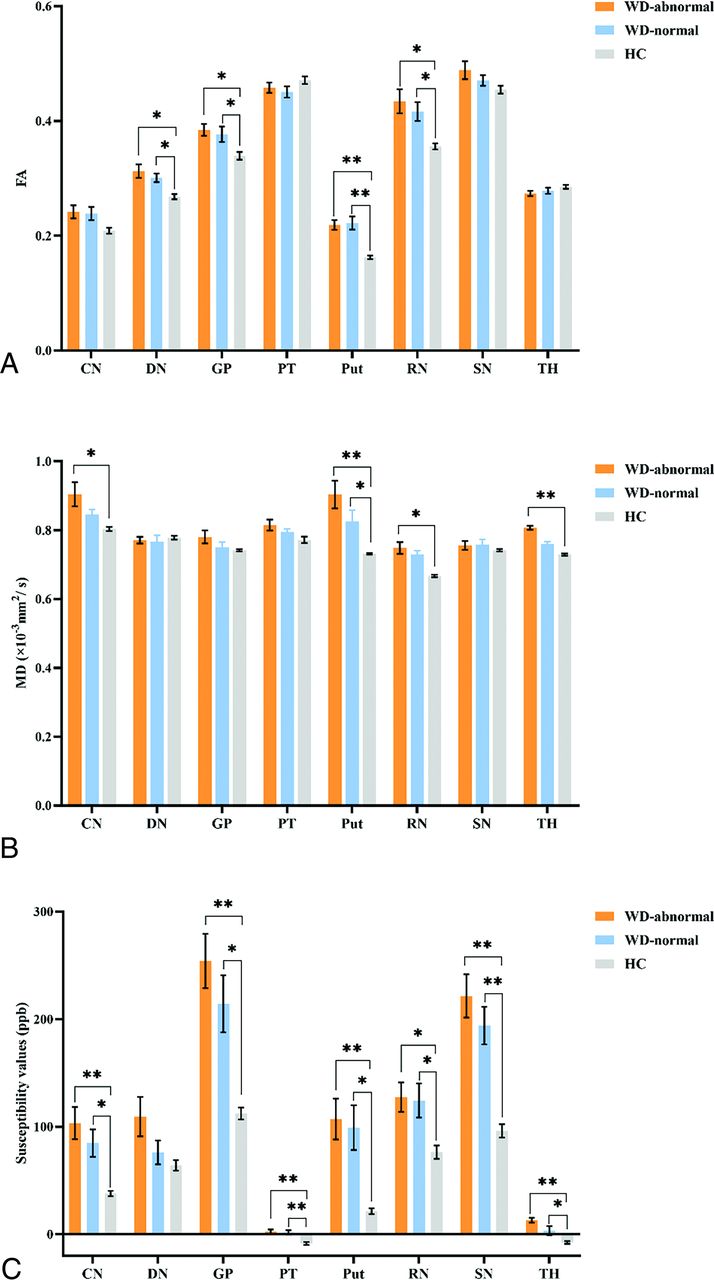
Considering that most patients with WD exhibit abnormal signals on routine MRI in 1 or more DGN, it is of little significance to compare 24 patients with signal abnormalities in DGN versus 4 patients without abnormal signals. Therefore, for each nucleus, we investigated FA, MD, and susceptibility value alterations in patients with WD with and without abnormal signals on routine MRI in that nucleus compared with controls, respectively. Patients with WD with signal abnormalities in the DN (d = 1.806, P = .003), GP (d = 1.211, P = .002), Put (d = 2.204, P < .001), and RN (d = 0.447, P = .001) on conventional MRI showed a significant increase of FA values in those regions compared with the control group (Fig 3A and Online Supplemental Data). Patients without abnormal signals in the DN (d = 1.204, P = .004), GP (d = 1.185, P = .007), Put (d = 2.087, P < .001), and RN (d = 1.413, P = .013) on routine MRI also showed an increase of FA values in those nuclei (Fig 3A and Online Supplemental Data). Patients with signal abnormalities in the CN (d = 1.126, P = .003), Put (d = 1.575, P < .001), RN (d = 1.994, P = .004), and TH (d = 1.642, P < .001) on routine MRI showed an increase of MD values in those areas compared with the control group (Fig 3B and Online Supplemental Data). Patients with normal-appearing Put also revealed an increase of MD values in the Put (d = 1.672, P = .012) compared with the control group (Fig 3B and Online Supplemental Data).

Comparison of FA (A), mean diffusivity (B), and susceptibility values (C) in patients with and without visual abnormalities on routine MRI in DGN with healthy controls. * indicates P < .017, **, P < .001; Error bars indicate the standard error of the mean; CN (n = 16); DN (n = 8); GP (n = 16); PT (n = 12); Put (n = 18); RN (n = 14); SN (n = 14); TH (n = 19); ppb, parts per billion; N, number of patients with abnormal signal in that nucleus on routine MRI; WD-abnormal, patients with WD with signal abnormality in DGN on routine MRI; WD-normal, patients with WD with normal-appearing in DGN on routine MRI.
For the susceptibility values, patients with visual abnormalities in the CN (d = 1.291, P < .001), GP (d = 2.135, P < .001), PT (d = 1.640, P < .001), Put (d = 1.631, P < .001), RN (d = 1.304, P = .014), SN (d = 2.446, P < .001), and TH (d = 2.487, P < .001) on routine MRI revealed higher susceptibility values in those areas compared with controls. Patients who were normal-appearing in the CN (d = 1.755, P = .022), GP (d = 1.814, P = .005), PT (d = 1.435, P < .001), RN (d = 1.118, P = .010), Put (d = 2.157, P = .008), SN (d = 2.127, P < .001), and TH (d = 1.264, P = .013) on routine MRI also showed a significant increase of susceptibility values in those nuclei (Fig 3C and Online Supplemental Data). There was no significant difference in FA, MD, and susceptibility values between DGN with and without signal abnormalities on routine MRI.
Correlation Analysis
First, we analyzed the correlations of FA, MD, and susceptibility values of DGN with clinical indicators in patients with WD (Fig 4 and Online Supplemental Data). After controlling for differences in age, sex, and course of disease, a positive correlation was noted between the UWDRS scores of neurologic patients with WD and FA values of the CN (r = 0.512, P = .043), GP (r = 0.543, P = .030), RN (r = 0.578, P = .019), and SN (r = 0.521, P = .038). For the susceptibility values, positive relationships were observed between the UWDRS score of neurologic patients with WD and the susceptibility values of CN (r = 0.521, P = .038), GP (r = 0.522, P = .038), Put (r = 0.539, P = .031), and RN (r = 0.546, P = .029) (Fig 5 and Online Supplemental Data). No other correlation was observed between MD and clinical indicators in patients with WD.

Correlations of FA of DGN with UWDRS neurologic subscore (UWDRS-N) in patients with neurologic form of WD.

Correlations of susceptibility values of DGN with UWDRS neurologic subscore (UWDRS-N) in patients with neurologic form of WD. ppb indicates parts per billion.
We evaluated in more detail whether FA, MD, and susceptibility values in specific structures are associated with specific neurologic symptoms of patients with WD (Online Supplemental Data). After adjusting the potential influence of sex, age, and disease course, positive relationships were noted between UWDRS dysarthria score and FA values of CN (r = 0.528, P = .036) and RN (r = 0.577, P = .019), as well as susceptibility values of DN (r = 0.632, P = .009) and TH (r = 0.549, P = .028). A positive relationship was noted between parkinsonism in patients with WD and FA values of RN (r = 0.749, P = .001) and SN (r = 0.602, P = .014) as well as susceptibility values of DN (r = 0.730, P = .001) and RN (r = 0.550, P = .027). There was a positive relationship between UWDRS tremor score and FA value of GP (r = 0.526, P = .036). A negative correlation was observed between UWDRS tremor score and FA value of TH (r = −0.620, P = .010). Positive associations were observed between UWDRS dystonia score and FA values of CN (r = 0.498, P = .050), RN (r = 0.646, P = .007), and SN (r = 0.554, P = .026) as well as susceptibility values of DN (r = 0.588, P = .016) and GP (r = 0.542, P = .030). UWDRS ataxia score revealed a positive correlation with FA values of RN (r = 0.673, P = .004) and SN (r = 0.572, P = .021) as well as susceptibility values of DN (r = 0.547, P = .028) and RN (r = 0.702, P = .002).
DISCUSSION
In this study, diffusion tensor imaging and quantitative susceptibility mapping were used to evaluate the combined changes of microstructure changes and metal deposition in DGN of WD. We found that FA, MD, and susceptibility values in multiple DGNs of patients with WD were much higher than controls. The increased FA, MD, and susceptibility values were observed even in DGN that was normal-appearing on routine MRI. In addition, we found that FA and susceptibility values in specific structures correlated with specific clinical symptoms of neuro-WD.
MRI Findings
In this study, we observed significantly higher FA and MD values in multiple DGN of patients with WD than in controls. Previous studies have reported that an increase of FA in gray matter was a signal for gliosis,24 and gliosis in the cortical gray matter showed a significant positive correlation with axial diffusivity. It has been reported that cytotoxic edema may lead to the increase of FA and the decrease of MD, while vasogenic edema may result in the decrease of FA and the increase of MD. Demyelination in white matter may lead to a decrease in FA.25,26 We found that the changes of FA and MD in multiple DGNs are not completely consistent. Thus, we speculate that the alterations in FA and MD in DGN may be associated with a combination of different pathologic changes. CN, DN, GP, RN, Put, and SN predominantly consist of gray matter. The changes observed in FA and MD values within these regions may stem from a complex interplay involving gliosis, cytotoxic edema, and vasogenic edema. Our study found increased MD in TH, which contains a great quantity of white matter fiber tracts. A previous DTI study reported increased MD and decreased FA in TH, and authors attributed these changes to the demyelination processes of the TH.
Our study also found elevated susceptibility values in DGN of WD. The most affected region is the Put, with a more than 400% increase in susceptibility values in patients with WD compared with healthy volunteers. Neuropathologic studies also reported that patients with WD exhibit typical pathologic alterations, with tissue damage of Put being the most serious. We attribute the increase of magnetic susceptibility to the increased iron concentration because a previous postmortem study found that R2* values in GP and Put of WD are closely associated with iron concentration, but not copper content.5 Another postmortem validation study also reported a strong linear correlation between R2* values and iron concentration in the basal ganglia regions.27 It is important to note that Cu2+ species are paramagnetic, and we cannot rule out that they may have some effect on quantitative measurements. Considering that the concentration of iron in DGN is approximately 3 times higher than that of copper even in patients with neuro-WD and the strong paramagnetism of iron species, we speculate that the contribution of copper to magnetic susceptibility in DGN of WD is rather small.
Approximately 90% of patients with neuro-WD and 40%–70% of hepatic patients with WD may have 1 or more abnormal signals in the basal ganglia or brainstem.1 Previous studies have reported an increase in FA and susceptibility values primarily in the basal ganglia and brainstem of WD.9,14,15,28,29 However, there is limited research on whether there are pathologic changes in DGN that are normal-appearing on routine MRI. Our study found increased FA, MD, and susceptibility values even in DGN with normal appearance on routine MRI. Patients with WD without visual abnormalities in the GP, RN, Put, and DN on routine MRI showed higher FA in these regions than controls. In addition, our study found that patients with WD without abnormal signals in the CN, PT, GP, SN, and Put on conventional MRI also revealed higher susceptibility values in these regions compared with controls. Increased MD was also noted in the Put without signal abnormalities on conventional MRI. These results indicate that FA and susceptibility values may be abnormal before the lesion becomes morphologically apparent on routine MRI, which helps to identify and determine the true extent of the abnormality at an early stage. These findings also reflect the microstructural changes and metal deposition of DGN in an early stage in patients with WD.
Correlations between Imaging Data and UWDRS Neurologic Subitems
In the current study, we observed that the measured FA and susceptibility values of DGN correlated with the severity of clinical symptoms. Positive correlations of FA in CN, GP, RN, and SN with the UWDRS neurologic score of patients with WD were observed, indicating that patients with higher FA in CN, GP, RN, and SN may exhibit more severe clinical symptoms. These relationships were also investigated in previous diffusion imaging studies. Jadav et al7 found a significant relationship between MD of the anterior limb of the right internal capsule and neurologic symptom score. Favrole et al17 also found a positive association between modified Rankin scale and diffusivity measurement of the Put. In addition, we also found a positive correlation between susceptibility values of CN, GP, Put, and RN with the severity of clinical symptoms. However, Dusek et al28 reported that there was no correlation between susceptibility values of DGN and UWDRS score. This discrepancy may be caused by heterogeneity of clinical manifestations, different disease courses, and analytic methods.
We investigated whether diffusion indices and susceptibility values in specific structures are associated with specific clinical symptoms of patients with WD. We noted that FA values of CN and RN, as well as susceptibility values of DN and TH showed a positive correlation with dysarthria in patients with WD. Our findings that microstructural alterations and metal deposition in specific structures associated with specific symptoms in patients with neuro-WD may help to tailor an individualized therapy for each patient.
Limitations
This study also has several limitations. First, the present study is an observational study with a small sample size, and a longitudinal study with a larger sample size is still required to refine the present study. Second, our study found that DGN with normal appearance on routine MRI also had higher FA and susceptibility values than controls. Whether these changes in FA and susceptibility will return to normal after treatment deserves further study. Third, the study included only patients with mild-to-moderate clinical manifestations, whereas more advanced disease was underrepresented.
CONCLUSIONS
By using DTI and QSM, we found higher FA, MD, and magnetic susceptibility in multiple DGN of patients with WD. In addition, an increase in FA and susceptibility values was also observed in DGN without abnormal signals on routine MRI compared with controls. Finally, our study found that the increased FA and susceptibility values in specific regions were associated with specific clinical symptoms of patients with WD. Our findings may provide a new window for further investigation of neuropathologic changes of WD by using a multiparametric quantitative brain MRI.
Acknowledgments
We would like to thank all the participants for their time and effort.
Footnotes
Xiao-Zhong Jing and Gai-Ying Li contributed equally to this article.
This research has been supported by the National Natural Science Foundation of China (Nos. 82201572), and all authors have no conflicts of interest to declare.
Disclosure forms provided by the authors are available with the full text and PDF of this article at www.ajnr.org.
References
- Received October 30, 2023.
- Accepted after revision February 12, 2024.
- © 2024 by American Journal of Neuroradiology


Jump to section
Related Articles
Cited By...
- No citing articles found.