
Abstract
BACKGROUND AND PURPOSE: The abnormalities of the long arm of chromosome 18 (18q) constitute a complex spectrum. We aimed to systematically analyze their MR imaging features. We hypothesized that there would be variable but recognizable white matter and structural patterns in this cohort.
MATERIALS AND METHODS: In this retrospective cohort study, we included pediatric patients with a proved abnormality of 18q between 2000–2022. An age- and sex-matched control cohort was also constructed.
RESULTS: Thirty-six cases, median MR imaging age 19.6 months (4.3–59.3), satisfied our inclusion criteria. Most were female (25, 69%, F:M ratio 2.2:1). Fifty MR imaging studies were analyzed, and 35 (70%) had delayed myelination. Two independent readers scored brain myelination with excellent interrater reliability. Three recognizable evolving MR imaging patterns with distinct age distributions and improving myelination scores were identified: Pelizaeus-Merzbacher disease–like (9.9 months, 37), intermediate (22 months, 48), and washed-out pattern (113.6 months, 53). Etiologically, MRIs were analyzed across 3 subgroups: 18q deletion (34, 69%), trisomy 18 (10, 21%), and ring chromosome 18 (5, 10%). Ring chromosome 18 had the highest myelination lag (27, P = .005) and multifocal white matter changes (P = .001). Trisomy 18 had smaller pons and cerebellar dimensions (anteposterior diameter pons, P = .002; corpus callosum vermis, P < .001; and transverse cerebellar diameter, P = .04).
CONCLUSIONS: In this cohort of 18q chromosomal abnormalities, MR imaging revealed recognizable patterns correlating with improving brain myelination. Imaging findings appear to be on a continuum with more severe white matter abnormalities in ring chromosome 18 and greater prevalence of structural abnormalities of the pons and cerebellum in trisomy 18.
ABBREVIATIONS:
- 18q-
- 18q deletion
- 18q
- long arm of chromosome 18
- APD
- anteroposterior diameter
- CC
- corpus callosum
- CCD
- craniocaudal diameter
- FOD
- fronto-occipital diameter
- GWMD
- gray-white matter differentiation
- PMD
- Pelizaeus-Merzbacher disease
- TCD
- transverse cerebellar diameter
SUMMARY
PREVIOUS LITERATURE:
Genetic disorders affecting the long arm of 18q are heterogeneous. These can variably affect the zygosity of genetic material including suprazygosity or duplicated genetic material (trisomy or tetrasomy 18) and hemizygosity or missing genetic material (18q deletion [18q-], ring chromosome 18). Recent advancements have led to the creation of gene dosage maps to narrow down clinical phenotypes to the affected 18q segment and zygosity state. Even though imaging findings are well studied in the 18q-, similar MR imaging correlates are not well established mainly because of limited cohort data regarding MR imaging phenotypes across other genetic disorders affecting 18q.
KEY FINDINGS:
Three discernible MR imaging patterns suggesting age-evolving myelination phenotypes were noted across the 18q spectrum. A diverging spectrum of MR imaging changes emerged across the 18q subgroups with the most pronounced white matter changes (highest myelination lag, multifocal white matter changes) in ring chromosome 18 and significantly reduced pons and cerebellar biometry in trisomy/tetrasomy 18.
KNOWLEDGE ADVANCEMENT:
Our results indicate a particular vulnerability of pons and cerebellum in suprazygous 18q states, white matter susceptibility (with pons and cerebellar sparing) in ring chromosome 18, and intermediate changes in 18q-. These results may offer insights into understanding complex mechanisms and gene dosage effects in these disorders.
Abnormalities of the long arm of chromosome 18 (18q) constitute a spectrum of clinical and imaging phenotypes and are among the commonest chromosomal abnormalities.1 The long arm can get affected through complex mechanisms including and not limited to duplication (trisomy or tetrasomy 18) or deletion (18q deletion [18q-], ring chromosome 18) of particular segments or in entirety. These typically lead to abnormalities across multiple organ systems, including the CNS, affecting each to a variable degree. Affected individuals can exhibit a uniquely affected long arm with variations in the length (from a single gene to large segments) and location of the involved segments, rendering highly variable and diverse phenotypes.2
There has already been a perceptible shift in research and clinical practice towards recognizing the effects of these alterations at a genetic level to better define the clinical phenotypes with predictive outcomes. Individually, the genes on 18q chromosome have diverse biologic roles, are dosage sensitive and thus may be variably affected by hemizygosity (missing genetic material including deletions) or suprazygosity (duplicated genetic material including trisomy, tetrasomy).3 This has led to the creation of gene dosage maps (https://wp.uthscsa.edu/chrome-18/research/) in an attempt to narrow down phenotypes to specific genes or select regions of chromosome 18 and classified according to states of zygosity.4,5
This has renewed interest in understanding the imaging changes in this group of disorders collectively. Imaging findings from CNS involvement are highly variable, ranging from white matter abnormalities to malformative changes including commissural hypoplasia, migrational defects, hydrocephalus, porencephaly, cerebellar hypoplasia, pituitary abnormalities, and microcephaly.1,6⇓–8 Studies examining comparative differences across these disorders are sparse in the current literature. Systematic analysis of imaging remains limited to 18q- cohorts with limited MR imaging descriptions of the other abnormalities.9⇓⇓⇓⇓⇓–15 While white matter changes are well-described in 18q-, proposed to be due to delayed myelination from myelin basic protein gene haploinsufficiency with a possible yet undefined role of some other potential genes,1 these remain poorly characterized across the rest of the 18q spectrum largely because of smaller cohort numbers.13⇓–15
We aimed to systematically analyze MR imaging features across a cohort of cases with abnormalities involving 18q including deletion, trisomy, tetrasomy, inversion, and ring chromosome 18 with particular attention to white matter abnormalities as well as malformative features. We also hypothesized that there would be temporally evolving myelination patterns with age in this cohort and the white matter would be variably affected across the 18q spectrum.
MATERIALS AND METHODS
Methodology
This research ethics board (REB)–approved single-center study retrospectively included children with abnormalities affecting the 18q segment over a period of 22 years (2000–2022) through a search of electronic medical records. The inclusion criteria were: 1) age between 0–18 years, 2) confirmed abnormality of 18q with karyotype analysis, 3) MR imaging with at least a T1- and T2-weighted sequence, performed at any time during the course of illness.
Clinical findings were documented when available. MR imaging was performed on either 1.5T or 3T MR imaging scanners. Signal characteristics were assessed on axial fast spin-echo T2 and axial gradient-echo T1-weighted images. We leveraged a previously described 18-region age-appropriate myelination scoring system to systematically assess cerebral, cerebellar, and brainstem myelination and calculated T1 and T2 myelination scores by using standardized definitions.16,17 Individual structures were scored as 0 (lack of myelination) to 2 (complete myelination), and total scores deviating by more than 2 from age-expected scores were rated as abnormal.16 These were independently assessed by 2 fellowship-trained pediatric neuroradiologists (P.M., P.K. with 4- and 12-year neuroradiology experience, respectively), and interrater reliability (IRR) was assessed for T1 and T2 scores for each structure and the total myelination score. To further qualitatively assess the white matter changes, dominant myelination patterns were discerned and compared for T1, T2, total myelination scores, and myelination lag (expected myelination score − total myelination score). We analyzed differences between age distribution, changes in biometrics, and myelination score parameters across the patterns.
The MRIs were additionally reviewed in consensus for regions with focal signal changes. We also compared the definition and thickness of the peripheral cerebellar white matter stripes on T1 sagittal images (Online Supplemental Data) at the level of the trigone to age-matched controls in the cases older than 18 months of age, when an adult-expected pattern is reached.18
For biometric measurements, 2 fellowship-trained neuroradiologists conducted an initial pilot review of 10 cases to establish standardization in application of biometric measurement criteria, and as an excellent agreement has been demonstrated for these measurements across multiple prior studies;19⇓–21 subsequent measurements were performed by consensus review of cases. The corpus callosum (CC) was assessed quantitatively by using standardized methods including CC anteroposterior diameter (APD) and thickness of CC segments (genu, body, and splenium).19 To produce normalized ratios, fronto-occipital diameter (FOD) was also measured.19 Brainstem and cerebellar measurements, including pons APD, craniocaudal diameter (CCD) vermis, and transverse cerebellar diameter (TCD), were also collected by using standardized methods.20,21 The CC, brainstem, and cerebellar biometry were compared with age-matched reference data, considered small when <3rd percentile.16,19,20 An age- and sex-matched control cohort was also constructed using MRIs of developmentally intact children with normal imaging for comparison of the biometric parameters.
Statistical analysis and data visualization were performed by using SPSS version 25 and Python 3.7.8. Data from the collected variables were assessed for normality by using the Shapiro-Wilk test. Statistical differences across parametric and non-parametric continuous variables were assessed using one-way ANOVA and Kruskall-Wallis tests, respectively, and adjusted with post-hoc analysis for multiple comparison tests as necessary.22 The chi square and Fisher exact tests were used for analysis of categoric data, and the Wilcoxon signed-rank test was used for comparison with the control group.23 Interrater reliability was measured using intraclass correlation coefficient calculated via a two-way mixed model based on absolute agreements, and standardized cut-offs for levels of agreement were used.24 All statistical tests were 2-sided, and statistical significance was assumed at P = .05.
RESULTS
Thirty-six cases satisfied our inclusion criteria (Table 1). Out of these, 18q- formed the largest group (23 cases, 64%). Median age at MR imaging was 19.6 months (4.3–59.3) and majority were females (25, 69%, F:M ratio 2.2:1). Availability of clinical data and documentation were variable and available for less than one-half of the cases as detailed.
Cohort characteristics
Fifty MR imaging studies from 36 cases were analyzed (Table 1). Thirty-three out of the 36 cases (92%) had at least 1 abnormal MR imaging. Abnormal white matter was the commonest abnormality, present in 70% (35 MRIs). Structurally, CC abnormalities were the most common finding, noted in 60% (30 studies), followed by small CCD vermis dimension (14 studies, 28%) and small APD pons (10 studies, 20%).
Control Cohort Comparison
Biometric measurements were also obtained from an age- and sex-matched control cohort of 100 cases (median age 45.4 months, 13.4 – 111.2; Online Supplemental Data). All biometric measurements pertaining to the CC, pons, and cerebellar dimensions were significantly smaller than the controls (P ≤ .001). FOD measurements were also significantly smaller in the 18q group. As smaller head dimensions could have had confounding effects on the brainstem and cerebellar biometry, the data was normalized by obtaining FOD ratios. The normalized ratios were smaller but not significantly different from the control group.
Myelination Scoring and Pattern Assessment
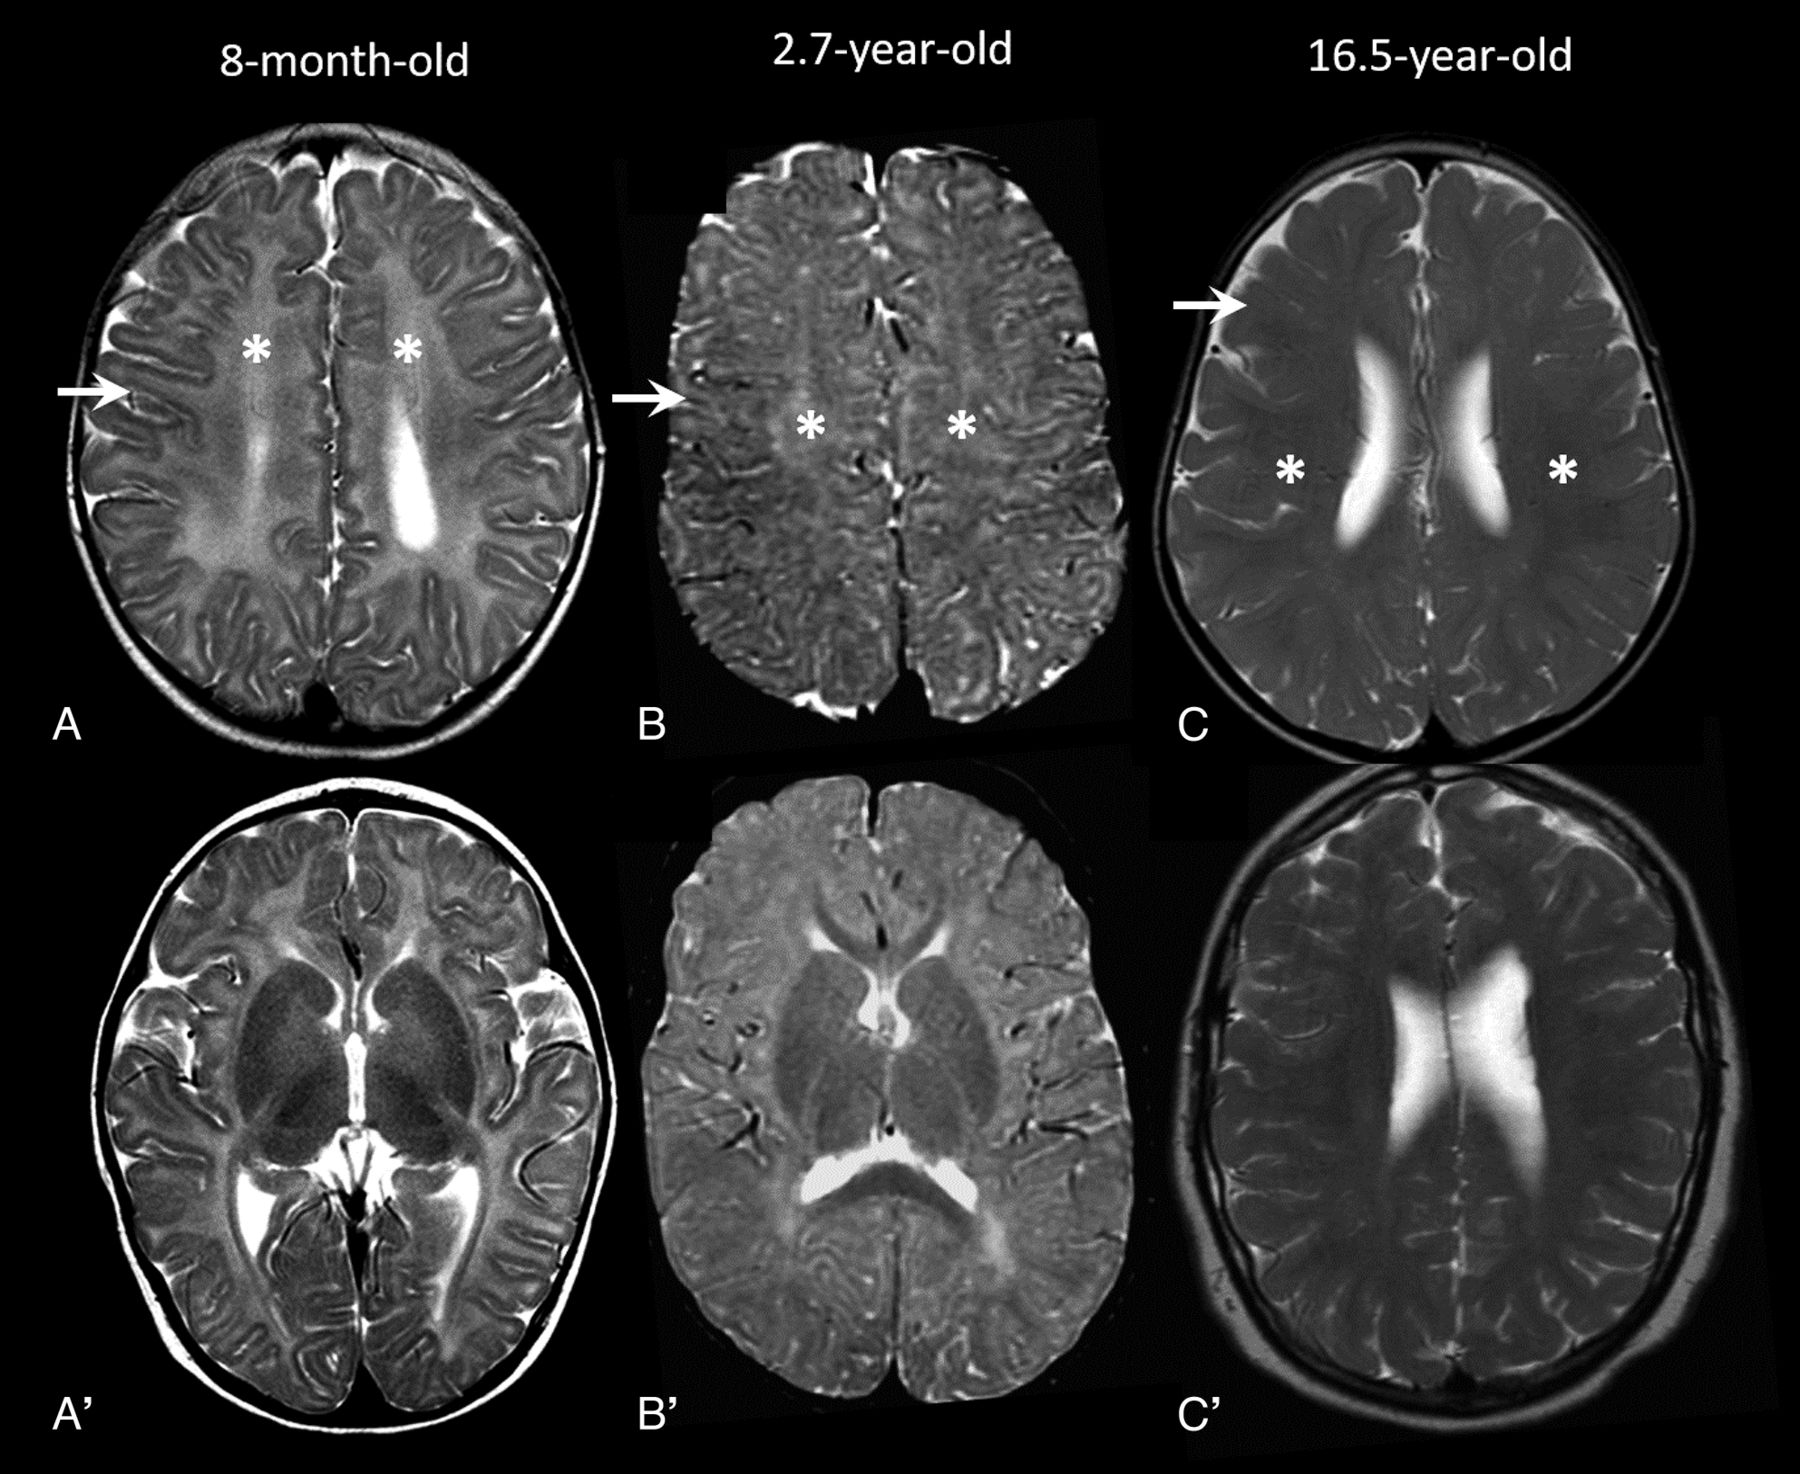
Fifteen (30%) MRIs had an age-appropriate appearance of the white matter. The remaining 35 MRIs (70%) had white matter abnormalities consistent with a delayed myelination pattern but were different across the cohort. Additionally, scattered multifocal foci of FLAIR hyperintensity (not compatible with the described MR imaging patterns) were noted in 4 MRIs (8%, age range 15.2–199.6 months, median, IQR 198.3, 106.1–213.5 months). We identified 3 dominant patterns (Fig 1) that were defined as: 1) Pelizaeus-Merzbacher disease (PMD)–like pattern where myelination was diffusely and homogeneously lacking with a homogeneously hyperintense T2 white matter signal change. In this pattern, the gray-white matter differentiation (GWMD) was preserved and could be defined in all regions; 2) intermediate pattern: where there was a dirty heterogeneous white matter signal, often having a dot-like appearance with inhomogeneous GWMD and mixed areas of preserved and loss of GWMD; and 3) washed-out pattern where the T2 hyperintensity was milder and the GWMD was diffusely poor.

MR imaging patterns in 3 different cases. A and A', A PMD-like pattern with diffuse T2-hyperintensity of white matter (asterisk) and preserved GWMD (arrow). B and B', The “intermediate pattern” with mixed areas of preservation and loss of GWMD (arrow) with dirty inhomogeneous white matter appearance (asterisk). C and C'. The “washed-out pattern” with milder diffuse abnormal signal (asterisk) with diffusely poor GWMD (arrow).
For myelination scoring, there was excellent agreement between the readers with all ICC scores >0.75 (Online Supplemental Data). The analysis revealed distinct age distributions of the patterns, suggesting a temporally evolving myelination phenotype with the youngest cases having a PMD-like pattern (8 MRIs, 16%, median age: 9.9 months) and the oldest cases demonstrating a washed-out pattern (17 MRIs, 34%, median age: 113.6 months; Online Supplemental Data) with significantly and temporally improving T1, T2, and total myelination scores. There remained a median myelination lag of 18 points in comparison to age-matched controls, which was most severe in the intermediate-pattern group (age range 15.4–49 months). Corresponding to improving myelination, significant temporal improvements were also noted in the CC, pons and cerebellar biometry across the 3 patterns (Online Supplemental Data).
Analysis of Focal Signal Changes
The closed-eye sign of medial lemniscus (Fig 2), described in literature as a better myelinated T2 hypointense medial lemniscus than the surrounding structures25 and also seen transiently during normal myelination of brainstem,26 was seen in 9 (18%) studies and more commonly with the PMD-like pattern (Online Supplemental Data). A mild focal T2 hyperintensity involving the middle blade of splenium at the midline (Fig 2) was seen in 3 cases (1 each in 3 patterns) and was only mildly T1 hypointense. Poor cerebellar white matter arborization with less robust peripheral stripes and T1 signal (Online Supplemental Data) were found in 26 (53%) MRIs, most in the washed-out pattern (16, 94%). In 6 (35%) of the washed-out pattern MRIs, an accentuated T2 hyperintensity was noted in the occipital lobes and posterior limb of internal capsule.

Focal signal changes and small pons. Axial T2 images show relatively better myelination and T2 hypointensity of the medial lemniscus (arrows, A) in the dorsal brainstem (closed-eye sign) and focal midsplenial T2 hyperintensity (arrow, B). Axial T2 (C) and FLAIR (D) images in an 18-year-old with ring chromosome 18 show multiple scattered focal hyperintensities in the frontal (dashed arrows) and parietal (solid arrows) white matter in the background of a washed-out MR imaging pattern. Midline sagittal sections in 2 trisomy 18 cases at 1 and 3 months (E and F, respectively) showing a reduced APD of pons (dashed arrow, E and F) and agenesis of CC in case 2 (arrow, F). Normal appearance of the pons in age-matched controls provided for reference in the inset images (E' and F').
Cases with Follow-Up MR Imaging
Eleven cases in our cohort had at least 1 follow-up MR imaging with a total of 25 MRIs and an average of 2.2 MR imaging studies (25 MRIs/11 cases). Nine cases had 18q- and 1 case each had 18 tetrasomy and ring chromosome 18. An age-expected final myelination score (ie, myelination lag of 0) was attained in only 2 children, 1 each with 18q- and 18 tetrasomy. In the other 9 children, an average final myelination lag of 14.8 points remained at follow-up.
All 11 cases with a follow-up study showed myelination progression (increase in myelination score) on the follow-up MR imaging. Among these, 7 cases (64%, average age at MR imaging 109 months) showed a decreasing myelination lag (age-expected myelination score – patient myelination score) or partial “myelination catch-up” on follow-up while 4 cases (36%, average age at MR imaging 101 months) showed an increase in myelination lag (failure of “myelination catch-up”) on follow-up despite myelination score progression.
Comparative Analysis of 18q Subgroups
Three groups were analyzed: 18q- (23, 34 MRIs), ring chromosome 18 (4, 5 MRIs), and trisomy 18 (8, 10 MRIs) group (Table 2; expanded table in Online Supplemental Data). A single case of tetrasomy 18 was assessed together with the 7 trisomy 18 cases. A single case of 18q inversion was excluded from the subgroup analysis as this was the only case, and there were complex changes in the genetic material. Ring chromosome 18 group had the highest prevalence of white matter abnormalities (5, 100%), though this was not significantly different from other groups. Ring chromosome 18 also had significantly higher prevalence of multifocal white matter changes (3, 60%, P = .001) and the highest levels of myelination lag (27, P = .005, .03 versus trisomy 18, 18q- groups, respectively). CC abnormalities and dimensions were not significantly different. Cerebellar and pons biometry, however, including APD pons, CCD vermis, and TCD, were all significantly smaller in the trisomy 18 group (P = .002, <.001, .04, respectively). These were also smaller than the third percentiles for age-referenced data for the trisomy 18 group. FOD normalized ratios for pons and vermis, including APD pons/FOD and CCD vermis/FOD, remained significantly smaller indicating an effect independent of an overall smaller head size. There were no significant differences between MR imaging patterns across the groups.
Comparative analysis of the spectrum of imaging findings across the 18q chromosome abnormalities
Core Imaging Features and 18q Subgroups
Based on the above analysis, 4 core features were noted (delayed myelination, multifocal white matter changes, small pons, small vermis), and their distribution and overlaps in the 18q-, ring chromosome 18, and trisomy 18 groups were assessed and represented with respective Venn diagrams (Fig 3, Table 3). In the 18q- group, 30/34 MRIs had at least 1 of the core features. Among these, most had isolated delayed myelination (21/30, 70%) or delayed myelination with a small pons and/or a small vermis (4/30). Five cases of 18q- had an isolated small vermis or small pons. In trisomy 18 group, all MRIs had at least 1 of the core features (10, 100%) and a small pons and/or a small vermis were almost always present (9, 90%). None of the ring chromosome 18 MRIs had a small pons or vermis, and delayed myelination was present in all (5, 100%), either in isolation (2, 40%) or with multifocal white matter abnormalities (3, 60%).

Venn diagram and table detailing MR imaging core feature distribution across etiology subgroups (90% or greater: +++; 50%–70%: ++; <20%: +).
Venn diagram and table detailing MR imaging core feature distribution across etiology subgroups (90% or greater: +++; 50%–70%: ++; <20%: +)
DISCUSSION
In this retrospective cohort study of 50 MRIs from 36 cases with 18q abnormalities, 3 evolving MR imaging patterns of delayed myelination with distinct age distributions and progressing myelination scores were identified: PMD-like (9.9 months, 37), intermediate (22 months, 48), and washed-out pattern (113.6 months, 53; P = .01), with temporally improving CC, pons, and cerebellar dimensions. Myelination and structural changes were on a spectrum across the 3 18q subgroups. Most severe white matter involvement with the highest myelination lag (27, P = .005 versus trisomy 18, P = .03 versus 18q-) and multifocal white matter changes (P = .001) were noted in the ring chromosome 18 subgroup, while the most advanced cerebellar and pontine hypoplasia was noted in the trisomy 18 subgroup (APD pons P = .002, CCD vermis P < .001, and TCD P = .04) independent of effects from a smaller head size. The distribution of the core imaging features including delayed myelination, multifocal white matter changes, small pons, and vermis were elaborated for the main etiology subgroups.
Within the 18q disorders, MR imaging findings remain better characterized in the 18q- group, especially white matter abnormalities. In our cohort, white matter abnormality was consistent with a delayed myelination appearance with a prevalence of 74% (25 MRIs) in the 18q- cohort in keeping with the range of 50%–71% in the literature6,8,27,28 except for 95% in a single study where most of the cases had myelin basic protein haploinsufficiency.29 There is little consensus, however, on the dominant conventional MR imaging pattern in the literature with variable descriptions including a central deep white matter predominant pattern8 or a diffusely poor myelination pattern with a poor GWMD.28 Occasional cases with severe myelin deficit have also been described.8,27,28 Based on this knowledge that the myelination phenotype may be markedly different and may vary with age, we were able to divide the MR imaging studies into 3 recognizable phenotypes: PMD-like, intermediate, and washed-out patterns. This has diagnostic utility as imaging appearances in 18q abnormalities can be similar to PMD during the first year,30 corresponding to age range of the PMD-like phenotype (3–12 months). Consistent with some of the quantitative imaging studies using myelin water fraction and MR imaging relaxometry techniques,1,7,29 we found these patterns corresponded to improving myelination scores. The final myelination phenotype seemed to be the washed-out pattern after which there was no further decrease in myelination lag, consistent with the final equilibrium levels described with quantitative studies.1,7,29
There are anecdotal reports of MR imaging findings in ring chromosome 18 in the literature, and most descriptions in trisomy 18 remain restricted to autopsy reports.11,13⇓–15 We found a delayed myelination phenotype in all cases with ring chromosome 18 with the highest levels of myelination lag (P = .005, 0.03 versus trisomy 18, 18q- groups) and multifocal white matter abnormalities (P = .001). This is consistent with reports in the literature with more severe white matter findings in comparison to 18q-.13 Evidence from autopsy reports suggests that CNS changes in trisomy 18 are more commonly structural with a wide spectrum, most pertinently including hypoplasia of the pons and cerebellum (∼90%).31 To the best of our knowledge, while white matter changes in trisomy 18 have been described in a few cases on autopsy,32,33 these seem to remain poorly characterized on MR imaging. Similar to the prevalence described in the literature,31 a small pons and/or vermis was present in almost all trisomy 18 MRIs (9, 90%). Delayed myelination was seen in 50% (5) with only 1 MR imaging having an isolated delayed myelination without a small pons or vermis. Interestingly, none of the ring chromosome 18 cases had a small pons or vermis. In contrast to the ring chromosome 18 and trisomy 18 subgroups, 18q- had an isolated delayed myelination in 21 MRIs (62%); 5 MRIs (18%) with isolated small pons and/or vermis; and the other 10 MRIs (20%) with overlapping delayed myelination, small pons, and/or vermis. This presence of a mixture of structural and white matter changes of varying severity in 18q- is in keeping with the autopsy reports.34,35 It is tempting to speculate if the imaging findings in ring chromosome 18, 18q-, and trisomy 18 thus represent a continuum of structural and white matter changes. Future larger cohorts are needed to assess this further.
In some cases, we found regionally specific myelination delays. This included some cases with focal midsplenial T2 hyperintensity, which was only mildly T1 hypointense and we speculate this represents an appearance related to delayed midsplenial myelination. The splenium follows a centrolineal pattern of myelination and can have variable signals centrally from 3–6 months as a normal developmental phenomenon.36 A similar finding has also been described in 4H leukodystrophy, however, with a T1-hypointense cystlike appearance, assumed to represent tissue rarefaction.25 Closed-eye sign of medial lemniscus also described with 4H leukodystrophy,25 was noted in our cohort, more commonly with PMD-like pattern (P = .002), which also likely relates to delay in regional brainstem myelination. Some cases with the final MR imaging phenotype (washed-out pattern) demonstrated a greater T2 hyperintensity of the posterior limb of internal capsule and occipital lobe white matter than other regions and delayed T1 peripheral cerebellar arborization. Again, these may correspond to regionally specific delays in myelination persisting at advanced stages; however, it cannot be ruled out if a degree of gliosis with advancing age contributes to these signal changes.8,28,34
There are potential limitations in our study. There are drawbacks expected due to a retrospective study design including an inconsistent timing of MR imaging within the cohort. We could not address genotype correlations as data regarding the specific involved segment and/or gene haploinsufficiency were not available for many cases because of the retrospective nature of the study and would be desirable in future studies. Image acquisition parameters have been shown to influence myelination appearances, including magnet strength (1.5T versus 3T), type of sequences used (spin-echo versus gradient recalled–echo), type of spin-echo sequence used (conventional versus fast spin-echo), and internal parameters (echo-train length, TR, TE).37⇓–39 It was difficult to collect harmonized data as imaging protocols varied over the study period and also between the age groups studied.
CONCLUSIONS
We systematically analyzed CNS imaging findings in a cohort of 18q abnormalities and found distinct MR imaging patterns corresponding to improving brain myelination. There were differences in MR imaging findings across the 18q subgroups, with more severe white matter abnormalities in ring chromosome 18 and greater prevalence of structural abnormalities including small pons and vermis dimensions in trisomy 18. The findings in the cohort could represent an imaging continuum, and larger studies are needed to validate this.
Footnotes
Susan Blaser and Pradeep Krishnan are co-senior authors.
Disclosure forms provided by the authors are available with the full text and PDF of this article at www.ajnr.org.
References
- Received February 18, 2024.
- Accepted after revision May 22, 2024.
- © 2024 by American Journal of Neuroradiology


Jump to section
Related Articles
Cited By...
- No citing articles found.