
Abstract
BACKGROUND AND PURPOSE: Acute inflammatory activity of MS lesions is traditionally assessed through contrast-enhanced T1-weighted MR images. The aim of our study was to determine whether a qualitative evaluation of non-contrast-enhanced SWI of new T2-hyperintense lesions might help distinguish acute and chronic lesions and whether it could be considered a possible alternative to gadolinium-based contrast agents for this purpose.
MATERIALS AND METHODS: Serial MR imaging studies from 55 patients with MS were reviewed to identify 169 new T2-hyperintense lesions. Two blinded neuroradiologists determined their signal pattern on SWI, considering 5 categories (hypointense rings, marked hypointensity, mild hypointensity, iso-/hyperintensity, indeterminate). Two different blinded neuroradiologists evaluated the presence or absence of enhancement in postcontrast T1-weighted images of the lesions. The Fisher exact test was used to determine whether each category of signal intensity on SWI was associated with gadolinium enhancement.
RESULTS: The presence of hypointense rings or marked hypointensity showed a strong association with the absence of gadolinium enhancement (P < .001), with a sensitivity of 93.0% and a specificity of 82.9%. The presence of mild hypointensity or isohyperintensity showed a strong association with the presence of gadolinium enhancement (P < .001), with a sensitivity of 68.3% and a specificity of 99.2%.
CONCLUSIONS: A qualitative analysis of the signal pattern on SWI of new T2-hyperintense MS lesions allows determining the likelihood that the lesions will enhance after administration of a gadolinium contrast agent, with high specificity albeit with a moderate sensitivity. While it cannot substitute for the use of contrast agent, it can be useful in some clinical settings in which the contrast agent cannot be administered.
MS is a progressive inflammatory, demyelinating, and neurodegenerative autoimmune disease of the CNS. Its inflammatory process is thought to be caused and propagated by an autoimmune cascade, which involves T-cells and mechanisms of molecular mimicry, leading to the development of focal perivascular infiltrates of mononuclear inflammatory cells, microglia activation, demyelination, and axonal degeneration. Gadolinium-enhancement on MR imaging can reveal the presence of blood-brain barrier disruption due to acute inflammation, and it is considered an acute sign of focal inflammatory activity. There is evidence that the magnetic susceptibility of MS lesions tends to increase considerably as they evolve from an enhancing to nonenhancing stage after gadolinium administration, a finding proved using quantitative MR imaging methods.1⇓⇓⇓⇓⇓⇓-8 This feature has been mainly related to iron accumulation inside macrophages and activated microglia at the outer margins of MS lesions.1,2,9 Due to the paramagnetic characteristics of iron, SWI is an MR imaging technique that permits in vivo measurement of iron levels in tissues. The aim of our study was to determine whether a visual, qualitative evaluation of SWI of new T2-hyperintense MS lesions could be useful to differentiate acute and chronic lesions and whether it could be considered a possible alternative to gadolinium-based contrast agents for this purpose.
MATERIALS AND METHODS
We retrospectively reviewed the medical records and MR images from a group of patients with MS to detect those who had developed new T2-hyperintense lesions on a follow-up MR imaging.
The study was approved by the hospital research and ethics committee and informed consent was obtained from each participant for the use of their anonymized MR imaging studies for research purposes.
Patients
A search was performed in a prospectively collected data base of 1312 patients with MS at our center. All the patients had been diagnosed with MS on the basis of the 2010 revision of the McDonald criteria10 and were regularly followed up at our institution (Vall d’Hebron University Hospital, Barcelona, Spain). Medical records and MR imaging studies acquired between January 2011 and December 2018 were retrospectively reviewed to identify patients who had developed new T2-hyperintense lesions. Inclusion criteria were the following: 1) 18–65 years of age; 2) relapsing course of MS; 3) MR imaging studies performed on a 3T MR imaging scanner using a standardized imaging protocol; 4) available MR imaging follow-up scans performed with the same scanner and protocol between 3 and 18 months from the baseline MR imaging; and 5) the presence of new T2-hyperintense brain lesions with a diameter of ≥3 mm on the follow-up MR imaging. Exclusion criteria were the following: 1) lack of a standardized MR imaging protocol or examinations performed on a 1.5T scanner; 2) absence of new T2-hyperintense WM lesions; 3) clinical conditions that could lead to WM lesions (such as atherosclerosis, diabetic microangiopathy, migraine or traumatic brain injury); and 4) pregnancy and steroid therapy within the 30 days before the follow-up MR imaging.
After meeting the above criteria, a total of 55 patients (37 women, 18 men) were included in our study, with a mean age at the follow-up MR imaging of 34.3 years (range, 20.0–48.4 years), a mean disease duration of 2.3 years (range, 0.8–26.7 years), and a mean Expanded Disability Status Scale score of 1.3 (range, 0–3.5). The mean interval between the baseline and the follow-up MR imaging was 9.3 months (range, 4.8–15.6 months).
MR Imaging Protocol
All MR imaging examinations were performed on a 3T system (Magnetom Trio, A Tim System; Siemens), with a 16-channel radiofrequency head coil using the same imaging protocol. T2- and proton density–weighted images were obtained using a 2D dual-echo fast spin-echo sequence in the axial plane (TR = 2500 ms; TE = 16/91 ms; flip angle = 120°; echo-train length = 6; section thickness = 3 mm). To obtain SWI data, we acquired a fully flow-compensated 3D spoiled gradient recalled-echo sequence using the following parameters: TR = 32 ms; TE = 24.6 ms; flip angle = 15°. Magnitude and filtered-phase information was automatically processed and combined to obtain SWI, which had an in-plane resolution of 0.65 × 0.65 mm and a section thickness of 3.0 mm. Finally, a 2D T1-weighted gradient-echo sequence (TR = 297 ms; TE = 2.46 ms; flip angle = 66°; section thickness = 3 mm) was obtained after contrast administration, using a gadolinium-based hydrophilic and neutral macrocyclic contrast agent (gadobutrol, 0.1 mmol/kg, Gadovist; Bayer HealthCare Pharmaceuticals) with a 5- to 10-minute delay.
Image Analysis
Initial imaging analysis was performed on the dual-echo spin-echo sequence, blinded to the postcontrast images, to identify all new MS lesions by comparing baseline and follow-up MR imaging scans. All new T2-hyperintense lesions were visually identified by a neuroradiologist (L.M.P.), with 4 years’ experience. The lesions were manually marked on axial T2-weighted images and tagged with an identification number. Two sets of DICOM images were anonymized and stored in a dedicated local hard drive: the first one containing SWI data and the second one containing postcontrast T1-weighted data. Also, T2-weighted data were included in each set for a location reference of each lesion.
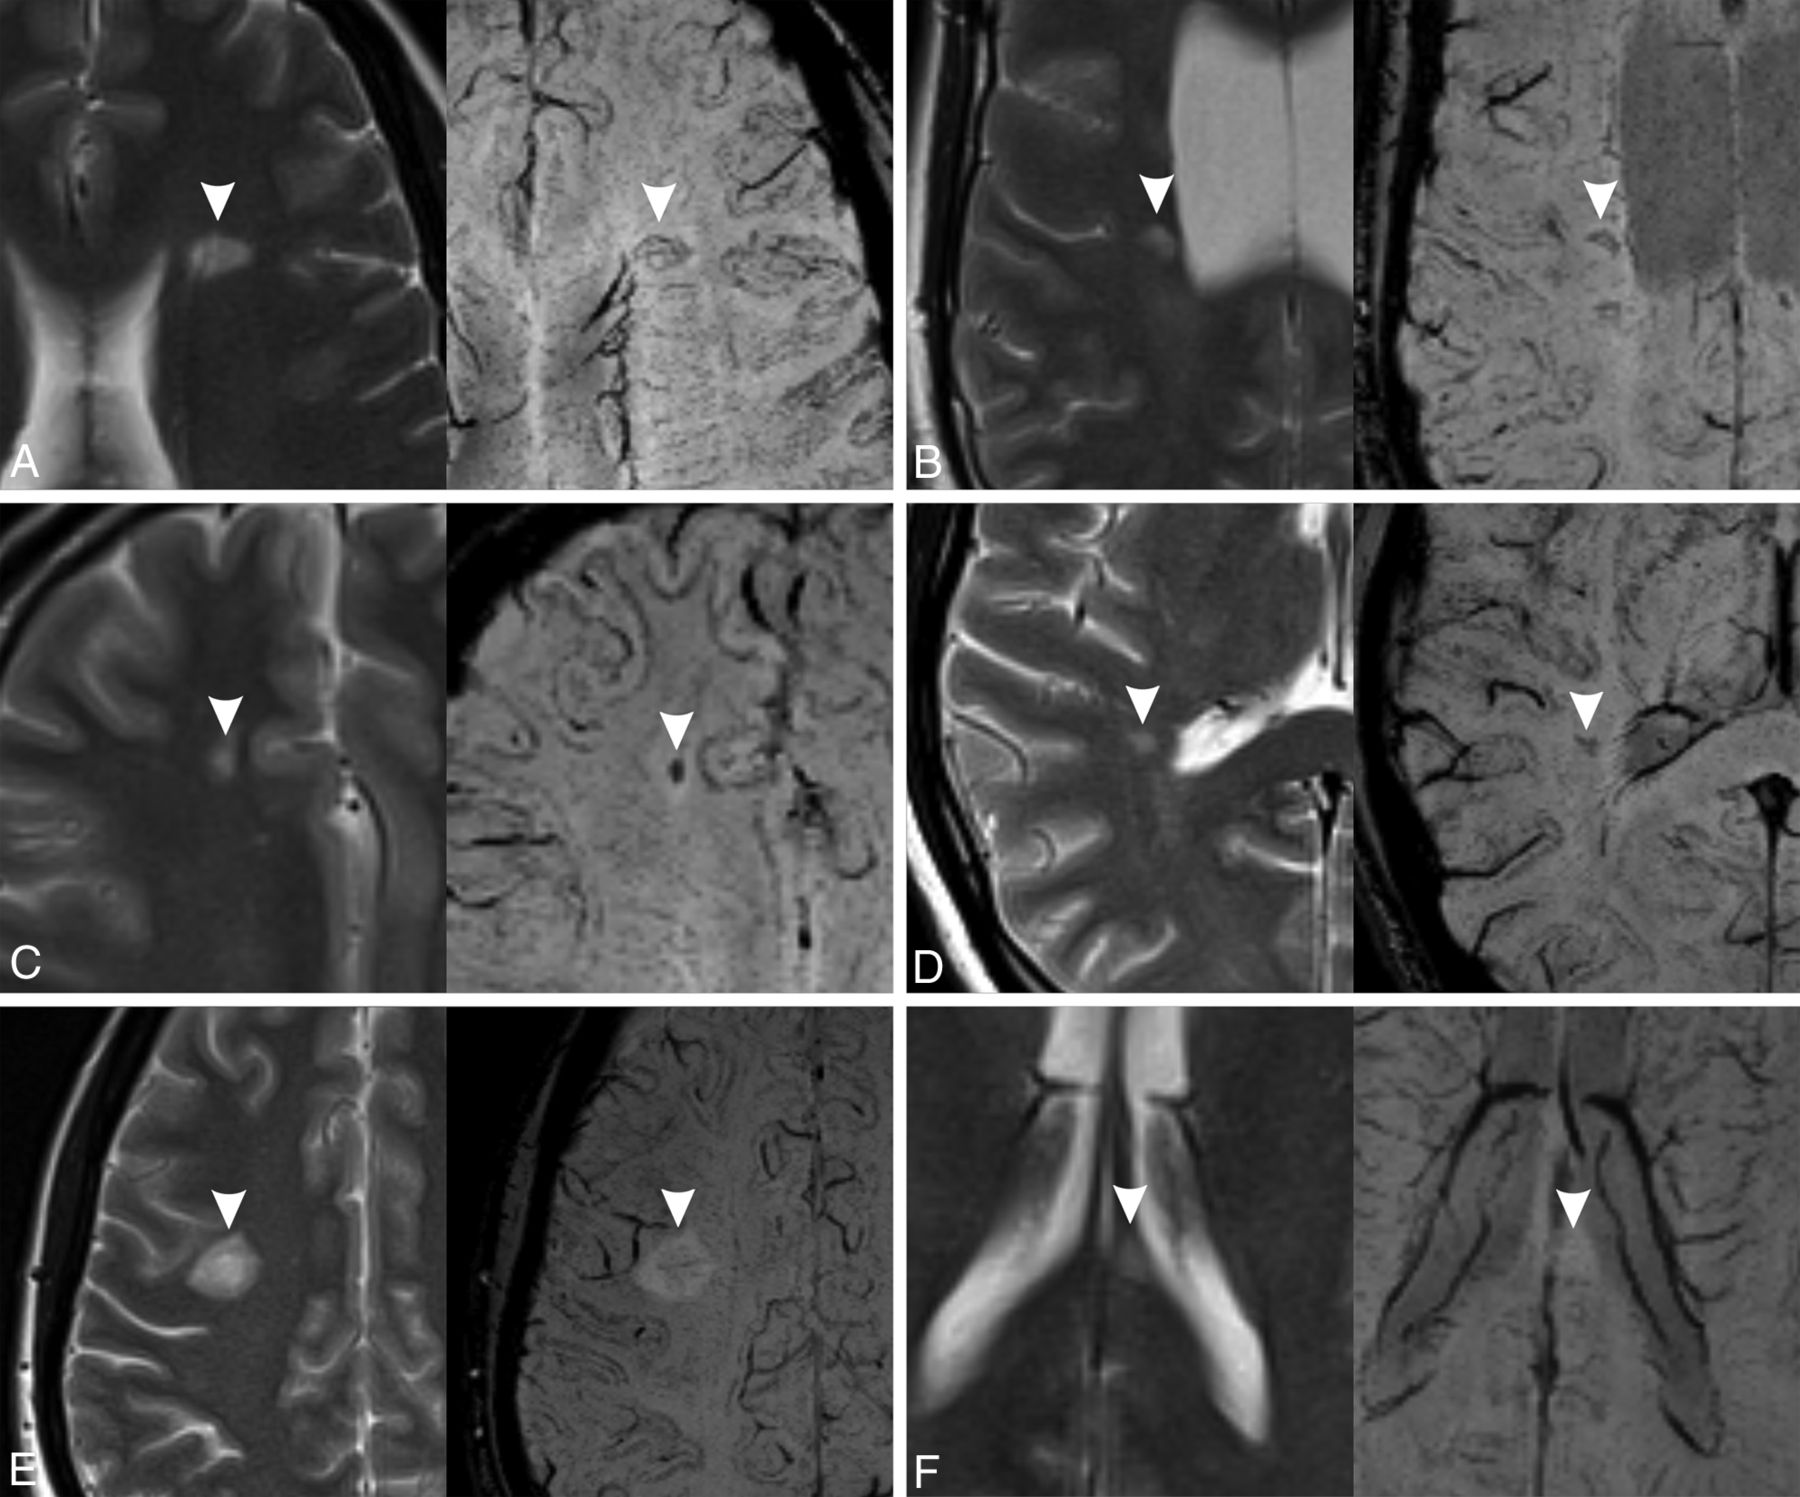
The SWI data set was reviewed independently and in a blinded manner by 2 neuroradiologists (G.C. and W.C., with 2 years’ experience) for a qualitative analysis of the signal intensity on SWI within each lesion. We considered 5 categories: 1) hypointense rings, 2) marked hypointensity, 3) mild hypointensity, 4) iso-/hyperintensity, and 5) indeterminate. The choice of these categories was based both on our experience and on a revision of the literature.11⇓⇓⇓-15 Lesions with hypointense rings were defined as those with a complete or partial circumferential peripheral hypointensity (Fig 1A, -B). Marked hypointensity included any lesions with well-defined intralesional hypointensity, irregular- or dot-shaped (Fig 1C, -D). Lesions with a mild hypointensity were those with a slight low signal intensity affecting the whole lesion or its central part (Fig 1E). Iso-/hyperintense lesions were defined as those with an MR imaging signal equal to or higher than the surrounding WM (Fig 1F).

Signal categories on SWI (right) with the corresponding T2-weighted images (left). The lesions are marked with arrowheads. A, Hypointense ring (complete). B, Hypointense ring (partial). C, Marked hypointensity (dot-shaped). D, Marked hypointensity (irregularly shaped). E, Mild hypointensity. F, Iso-/hyperintensity. In A, B, and E, the central vein sign is also visible.
Lesions could be classified both in “hypointense ring” and “marked hypointensity” categories, because these features could coexist in the same lesions, while the other 3 categories were mutually exclusive.
During lesion classification, special caution was adopted not to confuse the presence of a central vein sign (central thin dots or lines) with one of the categories considered. When the assessment varied between the 2 readers, consensus was reached with the help of a senior neuroradiologist (A.R., with > 30 years’ experience). Lesions that did not meet any of the previous criteria were classified as “indeterminate.”
Two different neuroradiologists (A.B. and A.S., with >5 years’ experience) analyzed the postcontrast T1-weighted data set in consensus, to determine the presence of contrast enhancement in each new lesion. New T2-hyperintense lesions were considered acute or chronic according to the presence or absence of enhancement on T1-weighted postcontrast MR images.
Statistical Analysis
The results were exported into SPSS Statistics for Windows, Version 23.0 (IBM) for statistical analysis.
The Fisher exact test was used to determine whether each category of SWI signal intensity was associated with gadolinium enhancement. P < .05 was considered indicative of a significant association. Sensitivity, specificity, and positive and negative predictive values were calculated for each category. The aforementioned parameters were also calculated dividing SWI signal intensity categories in 2 groups: those associated with the absence of gadolinium enhancement (hypointense rings and marked hypointensity) and those associated with the presence of gadolinium enhancement (mild hypointensity and iso-/hyperintensity). The Cohen κ statistic was used to measure the interobserver agreement for the qualitative SWI signal analysis.
RESULTS
In our cohort of 55 patients, a total of 169 new T2-hyperintense lesions with diameters of ≥3 mm were detected after comparing the baseline and follow-up examinations. All these lesions had the typical demyelinating lesion characteristics, round or ovoid with high signal on T2-weighted images.
Forty-one (24.3%) of these new lesions showed enhancement (acute lesion group), and 128 (75.7%) showed no enhancement (chronic lesion group) on postgadolinium T1-weighted images.
Regarding SWI signal categories, 88 lesions showed marked hypointensity, 52 lesions showed hypointense rings, 11 lesions showed mild hypointensity, 18 lesions showed iso-/hyperintensity, and 14 lesions were classified as indeterminate, as detailed in Table 1.
Distribution of SWI signal characteristics in new MS lesions
Table 2 shows the sensitivity, specificity, and positive and negative predictive values of each SWI signal category according to the presence or the absence of gadolinium enhancement, as well as Fisher exact test P values. The table also shows the statistical analysis regarding the group of SWI categories associated with the absence of gadolinium enhancement (hypointense rings and marked hypointensity) and with the presence of gadolinium enhancement (mild hypointensity and iso-/hyperintensity).
Association of each SWI signal category with the presence or absence of gadolinium enhancementa
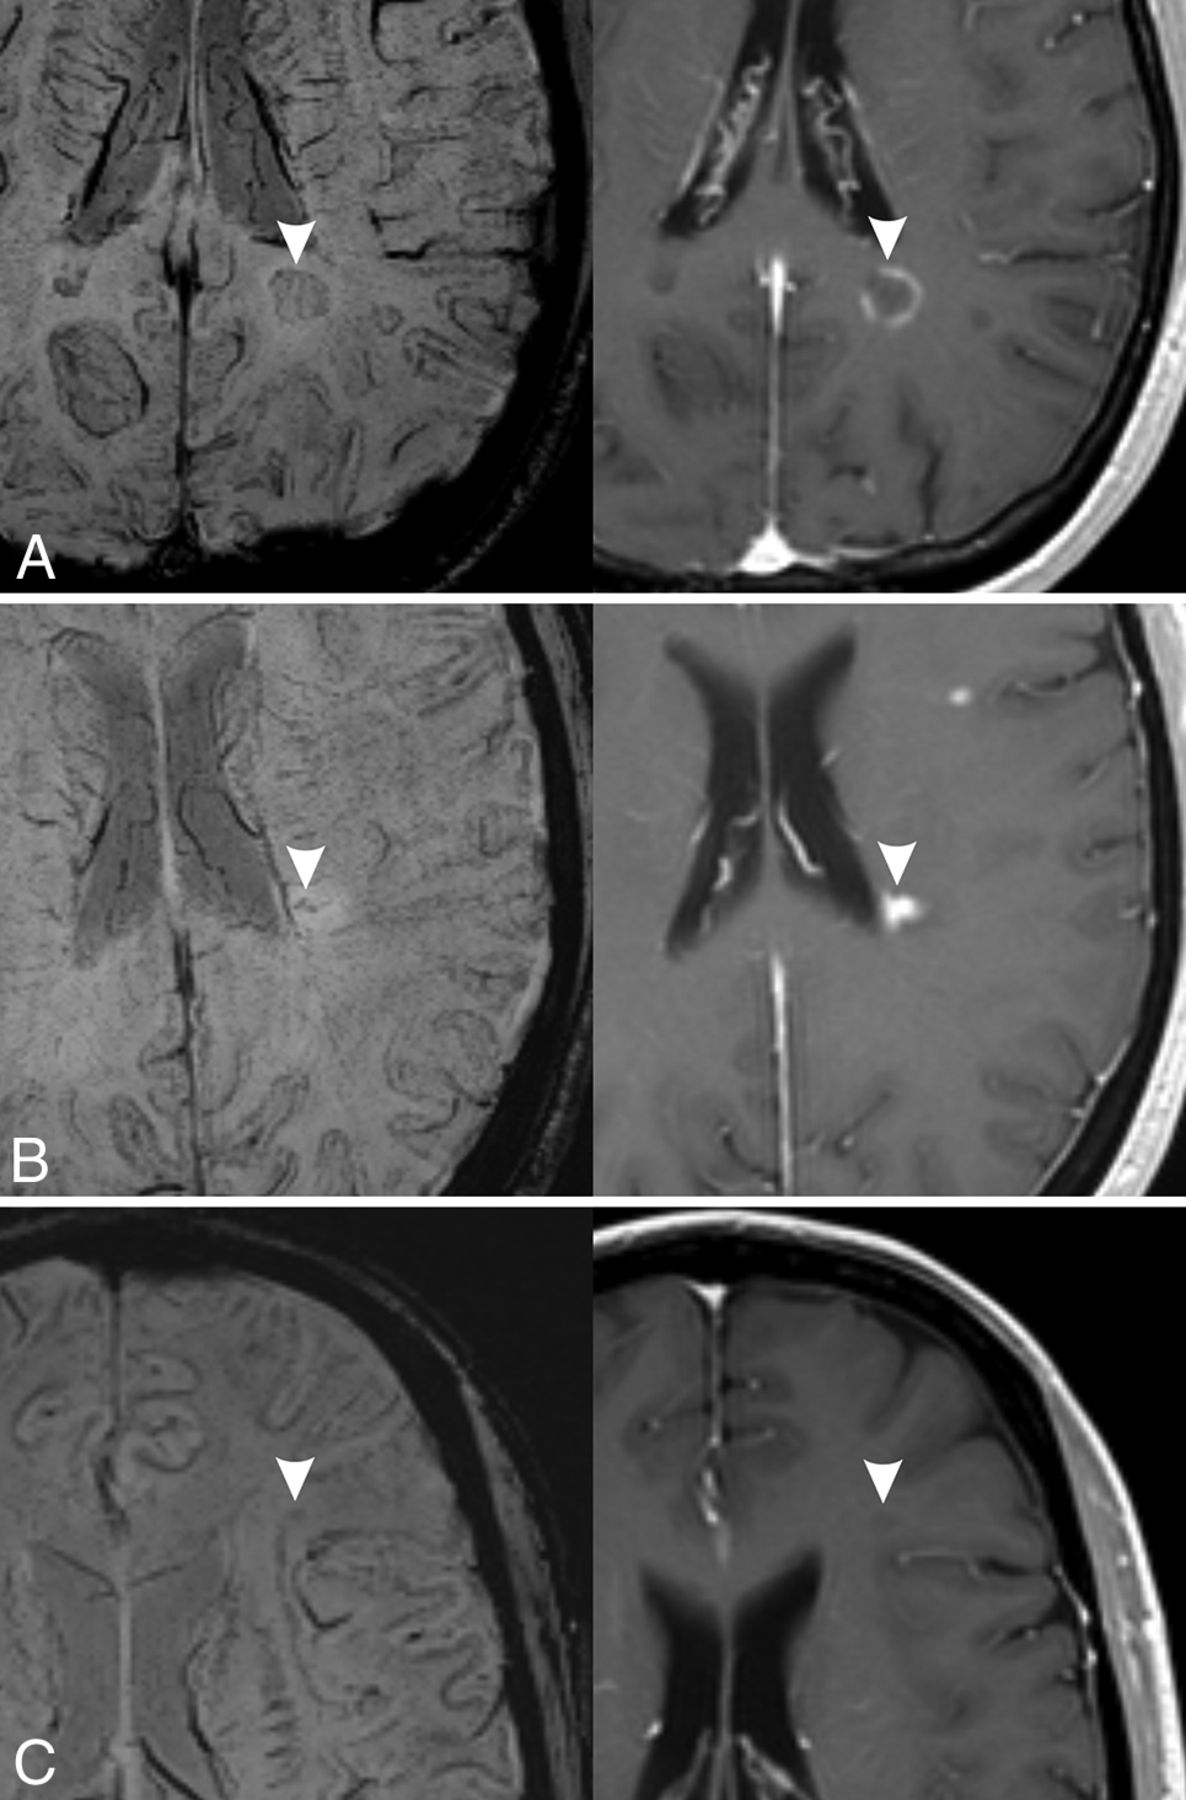
The presence of hypointense rings or marked hypointensity is strongly associated with the absence of gadolinium enhancement (P < .001, Fig 2A, -B), showing a sensitivity of 93.0% and a specificity of 82.9%. The presence of mild hypointensity or iso-/hyperintensity is strongly associated with the presence of gadolinium enhancement (P < .001, Fig 2C, -D), showing a sensitivity of 68.3% and a specificity of 99.2%. The indeterminate category did not show any statistically significant association with gadolinium enhancement (P = .11).

Examples of MS lesions (arrowheads) with different signal patterns on SWI (left) and corresponding contrast-enhanced T1-weighted images (right). A, Hypointense ring. B, Marked hypointensity (dot-shaped). C, Mild hypointensity. D, Iso-/hyperintensity. Lesions in A and B do not show enhancement on postcontrast images, while lesions on C and D show enhancement on postcontrast images.
The interobserver agreement was substantial, with Cohen κ values ranging from 0.68 to 0.77 for each single category (P < .001). Considering only 2 groups of categories, those associated with gadolinium enhancement and those not associated with it, the agreement was slightly better (Cohen κ = 0.78).
DISCUSSION
Our study showed the existence of an association between the presence of specific signal patterns in SWI and the presence/absence of enhancement on T1-weighted postcontrast images in new T2-hyperintense MS lesions. In particular, the finding of mild hypointensity or iso-/hyperintensity was associated with the presence of gadolinium enhancement, while the observation of hypointense rings and/or marked hypointensity at any site of lesions was associated with the absence of gadolinium enhancement.
SWI hypointensities in MS lesions are considered mainly due to iron deposition within inflammatory cells and in a minor grade to demyelination.1,2,9 Acute MS lesions initially show enhancement on postcontrast images because of the increased permeability of the blood-brain barrier that lasts for an average period of 3 weeks.16 In this phase, the initial myelin degradation and uptake by macrophages do not lead to significant demyelination or iron accumulation, making lesions isointense or slightly hypointense on SWI.3 A hyperintense signal in some of the acute lesions could be due to a T2-shinethrough effect.
It has been observed using quantitative methods that the susceptibility of MS lesions increases from values similar to those of normal-appearing WM in the acute, enhanced stage to significantly higher values than those of normal-appearing WM in the early-to-intermediate, nonenhanced stage (0.5–3 years) and then back to values similar to those of normal-appearing WM in the chronic nonenhanced stage (3–6 years).1⇓⇓⇓⇓⇓-7 A different increase of patterns of susceptibility can be visualized on SWI, mainly in the form of a core hypointensity or of a peripheral ringlike hypointensity. The pathophysiologic correlate of these imaging findings is not fully understood. It has been hypothesized that the hypointense core is either the consequence of a loss of diamagnetic myelin because of severe demyelination or that it is secondary to paramagnetic iron deposits.11,15,17 Regarding peripheral hypointensity, several studies have demonstrated the existence of a subset of chronic demyelinating lesions, slowly expanding lesions, smoldering lesions, or chronic active lesions, present mainly in patients with longstanding MS.12,17,18 These lesions often show a hypointense ring on SWI, related to the accumulation of iron-enriched microglia, which could have a role in maintaining an ongoing inflammation, even in the absence of gadolinium enhancement because the blood-brain barrier has been repaired at this stage.11,12,14,17,19⇓⇓-22 This finding could explain the presence of hypointense rings in several new nonenhancing MS lesions in our study (30.8%).
Thirteen enhancing lesions did not have SWI pattern associated to acute lesions. Six of these lesions were classified as “indeterminate”; mainly their small size made performing a reliable visual evaluation difficult. Four lesions showed a hypointense ring (Fig 3A); this finding is not totally unexpected, considering that previous studies have demonstrated the presence of a paramagnetic rim on enhancing lesions.5,15,21,23,24 In particular, using a 7T system, Absinta et al21 described the presence of thin paramagnetic rings in some acute, enhancing lesions and the presence of thicker rings in chronic lesions. They postulated that the rings in acute lesions are not due to iron accumulation but rather to myelin debris-enriched macrophages. It is possible that in our study, using a lower magnetic field, some of these paramagnetic rings were identified in acute lesions and that they could not be distinguished from the thicker rings of chronic lesions in a visual evaluation. Zhang et al5 found a paramagnetic rim in a high percentage of enhancing lesions (50%), in contrast to a smaller percentage in our study (9.8%), but they used quantitative susceptibility mapping, a more sensitive technique that is usually not included in routine MR imaging protocols. However, Blindenbacher et al15 found a percentage of SWI hypointense rings in enhancing lesions, in line with our study findings (15%). Finally, 3 enhancing lesions showed a marked central hypointensity (Fig 3B). A possible explanation is that the central hypointensity was due to a prominent central vein, which, in some cases, is difficult to recognize and be differentiated from other types of hypointensity. Blindenbacher et al also found that 30% of enhancing lesions had a hypointense core on SWI images. This finding is in line with our results if we consider the frequency of both marked and mild hypointensity in enhancing lesions (7.3% + 24.4% = 31.7%).

Exceptions to the associations found in our study. Three different MS lesions (arrowheads) are shown (left, SWI; right, contrast-enhanced T1-weighted image). A, Hypointense ring pattern on SWI with enhancement in postcontrast image. B, Marked hypointensity pattern on SWI (irregular dots) with enhancement in postcontrast image. C, Mild hypointensity pattern on SWI without enhancement on postcontrast T1-weighted image.
Most nonenhancing new lesions (93%), with an age that could range from 4.8 to 15.6 months, showed hypointense rings and/or the presence of a marked hypointensity on SWI. This finding is in agreement with the results of previous studies1,5 that observed a susceptibility increase in lesions with early-intermediate age (6–36 months). Eight nonenhancing lesions (6.3%) were not classifiable (indeterminate) on SWI, and 1 was classified as having a mild hypointensity (Fig 3C), a finding that could be due to the difficulty of precisely differentiating marked and mild hypointensity in a visual evaluation.
As previously mentioned, a mild hypointensity and/or an iso-/hyperintensity on SWI was significantly associated with the presence of gadolinium enhancement. Unfortunately, the relatively low sensitivity of this sign (68.3%) does not allow proposing the use of a qualitative evaluation of SWI as a substitute for gadolinium enhancement to assess the stage of a new MS lesion. Nevertheless, the very high specificity (99.2%) of the sign allows some clinical applications, such as in patients refusing to receive gadolinium-based contrast agents or when its administration is contraindicated (eg, severe renal insufficiency, pregnant women). In these patients, a new T2-hyperintense lesion that shows the aforementioned sign could be reliably considered acute without the need to proceed to contrast agent administration.
Our study has some limitations. First, we included only new T2-hyperintense lesions in our analysis; therefore, we did not evaluate SWI signal changes in pre-existing lesions, even if some of them were still showing gadolinium enhancement. We chose this approach because the visual evaluation of the SWI characteristics of all existing lesions would be very time-consuming and not applicable in a clinical setting. Second, all patients were imaged using a 3T scanner; therefore, the results may be not generalizable to 1.5T scanners, which are still frequently used for monitoring patients with MS. Third, our population was relatively small due to our strict selection criteria, including only patients with MR imaging studies performed on a 3T scanner using a standardized protocol. Moreover, almost all patients were undergoing a disease-modifying treatment; therefore, it was relatively uncommon to find new, T2-hyperintense lesions of ≥3 mm on follow-up studies and even more difficult to find enhancing lesions. Finally, we did not perform a quantitative evaluation, which is considered more objective than a visual evaluation because the aim of our study was to test a practical method applicable in daily practice. Nevertheless, the interobserver agreement was fairly good, and we believe it was sufficient to allow a nonquantitative assessment to be used.
CONCLUSIONS
On the basis of the results of our study, we suggest that the qualitative analysis of the SWI signal of new T2-hyperintense MS lesions in a follow-up MR imaging scan allows determining the likelihood that the lesions will enhance after gadolinium-based contrast agent administration. In particular, lesions with an iso- or hyperintense signal on SWI, as well as lesions with a mild hypointense signal, are more likely to enhance after gadolinium administration. While these features are not sensitive enough to replace the use of gadolinium-based contrast agents, their high specificity can be useful to recognize the acute state of new T2-hyperintense lesions in patients who refuse gadolinium-based contrast agents or when its administration is contraindicated. On the other hand, lesions showing hypointense rings or a marked hypointensity on SWI are more likely to have no enhancement, with a good sensitivity and a fair specificity.
Footnotes
Disclosure forms provided by the authors are available with the full text and PDF of this article at www.ajnr.org.
References
- Received September 17, 2021.
- Accepted after revision February 4, 2022.
- © 2022 by American Journal of Neuroradiology


Jump to section
Related Articles
Cited By...
- No citing articles found.