Advertisement

Main menu

  • Home
  • Content
    • Current Issue
    • Accepted Manuscripts
    • Article Preview
    • Past Issue Archive
    • Video Articles
    • AJNR Case Collection
    • Case of the Week Archive
    • Case of the Month Archive
    • Classic Case Archive
  • Special Collections
    • AJNR Awards
    • Low-Field MRI
    • Alzheimer Disease
    • ASNR Foundation Special Collection
    • Photon-Counting CT
    • View All
  • Multimedia
    • AJNR Podcasts
    • AJNR SCANtastic
    • Trainee Corner
    • MRI Safety Corner
    • Imaging Protocols
  • For Authors
    • Submit a Manuscript
    • Submit a Video Article
    • Submit an eLetter to the Editor/Response
    • Manuscript Submission Guidelines
    • Statistical Tips
    • Fast Publishing of Accepted Manuscripts
    • Graphical Abstract Preparation
    • Imaging Protocol Submission
    • Author Policies
  • About Us
    • About AJNR
    • Editorial Board
    • Editorial Board Alumni
  • More
    • Become a Reviewer/Academy of Reviewers
    • Subscribers
    • Permissions
    • Alerts
    • Feedback
    • Advertisers
    • ASNR Home

User menu

  • Alerts
  • Log in

Search

  • Advanced search
American Journal of Neuroradiology

American Journal of Neuroradiology

ASHNR American Society of Functional Neuroradiology ASHNR American Society of Pediatric Neuroradiology ASSR
  • Alerts
  • Log in

Advanced Search

  • Home
  • Content
    • Current Issue
    • Accepted Manuscripts
    • Article Preview
    • Past Issue Archive
    • Video Articles
    • AJNR Case Collection
    • Case of the Week Archive
    • Case of the Month Archive
    • Classic Case Archive
  • Special Collections
    • AJNR Awards
    • Low-Field MRI
    • Alzheimer Disease
    • ASNR Foundation Special Collection
    • Photon-Counting CT
    • View All
  • Multimedia
    • AJNR Podcasts
    • AJNR SCANtastic
    • Trainee Corner
    • MRI Safety Corner
    • Imaging Protocols
  • For Authors
    • Submit a Manuscript
    • Submit a Video Article
    • Submit an eLetter to the Editor/Response
    • Manuscript Submission Guidelines
    • Statistical Tips
    • Fast Publishing of Accepted Manuscripts
    • Graphical Abstract Preparation
    • Imaging Protocol Submission
    • Author Policies
  • About Us
    • About AJNR
    • Editorial Board
    • Editorial Board Alumni
  • More
    • Become a Reviewer/Academy of Reviewers
    • Subscribers
    • Permissions
    • Alerts
    • Feedback
    • Advertisers
    • ASNR Home
  • Follow AJNR on Twitter
  • Visit AJNR on Facebook
  • Follow AJNR on Instagram
  • Join AJNR on LinkedIn
  • RSS Feeds

AJNR Awards, New Junior Editors, and more. Read the latest AJNR updates

Research ArticleAdult Brain

Black Dipole or White Dipole: Using Susceptibility Phase Imaging to Differentiate Cerebral Microbleeds from Intracranial Calcifications

C.-L. Weng, Y. Jeng, Y.-T. Li, C.-J. Chen and D.Y.-T. Chen
American Journal of Neuroradiology August 2020, 41 (8) 1405-1413; DOI: https://doi.org/10.3174/ajnr.A6636
C.-L. Weng
aFrom the Department of Radiology (C.-L.W., Y.-T.L., C.-J.C., D.Y.-T.C.), Shuang Ho Hospital, Taipei Medical University, New Taipei City, Taiwan
  • Find this author on Google Scholar
  • Find this author on PubMed
  • Search for this author on this site
  • ORCID record for C.-L. Weng
Y. Jeng
bDepartment of Medical Imaging (Y.J.), National Taiwan University Hospital, Taipei, Taiwan
cDepartment of Medical Imaging (Y.J.), National Taiwan University Hospital Hsin-Chu Branch, Hsin Chu City, Taiwan
  • Find this author on Google Scholar
  • Find this author on PubMed
  • Search for this author on this site
  • ORCID record for Y. Jeng
Y.-T. Li
eSchool of Medicine, Translational Imaging Research Center (Y.-T.L.)
fCollege of Medicine, Neuroscience Research Center (Y.-T.L.), Taipei Medical University, Taipei, Taiwan.
  • Find this author on Google Scholar
  • Find this author on PubMed
  • Search for this author on this site
  • ORCID record for Y.-T. Li
C.-J. Chen
aFrom the Department of Radiology (C.-L.W., Y.-T.L., C.-J.C., D.Y.-T.C.), Shuang Ho Hospital, Taipei Medical University, New Taipei City, Taiwan
dDepartment of Radiology (C.-J.C., D.Y.-T.C.)
  • Find this author on Google Scholar
  • Find this author on PubMed
  • Search for this author on this site
  • ORCID record for C.-J. Chen
D.Y.-T. Chen
aFrom the Department of Radiology (C.-L.W., Y.-T.L., C.-J.C., D.Y.-T.C.), Shuang Ho Hospital, Taipei Medical University, New Taipei City, Taiwan
dDepartment of Radiology (C.-J.C., D.Y.-T.C.)
  • Find this author on Google Scholar
  • Find this author on PubMed
  • Search for this author on this site
  • ORCID record for D.Y.-T. Chen
  • Article
  • Figures & Data
  • Info & Metrics
  • Responses
  • References
  • PDF
Loading

Article Figures & Data

Figures

  • Tables
  • Fig 1.
    • Download figure
    • Open in new tab
    • Download powerpoint
    Fig 1.

    Microbleed or calcification? A, GRE magnitude image shows a dark spot in the left frontal white matter. B, GRE phase images of the corresponding lesion reveal various phase patterns from the cranial-to-caudal direction. These appear totally dark at the upper and lower border sections; however, a mixed dark and bright pattern is visible in the center section. The heterogeneous phase pattern hinders interpretation of whether the lesion is a microbleed or calcification.
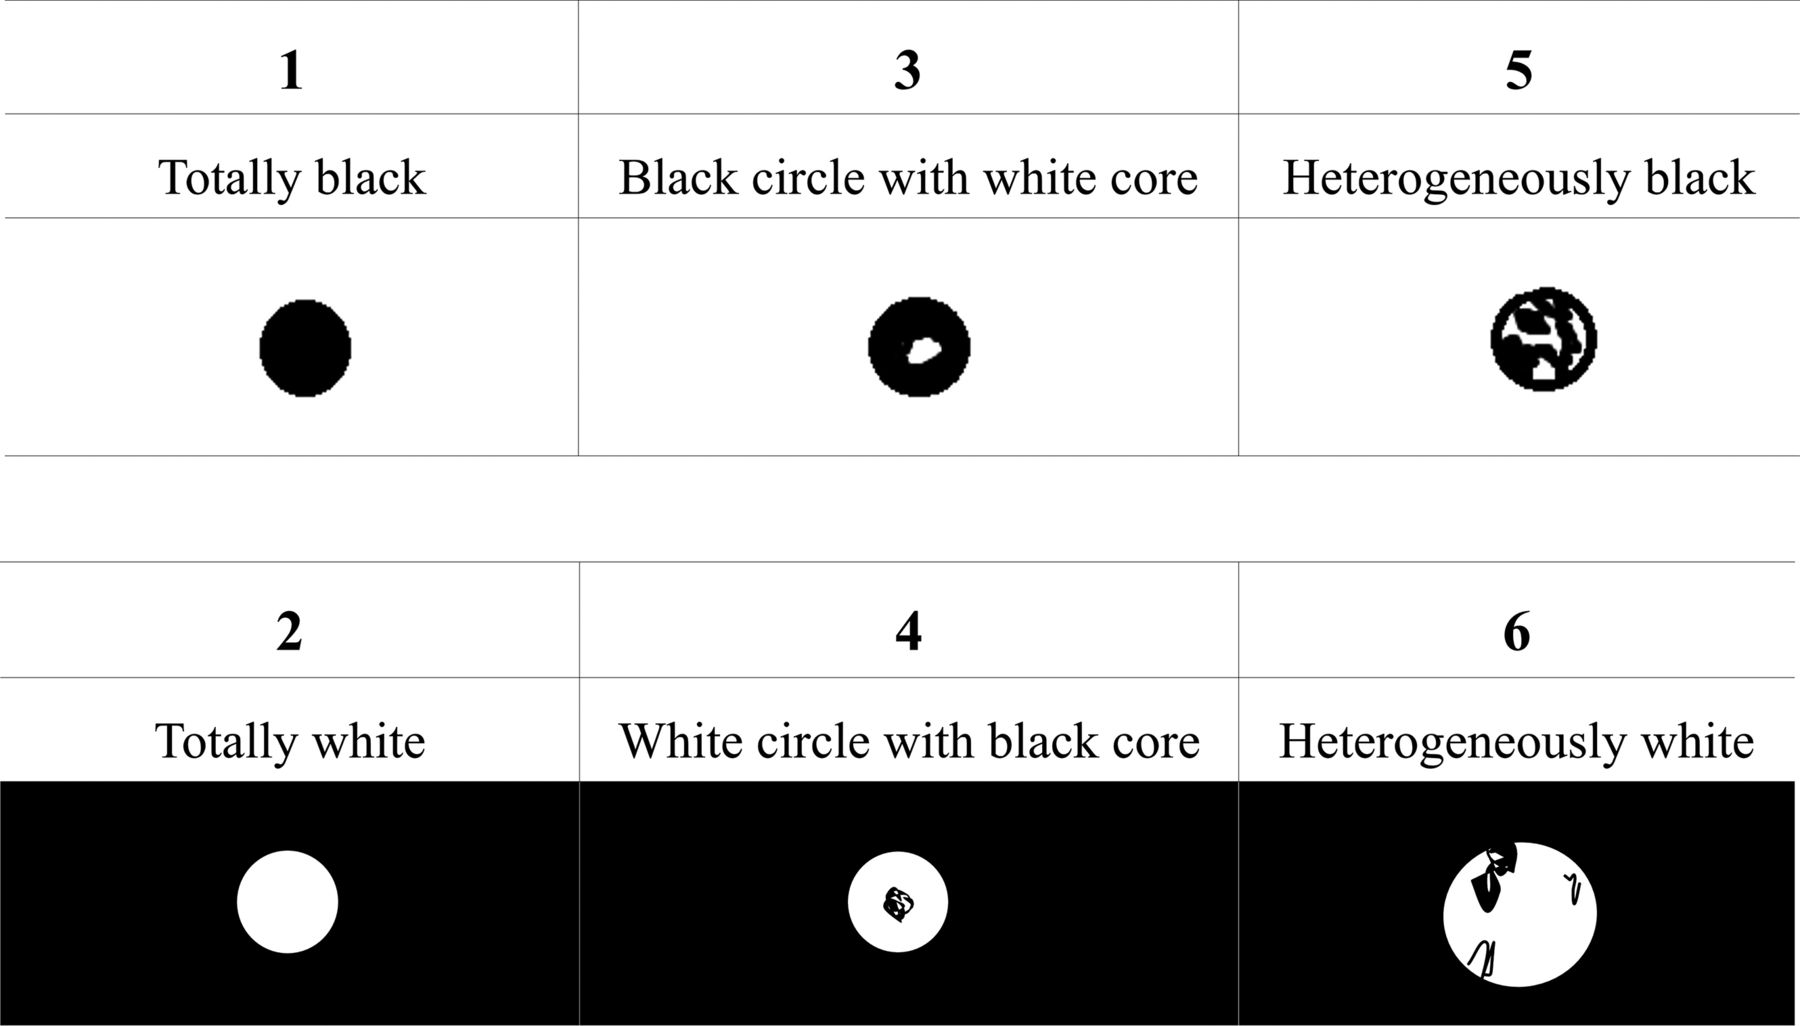
  • Fig 2.
    • Download figure
    • Open in new tab
    • Download powerpoint
    Fig 2.

    Axial phase patterns of GRE dark spots. The 6 axial phase patterns include the following: pattern 1, totally black; pattern 2, totally white; pattern 3, black circle with white core; pattern 4, white circle with black core; pattern 5, heterogeneously black; and pattern 6, heterogeneously white. Lesions with phase patterns 1, 3, and 5 were interpreted as paramagnetic microbleeds in which >50% of the area is dark. Lesions with phase patterns 2, 4, and 6 were interpreted as diamagnetic calcifications in which >50% of the area appeared bright.
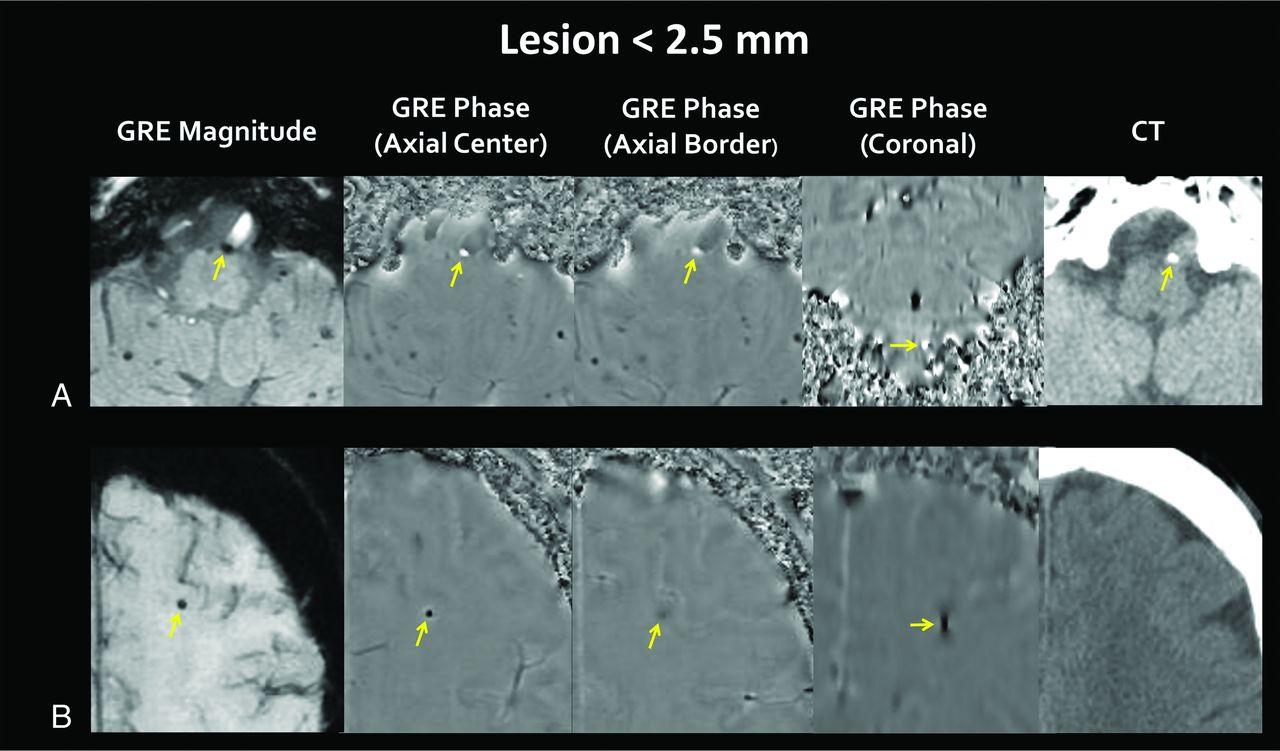
  • Fig 3.
    • Download figure
    • Open in new tab
    • Download powerpoint
    Fig 3.

    Phase patterns of calcifications and microbleeds <2.5 mm in diameter. A, A small dark spot (arrow) attached to the left distal vertebral artery is shown in the GRE magnitude image. It is totally white at the central with border slices in the axial phase image, which suggest a diamagnetic lesion. CT confirms this as arterial wall calcification. B, A small dark spot (arrow) located at the left frontal subcortical white matter in the GRE magnitude image. It is totally dark at the central with border slices of the axial phase image, which suggest a paramagnetic lesion. Coronal phase imaging reveals a black dipole with a pair of faint bright side wings. The bright side wings are the faint, peripheral, bright rim around the dark lesion in the axial central phase image. CT reveals no corresponding lesion and confirms it to be a microbleed.
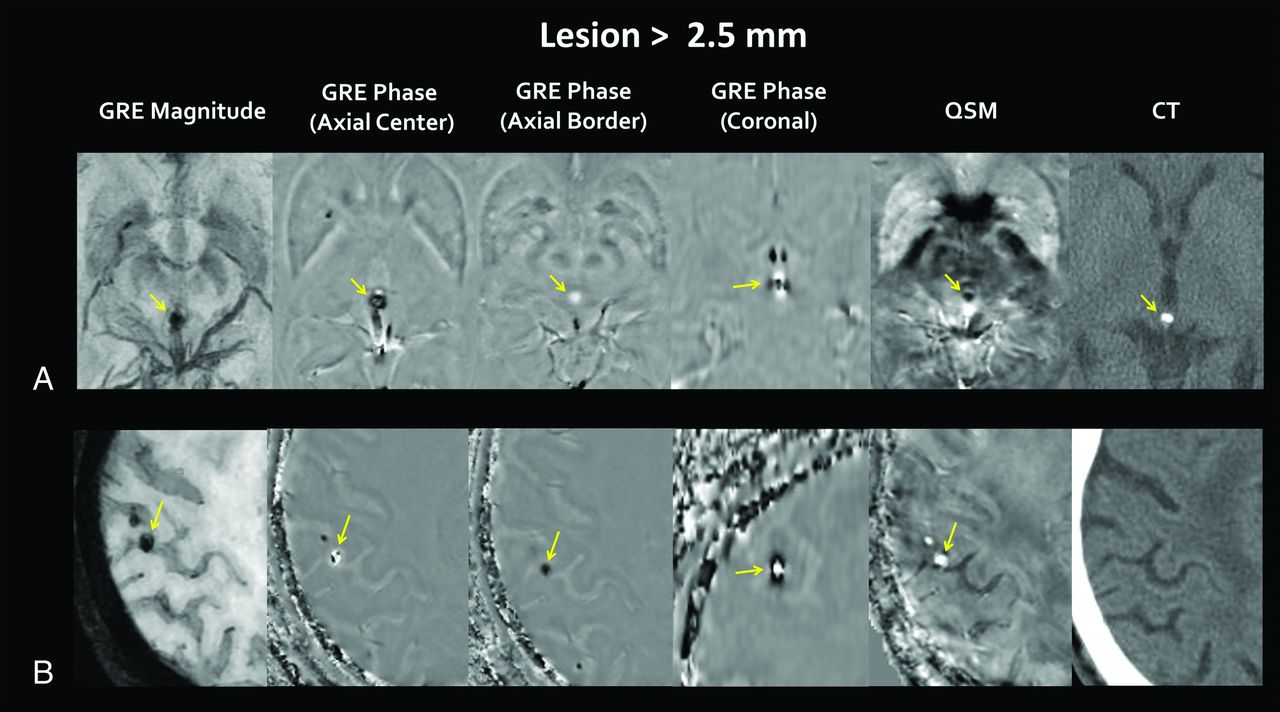
  • Fig 4.
    • Download figure
    • Open in new tab
    • Download powerpoint
    Fig 4.

    Phase patterns of calcifications and microbleeds of >2.5 mm in diameter. A, A dark nodule (arrow) in the pineal region is displayed in the GRE magnitude image. It is heterogeneously black in the axial central phase image, whereas it is totally white in the axial border phase image. The inconsistent finding of the axial phase pattern hinders differentiation between a calcification and microbleed. Coronal phase imaging displays a white dipole more clearly, with a black core and side wings (arrow). QSM indicates a dark spot (arrow) at the corresponding site, which indicates a diamagnetic lesion. CT confirms it to be a pineal calcification. B, A dark nodule (arrow) at the right temporal subcortical white matter is presented in the GRE magnitude image. It is heterogeneously white in the axial central phase image, whereas it is totally black in the axial border phase images. The inconsistent finding hinders differentiation between a calcification and microbleed. Coronal phase imaging reveals a black dipole with a white core and side wings (arrow), and QSM indicates a bright spot (arrow) at the corresponding site, which suggests a paramagnetic lesion. CT confirms this to be a microbleed.

  • Fig 5.
    • Download figure
    • Open in new tab
    • Download powerpoint
    Fig 5.

    Correlation between the diameter and susceptibility of lesions. A, A strong positive correlation is observed between the diameter and susceptibility of lesions in CMBs (r = 0.72, P < .001). B, A strong negative correlation is observed between the diameter and susceptibility of lesions in calcifications (r = −0.824, P = .003).
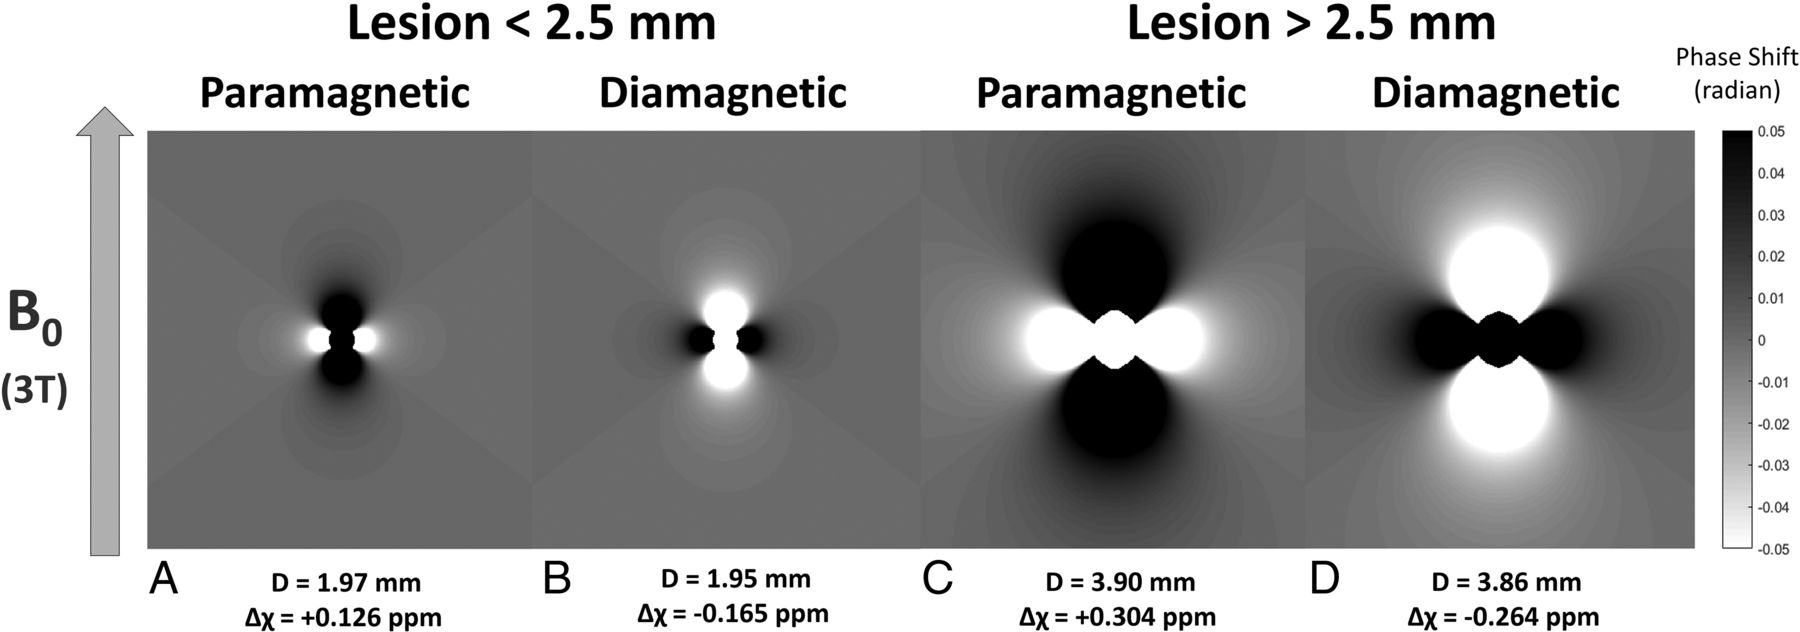
  • Fig 6.
    • Download figure
    • Open in new tab
    • Download powerpoint
    Fig 6.

    2D simulation of the local phase shift around lesions smaller and larger than 2.5 mm in diameter. The simulation was based on Equations 1 and 2. The phase shift is represented in the radians, and phase aliasing occurs when the phase shift exceeds +π or –π radians. The parameters are the same as those in our clinical setting: B0, 3T; TE, 25 ms; and gyromagnetic ratio, 42.58 × 10⁶ Hz/T. The relative susceptibility (Δχ) and diameter (D) of the lesion are the mean values of the lesions in each group in our study. In lesions <2.5 mm in diameter, the simulated phase image reveals a black dipole with white side wings in the paramagnetic lesion (A) and a white dipole with black side wings in the diamagnetic lesion (B). In lesions >2.5 mm in diameter, the relative susceptibility is higher and the diameter is larger, which causes a larger phase shift that exceeds the aliasing threshold within the lesion. This results in a black dipole with a white core from phase aliasing, the white side wings in the paramagnetic lesion (C), and a white dipole with a black core and black side wings in the diamagnetic lesion (D).
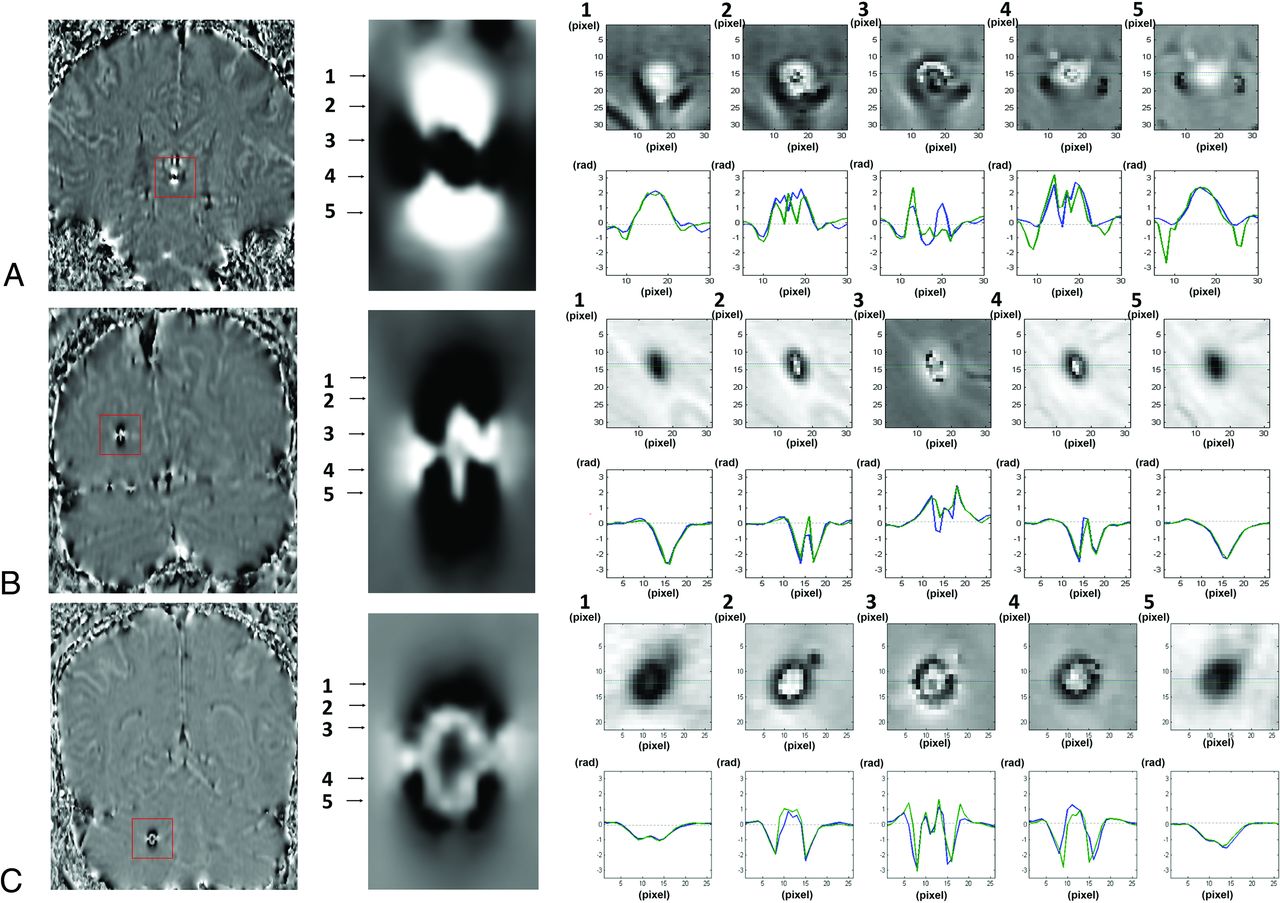
  • Fig 7.
    • Download figure
    • Open in new tab
    • Download powerpoint
    Fig 7.

    Serial changes in the axial phase pattern in paramagnetic and diamagnetic dipoles. A, A diamagnetic dipole, which represents a pineal calcification, is displayed in the coronal phase image (left) and magnified image (middle). The white dipole with a black core and side wings in the coronal phase image explains serial changes in the axial phase patterns (right upper images) in the corresponding 5 levels: 1, totally white; 2, white circle with black core; 3, heterogeneously black (epicenter); 4, white circle with black core; and 5, totally white (lower border). The phase shift diagram (right lower images) crossing the center of the lesion reveals that when the positive phase shift is large enough to exceed π radians, it aliases toward −π radians and appears to be partially dark in the phase images near the central slices (2, 3, and 4 of the right lower images). B, A paramagnetic black dipole, which represents a microbleed in the white matter of the right cerebral hemisphere, presents the opposite pattern in the coronal and axial phase images and phase shift diagrams. C, A paramagnetic black dipole larger than that in B shows an alternating “black in white” core in the coronal phase (middle) and axial phase images (2, 3, and 4 of the right upper images). The phase shift diagram indicates that when the negative phase shift is large enough to exceed −π radians, it aliases toward +π radians (2 and 4 of the right lower images), and if the phase shift exceeds +π radians after the first aliasing, it aliases backward by −π radians (3 of the right lower images), which causes the alternating black in white core pattern in the center of the black dipole.

Tables

  • Figures
    • View popup
    Table 1:

    Phase patterns of cerebral microbleeds and intracranial calcifications at the border and central slices

    Phase PatternMicrobleeds (n = 128)Calcifications (n = 62)
    All sizes<2.5 mm≥2.5 mmAll sizes<2.5 mm≥2.5 mm
    Border phase pattern
     1) Totally black1287454110
     2) Totally white000612536
     3) Black circle with white core000000
     4) White circle with black core000000
     5) Heterogeneously black000000
     6) Heterogeneously white000000
    Central phase pattern
     1) Totally black80737211
     2) Totally white00027252
     3) Black circle with white core10010000
     4) White circle with black core303909
     5) Heterogeneously black1711611011
     6) Heterogeneously white1801813013
    • View popup
    Table 2:

    Diagnostic accuracy of the border and central phase patterns and QSM for identifying calcification

    Lesion DiameterAll Lesions (n = 190)Lesions with QSM (n = 46)
    Border PhaseCentral PhaseP ValueBorder PhaseQSMP Value
    SEN (%)SPE (%)SEN (%)SPE (%)SENSPESEN (%)SPE (%)SEN (%)SPE (%)SENSPE
    All sizes (n = 190)98.410079.083.6.002<.00110010010010011
    <2.5 mm (n = 100)96.210096.21001110010010010011
    ≥2.5 mm (n = 90)10010066.761.1.002<.00110010010010011
    • Note:—SEN indicates sensitivity; SPE, specificity; QSM, quantitative susceptibility mapping.

PreviousNext
Back to top

In this issue

American Journal of Neuroradiology: 41 (8)
American Journal of Neuroradiology
Vol. 41, Issue 8
1 Aug 2020
  • Table of Contents
  • Index by author
  • Complete Issue (PDF)
Advertisement
Print
Download PDF
Email Article

Thank you for your interest in spreading the word on American Journal of Neuroradiology.

NOTE: We only request your email address so that the person you are recommending the page to knows that you wanted them to see it, and that it is not junk mail. We do not capture any email address.

Enter multiple addresses on separate lines or separate them with commas.
Black Dipole or White Dipole: Using Susceptibility Phase Imaging to Differentiate Cerebral Microbleeds from Intracranial Calcifications
(Your Name) has sent you a message from American Journal of Neuroradiology
(Your Name) thought you would like to see the American Journal of Neuroradiology web site.
CAPTCHA
This question is for testing whether or not you are a human visitor and to prevent automated spam submissions.
Cite this article
C.-L. Weng, Y. Jeng, Y.-T. Li, C.-J. Chen, D.Y.-T. Chen
Black Dipole or White Dipole: Using Susceptibility Phase Imaging to Differentiate Cerebral Microbleeds from Intracranial Calcifications
American Journal of Neuroradiology Aug 2020, 41 (8) 1405-1413; DOI: 10.3174/ajnr.A6636

Citation Manager Formats

  • BibTeX
  • Bookends
  • EasyBib
  • EndNote (tagged)
  • EndNote 8 (xml)
  • Medlars
  • Mendeley
  • Papers
  • RefWorks Tagged
  • Ref Manager
  • RIS
  • Zotero
0 Responses
Respond to this article
Share
Bookmark this article
Black Dipole or White Dipole: Using Susceptibility Phase Imaging to Differentiate Cerebral Microbleeds from Intracranial Calcifications
C.-L. Weng, Y. Jeng, Y.-T. Li, C.-J. Chen, D.Y.-T. Chen
American Journal of Neuroradiology Aug 2020, 41 (8) 1405-1413; DOI: 10.3174/ajnr.A6636
del.icio.us logo Twitter logo Facebook logo Mendeley logo
  • Tweet Widget
  • Facebook Like
  • Google Plus One
Purchase

Jump to section

  • Article
    • Abstract
    • ABBREVIATIONS:
    • MATERIALS AND METHODS
    • RESULTS
    • DISCUSSION
    • CONCLUSIONS
    • Acknowledgments
    • References
  • Figures & Data
  • Info & Metrics
  • Responses
  • References
  • PDF

Related Articles

  • No related articles found.
  • PubMed
  • Google Scholar

Cited By...

  • No citing articles found.
  • Crossref
  • Google Scholar

This article has not yet been cited by articles in journals that are participating in Crossref Cited-by Linking.

More in this TOC Section

Adult Brain

  • Diagnostic Neuroradiology of Monoclonal Antibodies
  • Clinical Outcomes After Chiari I Decompression
  • Segmentation of Brain Metastases with BLAST
Show more Adult Brain

Functional

  • Kurtosis and Epileptogenic Tubers: A Pilot Study
  • Glutaric Aciduria Type 1: DK vs. Conventional MRI
  • Multiparametric MRI in PEDS Pontine Glioma
Show more Functional

Similar Articles

Advertisement

Indexed Content

  • Current Issue
  • Accepted Manuscripts
  • Article Preview
  • Past Issues
  • Editorials
  • Editor's Choice
  • Fellows' Journal Club
  • Letters to the Editor
  • Video Articles

Cases

  • Case Collection
  • Archive - Case of the Week
  • Archive - Case of the Month
  • Archive - Classic Case

More from AJNR

  • Trainee Corner
  • Imaging Protocols
  • MRI Safety Corner
  • Book Reviews

Multimedia

  • AJNR Podcasts
  • AJNR Scantastics

Resources

  • Turnaround Time
  • Submit a Manuscript
  • Submit a Video Article
  • Submit an eLetter to the Editor/Response
  • Manuscript Submission Guidelines
  • Statistical Tips
  • Fast Publishing of Accepted Manuscripts
  • Graphical Abstract Preparation
  • Imaging Protocol Submission
  • Evidence-Based Medicine Level Guide
  • Publishing Checklists
  • Author Policies
  • Become a Reviewer/Academy of Reviewers
  • News and Updates

About Us

  • About AJNR
  • Editorial Board
  • Editorial Board Alumni
  • Alerts
  • Permissions
  • Not an AJNR Subscriber? Join Now
  • Advertise with Us
  • Librarian Resources
  • Feedback
  • Terms and Conditions
  • AJNR Editorial Board Alumni

American Society of Neuroradiology

  • Not an ASNR Member? Join Now

© 2025 by the American Society of Neuroradiology All rights, including for text and data mining, AI training, and similar technologies, are reserved.
Print ISSN: 0195-6108 Online ISSN: 1936-959X

Powered by HighWire