
Abstract
BACKGROUND AND PURPOSE: Glioblastoma-associated macrophages are a major constituent of the immune response to therapy and are known to engulf the iron-based MR imaging contrast agent, ferumoxytol. Current ferumoxytol MR imaging techniques for localizing macrophages are confounded by contaminating intravascular signal. The aim of this study was to assess the utility of a newly developed MR imaging technique, segregation and extravascular localization of ferumoxytol imaging, for differentiating extravascular-from-intravascular ferumoxytol contrast signal at a delayed 24-hour imaging time point.
MATERIALS AND METHODS: Twenty-three patients with suspected post-chemoradiotherapy glioblastoma progression underwent ferumoxytol-enhanced SWI. Segregation and extravascular localization of ferumoxytol imaging maps were generated as the voxelwise difference of the delayed (24 hours) from the early (immediately after administration) time point SWI maps. Continuous segregation and extravascular localization of ferumoxytol imaging map values were separated into positive and negative components. Image-guided biologic correlation was performed.
RESULTS: Negative segregation and extravascular localization of ferumoxytol imaging values correlated with early and delayed time point SWI values, demonstrating that intravascular signal detected in the early time point persists into the delayed time point. Positive segregation and extravascular localization of ferumoxytol imaging values correlated only with delayed time point SWI values, suggesting successful detection of the newly developed extravascular signal.
CONCLUSIONS: Segregation and extravascular localization of ferumoxytol MR imaging improves on current techniques by eliminating intrinsic tissue and intravascular ferumoxytol signal and may inform glioblastoma outcomes by serving as a more specific metric of macrophage content compared with uncorrected T1 and SWI techniques.
ABBREVIATIONS:
- CRT
- chemoradiotherapy
- GBCA
- gadolinium-based contrast agent
- IDH
- isocitrate dehydrogenase
- SELFI
- segregation and extravascular localization of ferumoxytol imaging
- TAMs
- tumor-associated macrophages and microglia
Standard of care surgical resection and Stupp protocol chemoradiotherapy (CRT; temozolomide with conformal irradiation) results in a 14.2-month median overall survival for patients with isocitrate dehydrogenase (IDH) wild-type glioblastoma.1-3 Following CRT, some patients undergo an inflammatory response that manifests as transiently progressive gadolinium-based contrast agent (GBCA) enhancement on MR imaging, commonly termed “pseudoprogression.”4⇓⇓-7 The development of pseudoprogression may improve overall survival, but this relationship is not completely understood.8-10 This gap in clinical knowledge is exacerbated by the inability of GBCA MR imaging to distinguish pseudoprogression from true glioblastoma regrowth.11 Establishing a definitive diagnosis by surgical biopsy or follow-up MR imaging delays therapy for true disease recurrence and may adversely affect overall survival.8-13 Therefore, the development of a biologically specific imaging metric of inflammation may improve clinical outcomes.
Tumor-associated macrophages and microglia (TAMs) are a major constituent of the immune response of the brain to glioblastoma therapy and account for up to 40% of the cellular tumor mass.4 Because TAMs are professional iron recyclers with properties that are directly linked to phagocytosis, ultrasmall superparamagnetic iron oxide–enhanced MR imaging is well-suited for the detection of inflammation.14,15 TAMs-mediated neuroinflammation has been visualized in vivo using delayed time point MR imaging, 24 hours after intravenous administration of ultrasmall superparamagnetic iron oxide ferumoxytol (Feraheme; AMAG Pharmaceuticals) in preclinical glioblastoma models.15 Ferumoxytol is FDA-approved for intravenous iron supplementation but can be used off-label as an MR imaging contrast agent.16 Early time point MR imaging (immediately following intravenous ferumoxytol administration) allows the quantification and localization of the intravascular agent;17 however, its prolonged circulating half-life limits facile interpretation of extravascular signal changes in the glioblastoma microenvironment at delayed time point imaging up to 48 hours later.18
We hypothesized that the localization of glioblastoma TAMs could be improved by a combined imaging and analytic approach of early and delayed time point MR imaging with ferumoxytol. We assessed the use of SWI at multiple imaging time points to produce high-resolution segregation and extravascular localization of ferumoxytol imaging (SELFI) maps for the putative isolation of extravascular ferumoxytol as a surrogate marker of TAMs. Using a well-characterized cohort of patients with clinically suspected glioblastoma progression, we show the following: 1) Signal on delayed time point SWI is partially a reflection of persistent intravascular ferumoxytol, 2) the generation of SELFI maps allows the localization of TAMs-accumulated extravascular ferumoxytol signal that is only observed in the delayed time point of imaging, and 3) positive SELFI values, in part, tend to stratify overall survival in patients with glioblastoma.
MATERIALS AND METHODS
Patient Population
This retrospective Oregon Health & Science University institutional review board–approved study included subjects meeting the following inclusion criteria: 1) histologically confirmed diagnosis of glioblastoma (World Health Organization classification, grade IV glioma); 2) documentation of IDH-1 mutational and O-6-methylguanine-DNA methyltransferase promoter methylation status (R132H; Clinical Laboratory Improvement Amendments, No. 38D2018256); 3) a Karnofsky Performance Score (KPS of more than 50); 4) prior maximal safe resection followed by CRT using the Stupp protocol;2 5) GBCA MR imaging demonstrating evidence of preliminary progressive disease according to Response Assessment in Neuro-Oncology criteria;6 6) subsequent GBCA MR imaging within 72 hours before ferumoxytol MR imaging; and 7) SWI performed before and following intravenous ferumoxytol administration. The early time point of imaging was defined by SWI within 10 minutes of intravenous ferumoxytol administration. Delayed time point imaging was defined by SWI performed approximately 24 hours following intravenous ferumoxytol administration. Exclusion criteria included the absence of delayed time point ferumoxytol-enhanced T1-weighted MR imaging or SWI. None of the patients who met the inclusion criteria were excluded from analysis.
Twenty-three patients were studied between January 2012 and January 2018 (On-line Table). Medical records established either glioblastoma recurrence or pseudoprogression as the etiology for preliminary progressive disease. Sixteen patients (70% of the cohort) were diagnosed with recurrent tumor. Four of these patients underwent standard-of-care re-resection to establish disease status via histologic analysis. The remaining 19 patients were diagnosed with either pseudoprogression (5 with IDH wild-type, 2 with IDH-mutant) or recurrent tumor via integration of patient clinical course and serial GBCA MR imaging. Thirteen patients received dexamethasone (mean, 3.74 ± 4.56 mg) concurrent with ferumoxytol administration. Four patients with tumor recurrence received bevacizumab (10 mg/kg) before or the same day as ferumoxytol administration. Dexamethasone and bevacizumab were administered to reduce the clinical adverse effects of vasogenic edema.
Image Acquisition
All patients underwent 3T MR imaging (Ingenia; Philips Healthcare) examinations using 1 of 2 imaging protocols. Protocol 1 (12 patients) entailed MR imaging for 3 consecutive days, whereas protocol 2 (11 patients) entailed MR imaging for 2 consecutive days. 3D-SWI (TR/TE/flip angle = 26 ms/20 ms/15°, FOV = 210 mm2, imaging matrix = 5122, in-plane resolution = 0.412, 116 contiguous axial slices with 2.2-mm section thickness, 1.1-mm overlap producing 232 evaluable slices) was performed before, immediately following (early time point), and 24 hours (delayed time point) after intravenous ferumoxytol administration (∼15-minute infusion at a dose of up to 510 mg). Gradient echo 3D T1-weighted images (TR/TE/flip angle = 8.14 ms/3.72 ms/8°, 160 contiguous 1- mm-thick axial slices) were acquired pre- and postgadoteridol gadolinium chelate (GBCA, ProHance; Bracco Diagnostics; 0.1 mmol/kg) and ferumoxytol administration. GBCA-enhanced sequences were performed before ferumoxytol administration. All MR imaging measurements were completed on the same instrument for each participant.
Contrast-Enhancement Segmentation.
A neurologic radiologist with 10 years of experience (R.F.B. Jr) reviewed contrast-enhanced T1-weighted volumes (GBCA and delayed ferumoxytol) and manually marked a large ROI that covered all possible enhancement in both T1-weighted datasets. These preliminary ROIs were then automatically segmented into contrast-enhancing and nonenhancing voxels, as previously described,19 allowing the generation of a lesion-wide enhancement mask from which SELFI values were assessed; the results of the segmentation were visually inspected, and none required manual intervention.
Generation of SELFI Maps
Figure 1 illustrates the SELFI calculation. Briefly, SWI magnitude images (precontrast, early time point, and delayed time point) were rigidly registered to the non-contrast-enhanced T1-weighted volume (3dAllineate, Analysis of Functional Neuro Images [AFNI]; http://afni.nimh.nih.gov/afni). Early and delayed time point maps were created by taking the natural log of the ratio of a precontrast voxel to the same postcontrast voxel so that the magnitude of a value of a voxel was proportional to the concentration of contrast. Any resulting negative values (voxels in which SWI signal increased after the administration of contrast agent, <5% of the voxels in all cases) were considered noise and removed from both maps. For the early time point, this step produced a CBV map. SELFI maps were created by taking the voxelwise difference of the delayed time point map from the early time point map (3dcalc, AFNI; https://afni.nimh.nih.gov/pub/dist/doc/program_help/3dcalc.html; Fig 1, middle):
 where i is a voxel, SWIpre is the value of the voxel on the noncontrast SWI, SWIET is the is the value of the voxel on the SWI immediately after contrast, and SWIDT is the value of the voxel on the delayed SWI (∼24 hours after contrast administration). Mean values from the generated maps were calculated within both the GBCA and ferumoxytol contrast-enhancing ROI (3dmaskave, AFNI; https://afni.nimh.nih.gov/pub/dist/doc/program_help/3dmaskave.html). Mean negative (SELFI−) and positive (SELFI+) portions of the SELFI maps were calculated separately so that the absolute value of each positive and negative voxel was proportional to the relative contribution of that voxel (Fig 1, right):

 where n is the number of voxels within the enhancement mask, i is a voxel within the enhancement mask, SWIpre is the noncontrast SWI, SWIET is the SWI immediately after contrast, and SWIDT is the delayed SWI (∼24 hours after contrast administration). The log function was used so that nonlinearities in ratio variables could be linearized, so that the ratios were equidistant and the dependent variable was not weighted in favor of the denominator. For example, the ratios of 5/2 and 2/5 are not equidistant from 1 until the log is performed [log10(5/2) = 0.40 and log10(2/5) = −0.40]. This feature allows centering of the displacement of the relationship evenly around zero irrespective of which variable is in the numerator or denominator. Likewise, the introduction of a log-transform equilibrates the magnitude of an effect (both positive and negative) within 2 hypothetic voxels. Finally, in an effort to provide a single aggregate per tumor score of both the magnitude and spatial extent of inflammatory infiltrate, primarily for the purpose of testing against overall survival (see Statistical Analysis), mean SELFI+ values were scaled by the proportion of voxels that were positive relative to the number of voxels that were enhanced in the postferumoxytol T1-weighted volume.

Segregation and Extravascular Localization of Ferumoxytol Imaging (SELFI) processing pipeline. Left, The MR acquisition of susceptibility weighted imaging (SWI) is performed prior to (pre-contrast), immediately after (early time point; ET), and 24 h following ferumoxytol administration (delayed time point; DT). Middle, Post processing of early and delayed time point maps are calculated on a voxel wise basis as the log of the quotient of the pre to post-contrast images. Right, SELFI is calculated as the difference of the delayed time point map from the early time point maps. The SELFI map can be further segmented into positive (“extravascular”, delayed time point signal > early time point signal, “SELFI +”) and negative (“intravascular”, early time point signal > delayed time point signal, “SELFI −”) values (right). Fe-T indicates Ferumoxytol T1-weighted Delayed Time point.
Image-Guided Tissue Sampling and Specimen Processing
To investigate the biologic processes associated with SELFI metrics, we performed stereotactic tissue sampling in a patient with newly diagnosed glioblastoma at the time of the initial surgical resection. Six sampling sites were prospectively marked on an intraoperative neuronavigational device on the basis of the presence or absence of 24-hour delayed ferumoxytol signal. The precise location of the sampling sites was recorded (screen shots and MR imaging coordinates) at the time of intraoperative biopsy and allowed coregistration with T1-weighted gadolinium-enhanced and SELFI MR imaging sequences.
Immunohistochemical staining with CD34 (microvascular density), CD68 (TAMs), Dx1 (dextran ferumoxytol coating), and Perls Prussian blue (iron) allowed a subjective assessment using a 4-tier ordinal scale (0, no immunoreactivity; 3, intense immunoreactivity), with 4 high-power fields at a magnification of 20× or greater. Additionally, to better understand the location of ferumoxytol at the 24-hour delayed imaging time point, we performed immunofluorescent histochemistry (Dx1 and Iba1 [for TAMs localization] antibodies) on tissue obtained from a rat model of syngeneic glioblastoma after 13 days of intracerebral growth using an Institutional Animal Care and Use Committee–approved protocol. Antibody labeling was visualized using an LSM 780 confocal microscope (Zeiss). A total of 136 images were obtained with 0.3-μm optical sectioning. An attending neuropathologist (R.W., with >20 years of experience) who was blinded to the imaging results performed all qualitative immunohistochemical assessments.
Statistical Analysis
The Pearson r tested for correlation between imaging metrics. Student t tests assessed differences between signal intensity and SELFI metrics. Overall survival was classified in IDH wild-type glioblastoma from the date of surgical diagnosis until death or last follow-up date for patients without an event. Survival analysis was performed using multivariate Cox regression analysis, covarying for age and KPS, on mean delayed time point and aggregate SELFI+ scores as calculated above (SPSS, Version 25.0; IBM).P values < .05 were considered statistically significant.
RESULTS
Comparison of Enhancing GBCA and Ferumoxytol Volume and Signal Intensity
The cohort-wide root volumes of GBCA enhancement significantly exceeded those of delayed ferumoxytol enhancement (paired t(22) = 2.25, P = .03), as did the mean normalized T1 image intensity within enhancing ROIs (paired t(22) = 2.77, P = .01). Despite significant differences in enhancement volumes and intensities, GBCA and ferumoxytol T1-enhancement volumes were significantly correlated (r(21) = 0.87, P < .01) as were normalized T1 signal intensities (r(21) = 0.87, P = .01). Finally, the enhancing volumes in GBCA and ferumoxytol were correlated with their respective normalized intensities (r(21) = 0.51 and 0.53, P < .01, respectively). All findings presented here were of the same statistical significance in both GBCA- and ferumoxytol-enhancing ROIs; therefore, only values derived from ferumoxytol-enhancing ROIs are reported, unless GBCA and ferumoxytol are directly compared.
Comparison of Ferumoxytol-Enhanced Early Time Point, Delayed Time Point, and SELFI Map Measurements
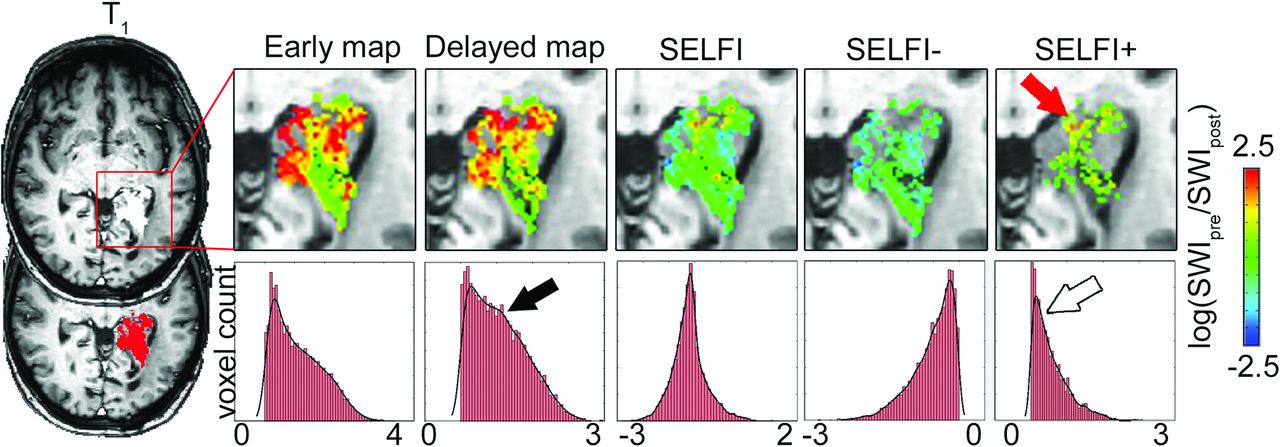
Early and delayed time point SWI measurements were significantly correlated, suggesting that intravascular ferumoxytol signal contaminates delayed measurements when using the standard uncorrected approach (r(21) = 0.56, P < .01). An example of early time point, delayed time point, SELFI maps, and corresponding voxelwise histograms from a single patient with disease recurrence can be found in Fig 2. Both SELFI+ (extravascular) and SELFI− (remaining intravascular signal at the delayed imaging time point) were correlated with delayed time point SWI measurements(r(21) = 0.87 and −0.48, respectively, P < .03; Fig 3A, top right), confirming the contamination of intravascular ferumoxytol in delayed time point SWI measurements. However, only SELFI− values were significantly correlated with early time point SWI measurements, confirming localization of intravascular signal (r(21) = 0.87, P < .001; Fig 3A, top left).

Specific extravascular ferumoxytol accumulation is localized by SELFI+ values. T1-weighted ferumoxytol-enhanced image and automated enhancement segmentation masks are shown on the left. Similarities are observed between early time point (leftmost map) and delayed time point maps (second from left). The hump shown in the histogram of the delayed time point map (black closed arrow) represents the remaining intravascular ferumoxytol; this signal is removed in the SELFI+ map (rightmost histogram, open arrow). The specific extravascular signal that arises from ferumoxytol contrast accumulation in the delayed time point is only clearly visualized by the SELFI technique (red closed arrow, rightmost map).

SELFI technique discriminates intravascular-from-extravascular ferumoxytol contrast pools. A, Intravascular ferumoxytol signal (SELFI−, solid circle) is observed in both the early time point (left panel) and the delayed time point maps (right panel), contaminating the signal on the latter. Conversely, SELFI+ values (empty circles) are correlated with only delayed time point map values (right panel), suggesting that the metric is not present in the early imaging time point. B, The relationship of GBCA (left panel) and delayed ferumoxytol (right panel) T1 intensity to SELFI metrics. SELFI+ values (solid squares) and delayed time point map mean values (empty circles) demonstrate a significant correlation with only delayed ferumoxytol (right panel) and not GBCA T1 enhancing signal (left panel) intensity. SELFI− values (solid circles) are not correlated with enhancement signal intensity. Note that statistically significant (P < .05) regressions are shown as solid lines and nonsignificant regressions are represented by dashed lines. Each point on the graph represents a patient’s mean imaging value. ET indicates early time point; DT, delayed time point.
Comparison of SELFI Measurements and Intensity of T1 Enhancement
Normalized signal intensity of delayed time point ferumoxytol T1 enhancement was correlated with SELFI+ (extravascular) measurements and delayed time point SWI maps (r(21) = 0.68 and 0.75, P < .001, respectively), but not with SELFI− (intravascular) measurements (r(21) = –0.19, P > .3; Fig 3B, bottom right). Most interesting, the normalized signal intensity of GBCA T1 enhancement was not correlated with delayed time point SWI maps or SELFI measures (r(21) = 0.33, 0.33, and −0.13, P > .1; Fig 3B, bottom left), suggesting that the functional significance of the magnitude of delayed ferumoxytol T1 enhancement differs from that of GBCA T1 enhancement.
SELFI Association with Tumor Biology
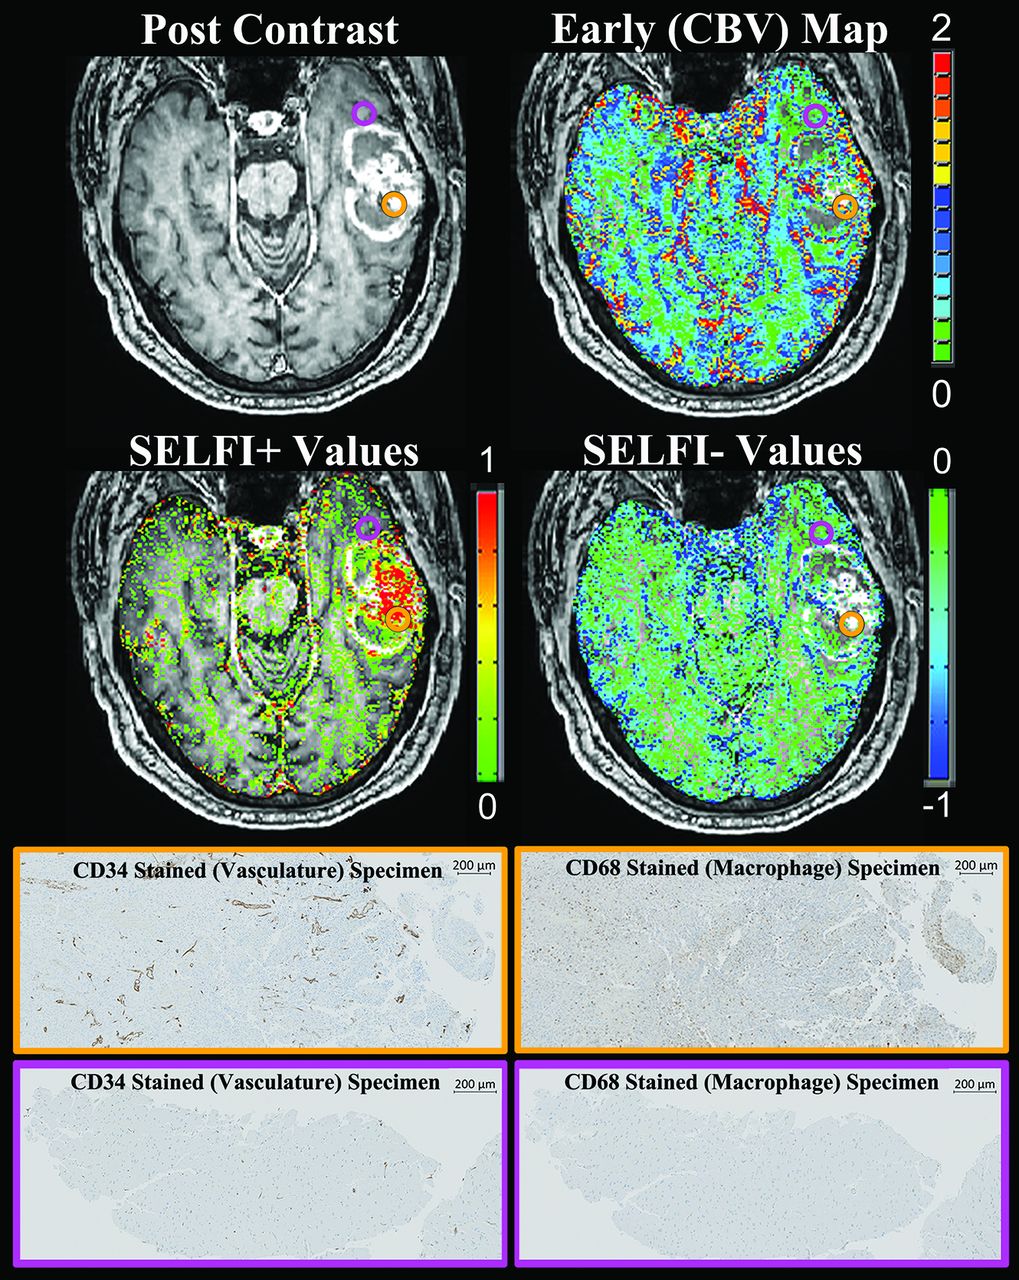
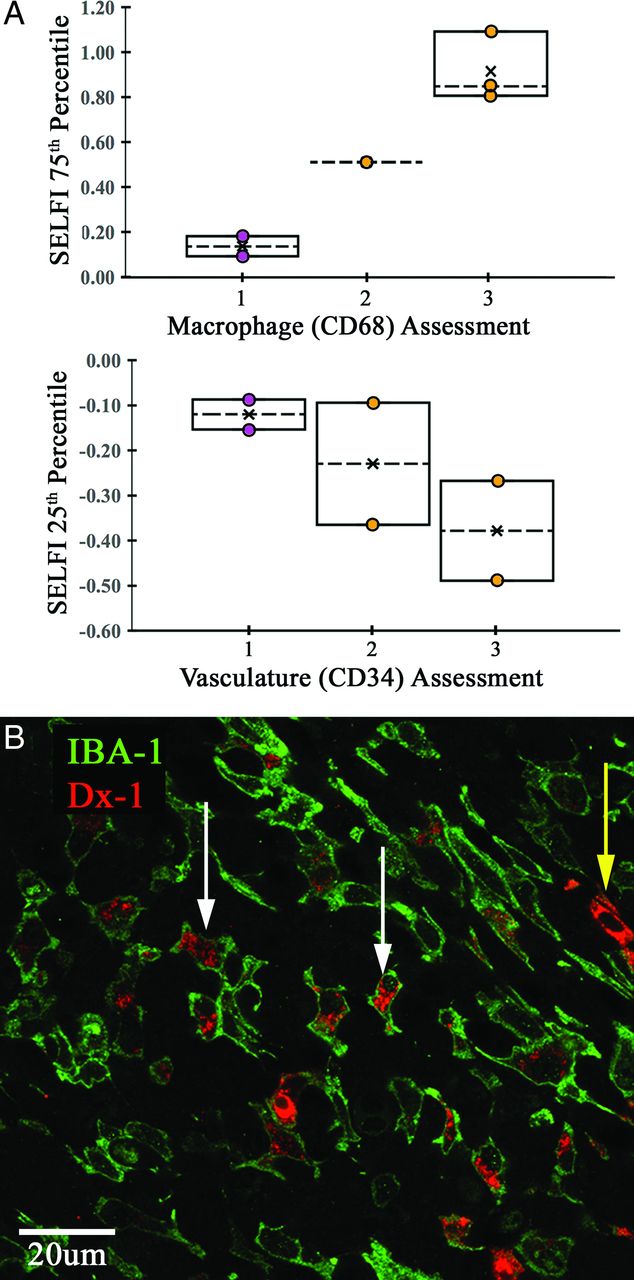
Stereotactic image-guided tissue sampling in a patient with newly diagnosed IDH wild-type glioblastoma allowed for the collection of 6 specimens (4 enhancing, 2 nonenhancing) (Fig 4). Increasing SELFI+ values demonstrated increasing TAMs infiltration (Fig 5A). Conversely, decreasing SELFI– values demonstrated increasing microvascular density. We observed TAMs-specific intracellular uptake of ferumoxytol 24 hours after administration in a syngeneic glioblastoma rat model (Fig 5B and On-line Video). Ferumoxytol contrast was not visualized within the extravascular extracellular space.

SELFI technique characterizes the glioblastoma immune microenvironment. We performed image-guided tissue sampling in a 64-year-old man with newly diagnosed IDH wild-type glioblastoma to determine whether SELFI MR imaging could differentiate intravascular-from-extravascular ferumoxytol signal. Preoperative T1-weighted gadolinium-enhanced images (Row 1) were integrated into the intraoperative neuronavigational device, allowing sampling of enhancing (orange ROI, n = 4) and nonenhancing (purple ROI, n = 2) regions. Regions with decreased SELFI– values (Row 2 right) and elevated cerebral blood volume (Row 1 right) demonstrate elevated microvascular density (CD34) counts (Row 3 left). Conversely, regions with elevated SELFI+ values (Row 2 left) demonstrate marked TAMs infiltration (CD68; Row 3 right). SELFI regions with values near zero demonstrate neither marked microvascular density nor TAMs infiltration (Row 4). No ferumoxytol staining was observed within the extravascular extracellular interstitial tumor space (not shown). We note that CBV maps would not have been capable of specifically localizing TAMs infiltration because regions of elevated CBV and decreased SELFI– values are not spatially similar to regions of elevated SELFI + values. This biologic paradigm is well-demonstrated about the medial enhancing wall. This case example provides preliminary data showing that the SELFI imaging approach is a feasible method to discriminate intravascular-from-extravascular ferumoxytol contrast pools.

Relationship between SELFI values and glioblastoma tumor biology. A, Boxplots of macrophage (top) and microvascular density (middle) qualitative assessment using a 0 (no immunoreactivity) to 3 (intense immunoreactivity) ordinal scale are plotted against continuous SELFI values for 6 tissue specimens (4 enhancing [orange circles], 2 nonenhancing [purple circles]). A positive association was observed between increasing SELFI and macrophage values. Conversely, a negative association was observed between decreasing SELFI values and increasing microvascular density within the tissue specimen. Central x indicates mean; dashed line, median. B, Immunofluorescence (bottom) from a syngeneic glioblastoma rat model demonstrates intracellular localization of ferumoxytol (red, Dx1) within macrophages/microglia (green, Iba-1; white arrows) and tumor vasculature (yellow arrow) 24 hours following administration. No Dx1 immunofluorescence is observed within the extravascular extracellular space.
Ferumoxytol MR Imaging Measurements and Overall Survival
The overall cohort survival ranged from 5.83 to 91.0 months (median, 16.6 months). Cox regression survival analysis of the 19 patients with IDH wild-type disease progression (5 pseudoprogressions, 14 disease recurrences) was nonsignificant for the delayed time point metric (B = –0.13, Wald = 0.017, P > .8), though it approached significance for the tumor-wide SELFI+ metric (B = 2.98, Wald = 2.57, P = .1). Higher KPS and age were significantly associated with longer and shorter survival, respectively, in the SELFI+ metric multivariate model (P = .02 and .05, respectively) but not in the delayed time point model (P = .06 and .06), further demonstrating the clinical value of isolating inflammation-specific signal with the SELFI+ metric.
DISCUSSION
We investigated whether SELFI maps could be used to distinguish extravascular-from-intravascular ferumoxytol pools in 23 patients with CRT-treated glioblastoma at the time of presumed disease progression. Our results suggest that SELFI+ values represent accumulated extravascular ferumoxytol after 24 hours and that SELFI− values delineate the persistence of contaminating intravascular ferumoxytol at the delayed imaging time point. Preliminary biologic assessment using stereotactic image-guided tissue sampling techniques suggests that increasing SELFI + values localize regions of increasing TAMs infiltration, while decreasing SELFI− values localize regions of increasing microvascular density. Higher aggregate SELFI+ values were found to trend toward lower overall survival within this small cohort. These observations suggest that both T1 and T2* MR imaging signal changes in the delayed time point are partially a reflection of persistent contamination by intravascular ferumoxytol, which precludes an accurate assessment of the accumulation of extravascular contrast. This retrospective study supports our hypothesis that SELFI maps provide an approach to localize extravascular ferumoxytol contrast accumulation in the delayed time point by eliminating intrinsic tissue and intravascular signal. Our results suggest that the SELFI technique may serve as a more specific imaging metric for localizing TAMs within the glioblastoma microenvironment compared with the currently used uncorrected T1 and SWI sequences. Taken together, the SELFI technique presented here advances neuro-oncologic research and practice by possibly providing a clinically feasible biomarker of accumulating phagocytic immune cells in the central nervous system, including TAMs, and may inform survival outcomes in patients with Stupp protocol–treated IDH wild-type glioblastoma.
Prior investigations have explored the localization of TAMs using T2*-weighted imaging based on the inverse linear relationship with R2* signal relaxation rates, demonstrating that macrophage infiltration and microglia activation within injured central nervous system tissue are responsible for the accumulation of iron oxide nanoparticles.20 However, previous reports have not accounted for intrinsic tissue (iron as a by-product of prior tissue bleeding) or persistent intravascular ferumoxytol signal.18 Indeed, Iv et al18 have painstakingly revealed that glioblastoma regions devoid of macrophage accumulation demonstrate T2*-weighted signal changes in the delayed time point of ferumoxytol imaging. Our results suggest that the observed SWI signal changes include a combination of 2 spatially separate and functionally distinct ferumoxytol pools: 1) residual intravascular ferumoxytol, and 2) extravascular intercellular accumulation within TAMs. Therefore, the use of uncorrected delayed time point ferumoxytol-enhanced MR imaging may lead to falsely positive inflammatory “hotspots” due to persistent intravascular contrast. If ferumoxytol-associated MR imaging signal changes are dependent on transport across the blood-brain barrier in the context of activated innate immunity, accurate quantification of brain parenchymal TAMs requires an account of residual intravascular signal. SELFI is a method for the deconvolution of intra- and extravascular signal contributions observed within delayed time point ferumoxytol-enhanced MR imaging.
SELFI MR imaging would be extremely valuable in future in vivo investigations of the immune microenvironment within glioblastoma. Glioblastoma cells have complex inhibitory mechanisms to suppress and escape local immune surveillance.4,21 The consequence is the establishment of a protumoral im-munosuppressive microenvironment that promotes unchecked glioblastoma growth.22 Functionally, the immunosuppressive microenvironment serves as a biologic feature thatcontributes to the development of glioblastoma therapeutic resistance.23 Rigorous pioneering work by Macdonald et al5 and Stupp et al2,3 has made GBCA-enhanced MR imaging the standard of care for monitoring glioblastoma response to therapy. After therapy, neuroinflammation (pseudoprogression) is characterized by enlarging enhancement that spontaneously resolves.6 Un-fortunately, GBCA-enhanced MR imaging lacks specificity in characterizing therapeutic failure because local regional tumor regrowth cannot be prospectively distinguished from therapy-mediated neuroinflammation.24 Pseudoprogression has been consistently observed in 30% of patients undergoing therapy,4-7 with some investigators reporting increased survival.8-13 While not designed to directly assess the added value of the SELFI metric to gadolinium en-hancement for the diagnosis and prognosis of glioblastoma, our study does further address the need for the development of a biologically specific imaging metric capable of localizing neuroinflammation.25,26 The noninvasive quantification of the tumor immune response may provide additional diagnostic and prognostic information beneficial to the planning and monitoring of therapy, and SELFI is a molecular imaging approach by which the glioblastoma innate immune microenvironment can be characterized.
SELFI + values could be a prognostic biomarker of overall survival in patients with CRT-treated IDH wild-type glioblastoma. The lack of a clinically prognostic biomarker of the tumor immune microenvironment is a critical gap in knowledge in the era of immunotherapy. Novel therapeutic techniques aimed at immune augmentation require an appropriate molecular imaging metric to demonstrate changes in the targeted biologic mechanism. Immune checkpoint blockade leads to an increased antitumor immune response, which results in therapy-mediated inflammation.27 The interaction between tumor and cytotoxic T-cells is considered a key target for checkpoint inhibition, but emerging evidence suggests that checkpoint blockade also influences therapeutic efficacy through innate immunity.28 Preliminary reports suggest that checkpoint efficacy is characterized by marked proinflammatory lymphohistiocytic infiltration.28 Given the potential importance of TAMs activation in glioblastoma therapy, the development of a biologically specific imaging metric of protumoral and proinflammatory macrophage accumulation would be clinically indispensable. We are prospectively evaluating the utility of delayed ferumoxytol MR imaging in subjects receiving standard-of-care CRT with or without concurrent checkpoint inhibitors in primary and metastatic brain tumors (clinicaltrials.gov; NCT00103038, NCT03347617, and NCT03325166). The SELFI approach may provide additional prognostic value within this clinical context.
Small sample size and the retrospective nature of this study are limitations that caution against overinterpretation of these findings; future prospective investigations should verify these imaging characteristics within a separate larger cohort of patients. While ferumoxytol phagocytosis by TAMs is a proposed mechanism for the observed signal characteristics, validation must include a larger cohort of image-guided tissue sampling to verify the biologic correlate. Unfortunately, histopathologic confirmation of differential TAMs accumulation based on SELFI+ values is not available in all our patients. Finally, the cohort sample size and characteristics provided insufficient statistical power to assess the diagnostic value of SELFI or the prognostic implications of SELFI in IDH wild-type glioblastoma. Notably, ferumoxytol-enhanced MR imaging is a clinically feasible tool for the study of brain tumors with a positive safety profile.29
CONCLUSIONS
This study describes the newly developed SELFI technique for the differentiation of extravascular ferumoxytol contrast signal from residual intravascular signal at a 24-hour delayed imaging time point within CRT-treated glioblastoma. SELFI improves on current techniques by eliminating contributions from intrinsic tissue and intravascular signal through voxelwise subtraction of early and delayed time point ferumoxytol maps. Once prospectively validated, this methodology may prove to be a spatially specific biomarker for the accumulation of phagocytic cells such as TAMs within the glioblastoma-immune microenvironment and may help inform treatment and clinical management of glioblastoma.
ACKNOWLEDGMENTS
The first author thanks Bethany Barajas, MSN, for her helpful comments regarding this article; the many clinical collaborators, including Joseph Anderson-Bussiere and Shannon Spruell, for their helpfulness; and the many wonderful patients included in this study who selflessly contributed their time to undergo research medical imaging while confronting a deadly disease. The first author dedicates this research to the memory of Rachel Dawn Gabani.
Footnotes
Ramon F. Barajas, Jr and Daniel Schwartz contributed equally to this document.
This work was supported, in part, by National Institutes of Health grants CA199111 (to E.A.N.), CA137488-15S1 (to E.A.N. and R.F.B. Jr), 1 L30 CA220897-01 (to R.F.B. Jr), KL2TR002370 (to R.F.B. Jr), the Walter S. and Lucienne Driskill Foundation (to E.A.N.), and a Veterans Administration Merit Review grant (to E.A.N.).
Disclosures: Ramon F. Barajas, Jr—RELATED: Grant: National Institutes of Health.* Daniel Schwartz—RELATED: Grant: National Institutes of Health, Walter S. and Lucienne Driskill Foundation, Veterans Administration Merit Review.* Bronwyn E. Hamilton—UNRELATED: Royalties: Elsevier, Comments: book editor/author royalties. David R. Pettersson—UNRELATED: Employment: Oregon Health & Science University. Edward A. Neuwelt—RELATED: Grant: National Institutes of Health grants CA199111, CA137488-15S1, 1 L30 CA220897-01, the Walter S. and Lucienne Driskill Foundation, and by a Veterans Administration Merit Review grant, Comments: This work was supported, in part, by National Institutes of Health grants CA199111, CA137488-15S1, 1 L30 CA220897-0; the Walter S. and Lucienne Driskill Foundation; and a Veterans Administration Merit Review grant, all to E.A.N. Jeremy Ciporen—UNRELATED: Patents (Planned, Pending or Issued): consultant SPIWAY. *Money paid to the institution.
Indicates open access to non-subscribers at www.ajnr.org
References
- Received August 16, 2019.
- Accepted after revision April 2, 2020.
- © 2020 by American Journal of Neuroradiology


