
Abstract
SUMMARY: The Response Assessment in Neuro-Oncology criteria were developed as an objective tool for radiologic assessment of treatment response in high-grade gliomas. Imaging plays a critical role in the management of the patient with glioma, from initial diagnosis to posttreatment follow-up, which can be particularly challenging for radiologists. Interpreting findings after surgery, radiation, and chemotherapy requires profound knowledge about the tumor biology, as well as the peculiar changes expected to ensue as a consequence of each treatment technique. In this article, we discuss the imaging findings associated with tumor progression, tumor response, pseudoprogression, and pseudoresponse according to the Response Assessment in Neuro-Oncology criteria for high-grade and lower-grade gliomas. We describe relevant practical issues when evaluating patients with glioma, such as the need for imaging in the first 48 hours, the radiation therapy planning and isodose curves, the significance of T2/FLAIR hyperintense lesions, the impact of the timing for the evaluation after radiation therapy, and the definition of progressive disease on the histologic specimen. We also illustrate the correlation among the findings on conventional MR imaging with advanced techniques, such as perfusion, diffusion-weighted imaging, spectroscopy, and amino acid PET. Because many of the new lesions represent a mixture of tumor cells and tissue with radiation injury, the radiologist aims to identify the predominant component of the lesion and categorize the findings according to Response Assessment in Neuro-Oncology criteria so that the patient can receive the best treatment.
ABBREVIATIONS:
- DCE
- dynamic contrast-enhanced
- GBM
- glioblastoma
- RANO
- Response Assessment in Neuro-Oncology
- rCBV
- relative CBV
- VEGF
- vascular endothelial growth factor
Glial tumors are the most common intra-axial primary tumors of the CNS, with an age-adjusted estimated incidence varying from 0.8 to 5.5 per 100,000, according to the reporting country/organization.1,2 The most common and aggressive histologic type is glioblastoma (GBM), which accounts for about 60% of the cases.1 Despite decades of substantial advances in diagnostic radiology, surgery, radiation therapy, chemotherapy, and clinical management of oncology patients, the fatality rate for gliomas remains relentlessly high, especially for GBM. A recent study reported a 1-year survival rate after diagnosis of 41.4% and a 5-year survival rate of only 5.4% for GBM,3 after analysis of 150,631 patients. Similarly, the reported median survival time after tumor recurrence is about 6 months.4
Imaging plays a critical role in the management of the patient with glioma, from the initial diagnosis to the posttreatment follow-up, which can be particularly challenging for radiologists. Interpreting findings after an operation, radiation, and chemotherapy requires profound knowledge about the tumor biology, as well as the peculiar changes expected to ensue as a consequence of each treatment technique so that the patients with glioma can receive the best care and eventually improve their survival.
In this article, we discuss the imaging findings associated with tumor progression, tumor response, pseudoprogression, and pseudoresponse according to the Response Assessment in Neuro-Oncology (RANO) criteria for high-grade and lower-grade gliomas. We describe relevant practical issues when evaluating patients with glioma, such as the need for imaging in the first 48 hours, radiation therapy planning and isodose curves, the significance of T2/FLAIR hyperintense lesions, the impact of timing for the evaluation after radiation therapy and the definition of progressive disease on the histologic specimen. We also illustrate the correlation among the findings on conventional MR imaging with advanced techniques, such as perfusion, DWI, spectroscopy, and amino acid PET.
Management of Gliomas
The management of gliomas varies according to the histologic grade, location, resectability of the tumor, and the performance status of the patient. For the high-grade gliomas, it usually involves maximal safe resection, which can be defined as resection of the enhancing tumor as much as possible to improve survival, keeping the surgically induced deficit at an acceptable level.5 Resection with clear margins, a common concept in oncology, is virtually impossible for diffuse gliomas regardless of the grade because the neoplastic cells remain in the macroscopically normal-appearing brain tissue, given their highly infiltrative nature. After the initial operation, most patients undergo adjuvant treatment with radiation therapy and chemotherapy with temozolomide according to the Stupp protocol (also known as chemoradiation), which has been shown to improve survival significantly.6 Antiangiogenic agents, such as bevacizumab, an antibody against vascular endothelial growth factor (VEGF), are considered second-line agents with poor survival benefit,7 usually reserved for recurrent disease.
The term “lower-grade glioma” is generally used as a synonym for the 2 most common World Health Organization grade II diffuse gliomas: diffuse astrocytoma and oligodendroglioma. Because those tumors tend to have an indolent clinical course but are not curable and their natural history usually exhibits transformation to high-grade glioma in most patients, the treatment for those tumors is far more controversial. The timing and extent of surgery and radiation therapy, as well as adjunctive chemotherapy, should be individualized, weighing the survival benefits and adverse effects of those treatments. More recently, novel advances in immunotherapy with vaccines have shown promising results while treating patients with gliomas, as extensively described in a recent review by Lim et al.8 Although the optimal immunotherapy treatment regimen and indications remain to be determined, as radiologists, we are expected to report an increasing number of examinations from patients under these therapies, either in clinical trials or in routine daily practice.
RANO Criteria: Standardized Definitions and Evaluation of Response
The Macdonald criteria were originally published in 1990,9 as the first objective tool for radiologic assessment of treatment response in high-grade gliomas. Such criteria were based primarily on evaluation of tumor enhancement through CT (and included information about steroid use and neurologic findings). In the following decades, MR imaging added fundamental information about the nonenhancing component of the tumor, depicted on T2-weighted/FLAIR sequences, and became the standard neuroimaging technique used to assess treatment response in high-grade gliomas, as updated by the same group in 2010 by publishing the RANO criteria.10 The most substantial difference in the RANO criteria was that contrast enhancement is not the only marker of tumor viability and that it may represent posttherapy changes instead of neoplastic tissue.
Similar to the Response Evaluation Criteria in Solid Tumors, the RANO criteria advocate standardization of imaging definitions so that the tumor-burden assessment can be accurate and reproducible. As shown in Fig 1, the RANO criteria define measurable disease as bidimensional contrast-enhancing lesions with clearly defined margins, with 2 perpendicular diameters of at least 10 mm, visible on ≥2 axial slices.10 The nonmeasurable disease is defined as either unidimensional measurable lesions, masses with margins not clearly defined as frequently noted in the surgical margins, or lesions with maximal perpendicular diameters of <10 mm.10 T2/FLAIR hyperintense lesions are also considered nonmeasurable and usually represent the most common imaging feature of lower-grade tumors. If there are multiple contrast-enhancing lesions, a minimum of 2 target lesions must be selected, which should be representative of the tumor burden, and the sum of the products of the perpendicular diameters of these lesions should be determined.10 The largest lesions are preferred, but the emphasis should also be placed on lesions that allow reproducible measurements.

Examples of measurable and nonmeasurable disease, according to the RANO criteria. A, Axial contrast-enhanced T1-weighted image shows a heterogeneously enhancing lesion in the left parietal lobe (arrows), corresponding to recurrent GBM, with both perpendicular measurements of >10 mm, thus representing measurable disease. The more commonly seen examples of nonmeasurable disease are represented in the axial T2 image (B), depicting a hyperintense infiltrating lesion in the left parieto-occipital region (arrowheads) in a patient with anaplastic astrocytoma. The axial contrast-enhanced T1-weighted image (C) shows a subcortical enhancing nodule representing a recurrent GBM (arrow), in which perpendicular diameters are <10 mm. The axial contrast-enhanced T1-weighted image (D) shows residual tumor in the resection cavity of a partially resected GBM (curved arrow), which has poorly defined margins.
In the follow-up assessment, the response of a patient with a high-grade glioma is usually classified into 4 categories: progressive disease, partial response, complete response, and stable disease, as summarized in Table. As will be discussed later, pseudoprogression and pseudoresponse are special situations in which the therapies (ie, radiation, temozolomide, and anti-VEGF agent) play a major role in the imaging appearance.
Criteria for response assessment incorporating MR imaging and clinical factorsa
Complete Response.
Complete response requires all of the following: complete disappearance of all enhancing measurable and nonmeasurable disease sustained for at least 4 weeks; no new lesions; and stable or improved nonenhancing (T2/FLAIR) lesions. Patients must be off corticosteroids (or on physiologic replacement doses only) and stable or improved clinically.10
Partial Response.
Partial response requires all of the following: ≥50% decrease, compared with baseline; the sum of products of perpendicular diameters of all measurable enhancing lesions sustained for at least 4 weeks; no progression of nonmeasurable disease; no new lesions; stable or improved nonenhancing (T2/FLAIR) lesions on the same or a lower dose of corticosteroids compared with baseline scan; and the patient being on a corticosteroid dose not greater than the dose at time of the baseline scan and stable or improved clinically.10
Stable Disease.
Stable disease occurs if the patient does not qualify for complete response, partial response, or progression and requires the following: stable nonenhancing (T2/FLAIR) lesions on the same or lower dose of corticosteroids compared with baseline scan and clinically stable status.10
Progression.
Progression is defined by any of the following: ≥25% increase in the sum of the products of perpendicular diameters of enhancing lesions (compared with baseline if no decrease) on stable or increasing doses of corticosteroids; a significant increase in T2/FLAIR nonenhancing lesions on stable or increasing doses of corticosteroids compared with the baseline scan or the best response after initiation of therapy, not due to comorbid events; the appearance of any new lesions; clear progression of nonmeasurable lesions; or definite clinical deterioration not attributable to other causes apart from the tumor or to a decrease in the corticosteroid dose.10
RANO Criteria: Relevant Practical Issues
Need for Imaging in the First 48 Hours.
It is of fundamental importance to obtain MR imaging within the first 48 hours after an operation to assess the extension of any residual lesion. Diffusion-weighted imaging can detect cytotoxic edema in the margins of the tumoral resection, which is considered to be a normal postoperative finding related to surgical manipulation. Similar to ischemic stroke, most of those areas of restricted diffusion eventually enhance beyond 48 hours, as depicted in Fig 2, as a sign of granulation tissue development. It is possible to differentiate residual tumor from contrast enhancement related to the normal postoperative period if imaging is obtained within 48 hours after an operation. On the other hand, if imaging is performed after 48 hours, contrast enhancement may be misinterpreted as residual tumor and impact future evaluations of tumor recurrence.

Postoperative findings after GBM resection in the right parietal lobe (not shown) in a 55-year-old man. A, Axial contrast-enhanced T1-weighted image in the immediate postoperative period demonstrates a fluid-filled surgical cavity (arrow) without any enhancing lesions, which is defined as gross total resection. B, An axial diffusion-weighted image shows marked restricted diffusion in the margins of the cavity (arrowhead), representing cytotoxic edema related to surgical manipulation. C, Axial contrast-enhanced T1-weighted image obtained 3 months after an operation shows the development of an enhancing focus in the surgical bed (arrowhead), corresponding to development of granulation tissue in the area of previously restricted diffusion, also a typical and predictable postoperative feature, which should not be misdiagnosed as recurrent or residual tumor.
Understanding Radiation Therapy Planning and Isodose Curves.
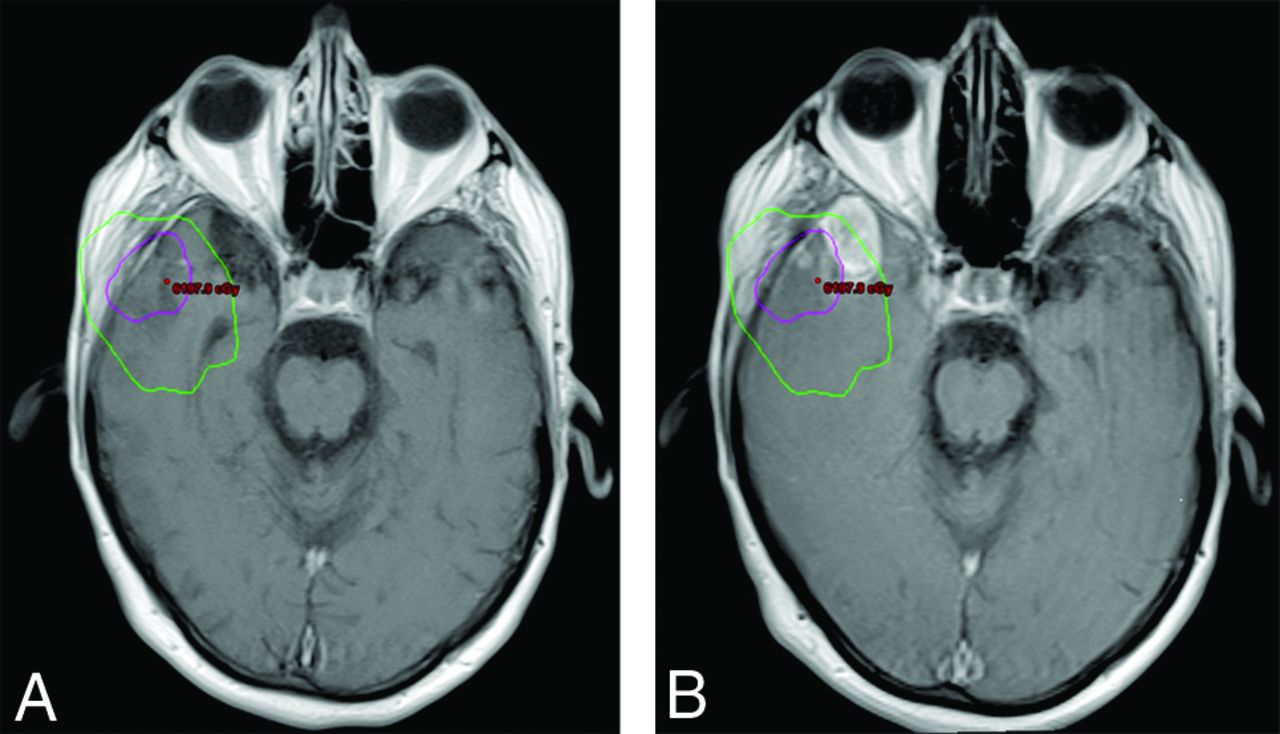
Current guidelines recommend the radiation therapy target volume to be delineated on the surgical cavity, encompassing any residual enhancement, with the addition of a 20-mm margin, which represents the most common site of recurrence.11 A planning CT scan of the brain is obtained and fused with the postoperative MR imaging to accurately delineate the radiation target.11 The planning CT also provides fundamental information about the isodose curves, which can be defined as lines joining the points that receive the same percentage of radiation dose. As seen in Fig 3, those lines can be plotted in an isodose chart, which allows precise visualization of the radiation dose that a given region of the brain received. The isodose curves vary according to numerous factors, including field size, beam energy, depth in the patient, distance from the beam source, and external attenuators.12 Although the isodose charts are not readily available in many centers, we strongly encourage radiologists to have access to and review them when reading posttreatment imaging to correctly assess the relation between any developing lesion and the high-dose region, as exemplified in Fig 3B.

Delineation of the radiation therapy target for the treatment of a gross totally resected GBM in the right temporal lobe and its relation to tumor recurrence. A, Fused planning CT and axial contrast-enhanced T1-weighted postoperative image allow visualization of the radiation dose effectively delivered in the brain parenchyma adjacent to the surgical cavity (isodose chart). The high-dose region is defined as the area inside the pink line, corresponding to the 100% isodose line (60 Gy) plus the area between the pink and green lines, corresponding to the 80% isodose line (48 Gy). B, Fused planning CT and axial contrast-enhanced T1-weighted follow-up images demonstrate that a significant portion of the new enhancing lesion was located outside the high-dose radiation field (inside the green line), which is consistent with progressive disease.
Significance of T2/FLAIR Hyperintense Lesions.
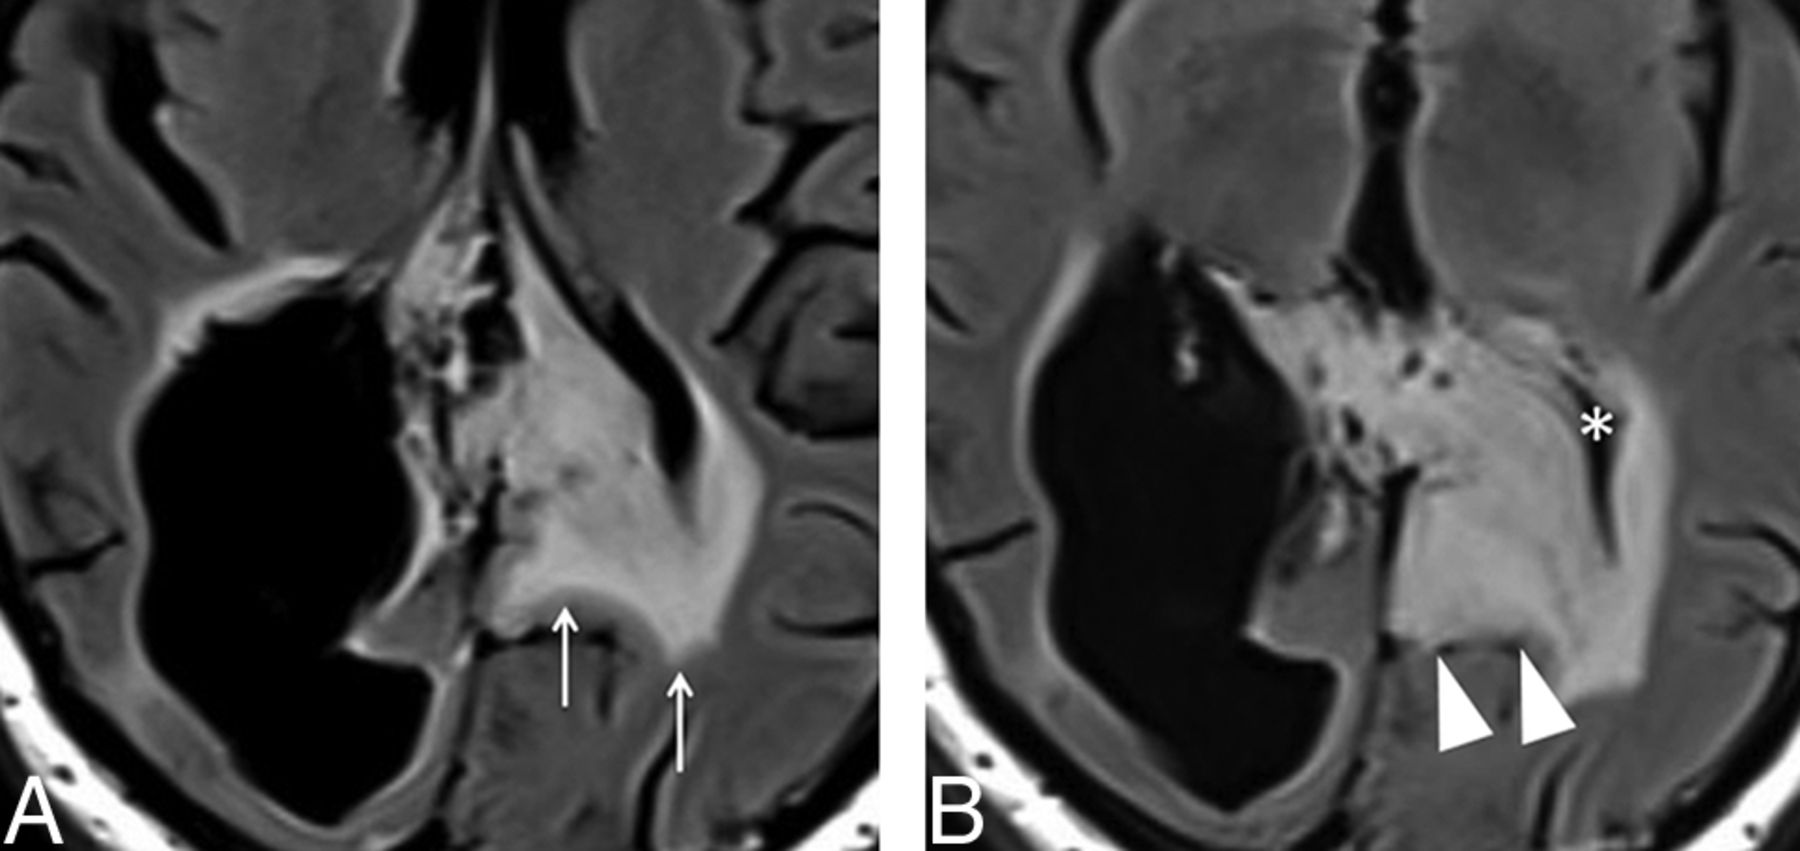
From the radiologic-pathologic correlation, it is well-established that the T2/FLAIR hyperintensity surrounding an enhancing tumor comprises not only vasogenic edema but also neoplastic infiltration. After an operation, radiation therapy, and temozolomide, these principles became less clear because of therapy-related inflammatory changes also present as T2/FLAIR hyperintensity. The more distinctive features of neoplastic infiltration are loss of gray matter–white matter differentiation and increased mass effect,13 as seen in Fig 4. These are in contrast to inflammatory and therapy-related changes, which typically spare the brain cortex. When in doubt about the presence of blurring of the gray-white junction, it is crucial to pay close attention to T2-weighted images because those findings may be subtle and the gray-white junction is better depicted on this sequence rather than on FLAIR.

Imaging features of the nonenhacing component of glial tumors. A 36-year-old man underwent partial resection and adjuvant radiation therapy of an extensive diffuse astrocytoma (World Health Organization, grade II) involving both parietal lobes (not shown). A, Axial FLAIR image obtained 5 years after completion of radiation therapy demonstrates extensive hyperintensity crossing the midline through the splenium of the corpus callosum (arrows), probably representing a mixture of lower-grade tumor and radiation injury. B, Axial FLAIR image obtained 8 months later depicts blurring of the gray-white matter in the left parietal lobe (arrowheads), as well as effacement of the left lateral ventricle (asterisk), which is consistent with neoplastic infiltration (progressive disease).
Timing for Evaluation after Radiation Therapy.
The time elapsed between the completion of the radiation therapy and the imaging acquisition should also be taken into account when interpreting posttreatment imaging. According to the RANO criteria, in the first 12 weeks after completion of chemoradiation, progressive disease can only be radiologically defined if there is new enhancement outside the radiation field (beyond the high-dose region or 80% isodose line)10 because of the high incidence of therapy-related changes in this period. If the area of new or increased enhancement occurs inside the radiation field, unequivocal evidence of viable tumor is required on histopathologic sampling.10
Defining Progressive Disease on Histologic Specimens.
The diagnosis of tumor recurrence may be challenging despite histopathologic analysis due to the absence of standardized pathologic criteria. A recent report with 48 pathologists working at 30 cancer centers showed only marginal reproducibility when they were asked to provide a final diagnosis (active tumor, treatment effect, or unable to classify) in histologic sections from patients with glioblastoma who underwent diagnostic surgery for suspected early recurrence. In this study, the κ coefficient was 0.228 (95% CI, 0.22–0.24), and the maximum agreement on the final diagnosis ranged from 36% to 68%.14 Such marginal reproducibility may be an explanation for the variable correlation between the pathologic diagnosis of tumor recurrence and patients’ survival.15 These findings also impact the analysis of diagnostic accuracy of imaging because histopathology is the current criterion standard for diagnosing tumor recurrence. Further studies assessing radiologic-pathologic correlation and its relation to patient survival could be valuable for defining better pathologic criteria.
Pseudoprogression
The RANO criteria define pseudoprogression as new or increasing contrast enhancement that eventually subsides without any change in therapy,10 as depicted in Fig 5. Using a broader definition in which stability of the enhancing lesion on follow-up images also represents pseudoprogression, a recent meta-analysis including 2603 patients with high-grade gliomas reported an incidence of pseudoprogression of around 36%.16 Of note, it can also occur in patients with lower-grade gliomas, with a reported incidence of 20%.17

Pseudoprogression in a 56-year-old man who underwent chemoradiation after gross total resection of a GBM in the left parietal lobe. A, Axial contrast-enhanced T1-weighted image obtained 1 week after an operation shows thin ring enhancement in the surgical bed (asterisk), which was considered to represent granulation tissue, related to the operation. The study was not obtained within the first 48 hours due to hemodynamic instability of the patient. B, Soon after completion of radiation therapy, the patient developed marked enhancement in the margins of the surgical cavity (arrow), with effacement of the adjacent sulci. In the following 3 months, he presented with progressive altered mental status and right-side hemiparesis. C, At that time, axial contrast-enhanced T1-weighted imaging showed an increase in mass effect, midline shift, with a slight increase in enhancement extension, which turned to a soap bubble appearance (arrowhead), a pattern typically associated with radiation necrosis. D, The patient improved clinically, and after 4 months, a new image depicted fading of the enhancing lesion (curved arrow) and a marked decrease in mass effect, which is the classic course of pseudoprogression.
Pseudoprogression likely results from transiently increased permeability of the tumor vasculature and inflammation induced by radiation therapy, which may be exacerbated by temozolomide. Histologic analysis of such lesions usually discloses features related to treatment effects like reactive gliosis and vascular hyalinization as well as foci of neoplastic cells.18 Progressive clinical signs and symptoms may accompany pseudoprogression (eg, altered mental status, hemiparesis),19 and it seems to be more frequent in patients with a methylated O6-methylguanine–DNA methyltransferase gene promoter, which is a marker of good prognosis.20 Although the definitive diagnosis of pseudoprogression is retrospective, because it requires demonstration of decreased contrast enhancement in imaging follow-up, this pseudoprogression is conceivable if the lesion developed within the first 3–6 months after radiation therapy, if it is in the radiation field (inside the 80% isodose line), and especially if it presents as a pattern of enhancement related to radiation-induced necrosis, ie, “Swiss cheese” or “soap bubble” enhancement (Fig 5C).21
At this point, the term “pseudoprogression” is reserved for patients with gliomas who underwent chemoradiation, while radiation-induced necrosis, a frequently confused term, describes a focal lesion in the brain that may occur secondary to any technique of radiation therapy. Although both may share similar imaging presentations, pseudoprogression occurs predominantly within the first 6 months after chemoradiation completion, while radiation necrosis tends to occur later in the course, usually 1 year after radiation, and is not likely to subside. Furthermore, in histologic analysis, radiation-induced necrosis shows permanent damage to the brain parenchyma, with extensive necrotic areas, vascular thrombosis, and fibrinoid necrosis.
The RANO Working Group also published guidelines addressing the evaluation of response in patients with glial tumors who underwent immunotherapy treatments: the Immunotherapy Response Assessment for Neuro-Oncology. Because boosting the immune response can also lead to development or increase in the extension of the enhancing lesion per se, according to the Immunotherapy Response Assessment for Neuro-Oncology, if the lesion developed within ≤6 months after starting immunotherapy and the patient has no new or substantially worsened neurologic deficits, disease progression requires confirmation on follow-up imaging, 3 months after initial radiographic progression.22
Misdiagnosing progressive disease instead of pseudoprogression may have harmful consequences for the patient because it would eventually lead to discontinuation of a treatment that is working and/or an unnecessary operation. It also has significant implications in selecting appropriate patients for participation in clinical trials for recurrent gliomas because failure to exclude patients with pseudoprogression from these studies would result in an artificially higher response rate.
Pseudoresponse
Antiangiogenic agents, like bevacizumab, are designed to block the VEGF effect, which is overexpressed in high-grade glial tumors.23 The mechanism of action may be related to decreased blood supply to the tumor and normalization of tumor vessels, which display increased permeability.23 These agents are associated with high radiologic responses if we evaluate only the contrast enhancement. However, the infiltrative nonenhancing tumoral component does not seem to be affected and eventually increases in the follow-up imaging, as depicted in Fig 6, which characterizes the pseudoresponse. This increase may be an explanation for the poor survival benefits in trials with antiangiogenic agents.

Pseudoresponse in a 36-year-old woman with a partially resected GBM in the right temporal lobe and insula. Axial contrast-enhanced T1- weighted (A) and FLAIR (B) images obtained in the immediate postoperative period show an extensive hyperintense FLAIR lesion (arrows) with multiple foci of contrast enhancement (arrowheads). C, An anti-VEGF agent was administered, and a follow-up axial contrast-enhanced T1-weighted image depicts a striking decrease of the enhancing component (arrowhead). D, However, there is also an increase of the nonenhancing infiltrative component, manifested as FLAIR hyperintensity in the right frontotemporal region and insula, with an expansive effect, blurring, and loss of the cortical-subcortical differentiation (arrows).
RANO Criteria for Lower-Grade Gliomas
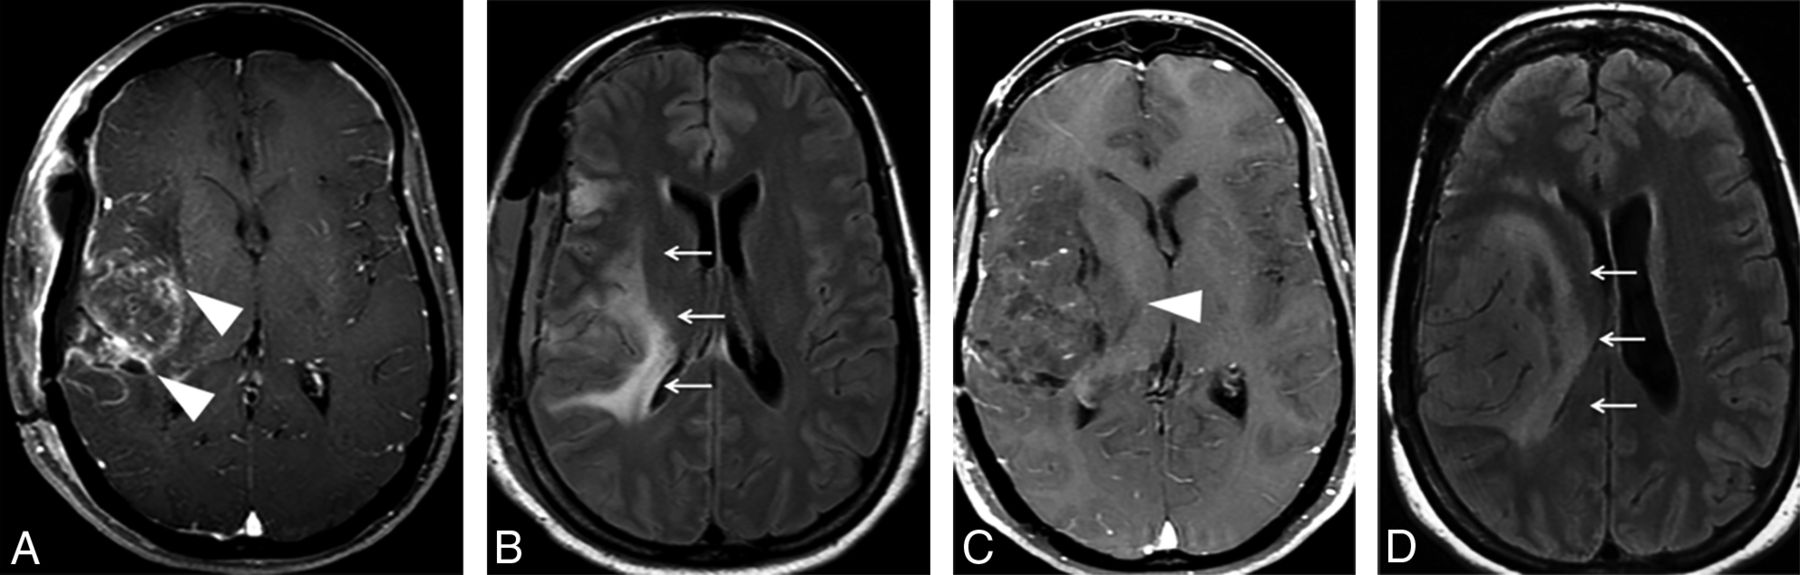
Lower-grade gliomas (ie, diffuse astrocytoma, oligodendroglioma, and anaplastic gliomas) tend to have an indolent clinical course, but their natural history usually demonstrates transformation to high-grade glioma in most patients. The measurement of tumor burden or response to therapy relies mainly on changes in T2-weighted and FLAIR images because most lower-grade gliomas do not demonstrate contrast enhancement. The radiologic assessment is further complicated by radiation therapy–induced local white matter changes, which also present as increasing areas of abnormal signal intensity on T2-weighted or FLAIR images. The typical findings for progressive lower-grade glioma are increased T2 or FLAIR nonenhancing lesions and development of contrast enhancement, indicating malignant transformation, as seen in Fig 7.24

A progressive low-grade glioma in a 33-year-old man previously diagnosed with Li-Fraumeni syndrome. Initial axial FLAIR (A) and contrast-enhanced T1-weighted (B) images showed subtle cortical-subcortical FLAIR hyperintensity in the left inferior parietal lobule, with minimal expansive effect and no postcontrast enhancement, which was presumably considered to be a low-grade glial tumor (arrowhead). Two years later, axial FLAIR (C) and contrast-enhanced T1-weighted (D) images depict a marked increase in the expansive effect, with loss of gray-white matter differentiation and heterogeneous enhancement (arrowhead). Those findings are consistent with malignant transformation of a lower-grade glioma (progressive disease).
Role of Advanced Imaging Techniques
As we have demonstrated, an operation, radiation, and chemotherapy can lead to contrast-enhanced lesions and surrounding edema (hyperintense T2/FLAIR), similar to what is observed in cases of glioma progression. Most of the newly occurring lesions do not consist of only large areas of pure tumor or treatment-related changes; instead, they usually represent a mixture of both. Hence, our goal was to identify the predominant cause for the lesion, which allows the establishment of the prognosis and the best treatment for the patient.
Although not included in RANO criteria, advanced techniques such as perfusion MR imaging, MR spectroscopy, diffusion-weighted imaging, and amino acid PET/CT can provide valuable information for differentiating glioma recurrence and pseudoprogression.
Perfusion MR Imaging.
Perfusion techniques are based on the fact that malignant gliomas have a compromised blood-brain barrier and increased angiogenesis, which will eventually affect tissue perfusion and/or vessel permeability.
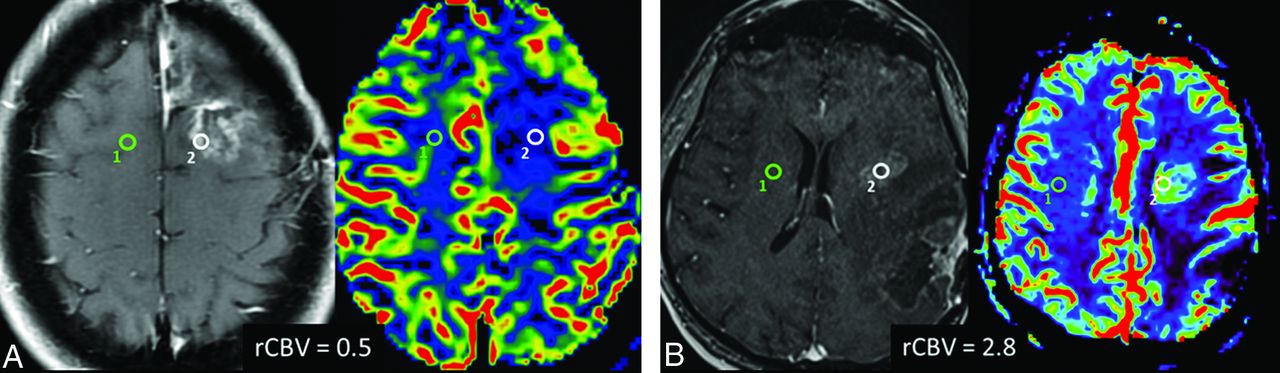
DSC T2*-weighted perfusion is based on tracking the passage of a contrast agent through the brain, which decreases the T2*-weighted signal, creating a susceptibility gradient between the tissue and the vasculature as a function of relative cerebral blood volume (rCBV). The analyzed ROIs within the brain should be small, adjusted as necessary to target the areas with the visually highest rCBV (on rCBV maps) and to avoid vessels or areas of magnetic susceptibility artifacts, especially blood, one of the major limitations of DSC. Another rCBV ROI is then obtained in the normal contralateral white matter as a reference, producing a ratio between lesion rCBV and normal white matter rCBV. High rCBV ratios are associated with tumor recurrence, whereas lower rCBV ratios usually represent therapy-related changes (ie, chemoradiation effects), as exemplified by Fig 8. Determining the optimal cutoff to confidently diagnose progressive disease (a high proportion of tumor in the lesion) may be troublesome because thresholds vary significantly among the studies, with reported rCBV cutoff ratios ranging from 1.8 to 2.6.25⇓⇓⇓-29 This issue was addressed by a recent meta-analysis of 28 studies that could not find clinically meaningful pooled PWI thresholds to reliably distinguish tumor from treatment effect.30 As sources of heterogeneity, the authors listed variability in the postprocessing software, use of contrast preloading, the method of selection of ROIs (size, number, and location), and the evaluated DSC parameter (mean, maximum, or histogram-derived percentile).

DSC perfusion in pseudoprogression and progressive disease. A, Axial contrast-enhanced T1-weighted and the corresponding rCBV map images show an enhancing lesion that developed after radiation therapy and temozolomide in a 46-year-old patient with multicentric GBM. The DSC perfusion of the enhancing lesion in the surgical bed (white ROI) shows decreased rCBV (0.5) in comparison with normal contralateral white matter (green ROI), which is consistent with predominance of radiation injury within the lesion (pseudoprogression). B, Axial contrast-enhanced T1-weighted and corresponding rCBV map images in a 60-year-old patient with a previously resected GBM show an enhancing lesion (white ROI) close to the margin of the radiation field. The DSC perfusion of the enhancing lesion in the surgical bed shows increased rCBV (2.8) in comparison with normal contralateral white matter (green ROI), indicating predominance of malignant cells within the lesion (progressive disease).
Dynamic contrast-enhanced (DCE) T1-weighted perfusion, also known as permeability, estimates the rate of extravasation of contrast agent from the intravascular space into the extravascular extracellular space, plotted as a permeability curve. The greatest advantage of DCE perfusion over DSC is that it is less susceptible to magnetic artifacts because it is a T1-weighted imaging. However, in contrast to DSC perfusion, DCE requires disruption of the blood-brain barrier to analyze the intravascular-to-extravascular contrast flow, which makes this tool unsuitable to assess T2/FLAIR hyperintense nonenhancing lesions. As depicted by Fig 9, in the recurrent tumor, DCE perfusion demonstrates a very rapid initial increase in the vascular permeability curve, which is typical for a highly vascular and permeable tumor.31 In radiation-induced injury, the rate of enhancement is typically slow, as a result of radiation-induced occlusive vasculopathy. To obtain the permeability curve, the ROI should be set in the lesion, as well as in a vessel and the normal white matter for comparison. The numeric representation of those differences can be calculated through the time-dependent leakage constant (Ktrans), which represents the volume transfer coefficient between blood plasma and extravascular extracellular space. Although Ktrans was demonstrated to be higher in true progressive disease in comparison with pseudoprogression,32,33 there is no established consensus about the exact cutoff, given the relatively fewer studies using DCE and, similar to DSC, the heterogeneity of techniques and postprocessing methods.

DCE perfusion in pseudoprogression and progressive disease. A, Axial contrast-enhanced T1-weighted image and the corresponding permeability curve show an enhancing lesion that developed after radiation therapy and temozolomide in a 46-year-old patient with multicentric GBM (same patient as presented previously). The DCE perfusion of the temporal lesion (green ROI, 4) shows slowly progressive accumulation of gadolinium in the extravascular space, as shown in the graphic (green curve, 4), which is consistent with predominance of radiation injury within the lesion (pseudoprogression). The ROIs in the vessel (purple ROI, 5) and in normal white matter (purple ROI, 6) are obtained for comparison. B, Axial contrast-enhanced T1-weighted imaging and the corresponding permeability curve show an enhancing lesion in a 65-year-old patient with a previously resected GBM, who developed an enhancing lesion in the surgical bed (green ROI, 5) after radiation therapy and temozolomide. DCE perfusion shows a fast ascension curve, which implies a highly vascular lesion (green curve, 5), indicating predominance of malignant cells within the lesion (progressive disease).
Arterial spin-labeling is another MR perfusion technique that can be useful in distinguishing early tumor progression from pseudoprogression, as seen in a study that reported that adjunctive arterial spin-labeling produced more accurate results than DSC perfusion MR imaging alone.34 Arterial spin-labeling can quantitatively measure CBF using arterial water as a freely diffusible tracer,35 instead of gadolinium.
MR Spectroscopy.
MR spectroscopy evaluates the concentration of brain metabolites according to their precession frequency, which is influenced by the magnetic field generated by the number of hydrogen protons within a molecule.
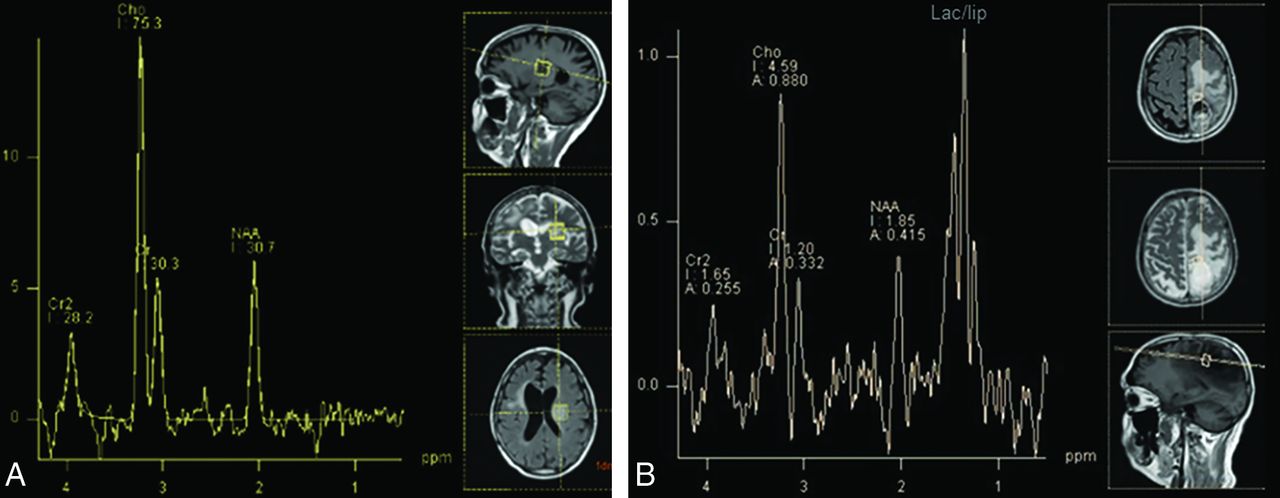
As demonstrated by Fig 10, the major metabolites evaluated in differentiation of tumor recurrence and disease progression are choline, a membrane component and marker of increased cell proliferation, especially in tumors, and, to a lesser extent, in inflammation; and NAA, a marker of density and viability of neurons, which are decreased in both tumor and radiation injury. Although some studies reported promising findings with the use of the choline/NAA ratio, the result of a meta-analysis comprising a total sample size of 455 patients recommended against using spectroscopy alone to differentiate progressive disease from pseudoprogression.36 A debate exists about the optimal cutoff for the choline/NAA ratio; however, a reasonable point may be 2.2. The major concern about spectroscopy is the lack of standardization of imaging acquisition among studies (eg, 1.5T × 3T, short TE × long TE, single-voxel × multivoxel), which may eventually affect their external validity. Spectroscopy may also be technically difficult while evaluating lesions located in the periphery of the brain hemispheres close to the calvaria or lesions with superimposed hemorrhagic foci because bone lipids and hemosiderin may cause severe artifacts in spectroscopic sequences.

Characteristic findings of progressive disease and pseudoprogression on MR spectroscopy. A, A 54-year-old man presented with a ring-enhancing lesion in the left insula (not shown) distant from the radiation field after treatment of a right frontal lobe GBM. MR imaging spectroscopy shows marked elevation of the choline/NAA ratio (2.5), indicating high cellular turnover and diminished neuronal viability, typical for a malignant tumor and indicating progressive disease. B, A previously presented case of a 56-year-old man with pseudoprogression after treatment of a GBM in the left parietal lobe (Fig 5). MR imaging spectroscopy also shows elevation of choline/NAA ratio, but only slightly lower than that in the previous case (2.2 versus 2.5), which exemplifies the findings overlap between pseudoprogression and progressive disease on spectroscopy. The lipid/lactate peak is markedly elevated in patients with pseudoprogression but is also commonly present in GBM recurrence.
DWI.
DWI depicts changes in water movement through different tissues, according to the cell count, cell density over the extracellular matrix, and the nucleus-cytoplasm ratio. If these factors increase in a given tissue, the ability of water to move becomes more restricted. Hence, the high cellularity and high nucleus-cytoplasm ratio observed in malignant tumors are associated with decreased water diffusion, which can be quantitatively represented as low ADCs—ie, ADC is inversely associated with tumor predominance within the lesion (progressive disease), while higher ADCs are noted in lesions with predominance of radiation injury, as shown in Fig 11. In DWI, most of the overlap between tumor recurrence and pseudoprogression relies on the intrinsic heterogeneity of GBM, with regions of high cellularity admixed with areas of necrosis, edema, and microhemorrhage. These findings can also be seen in radiation-induced injury, which complicates the overall comparison.

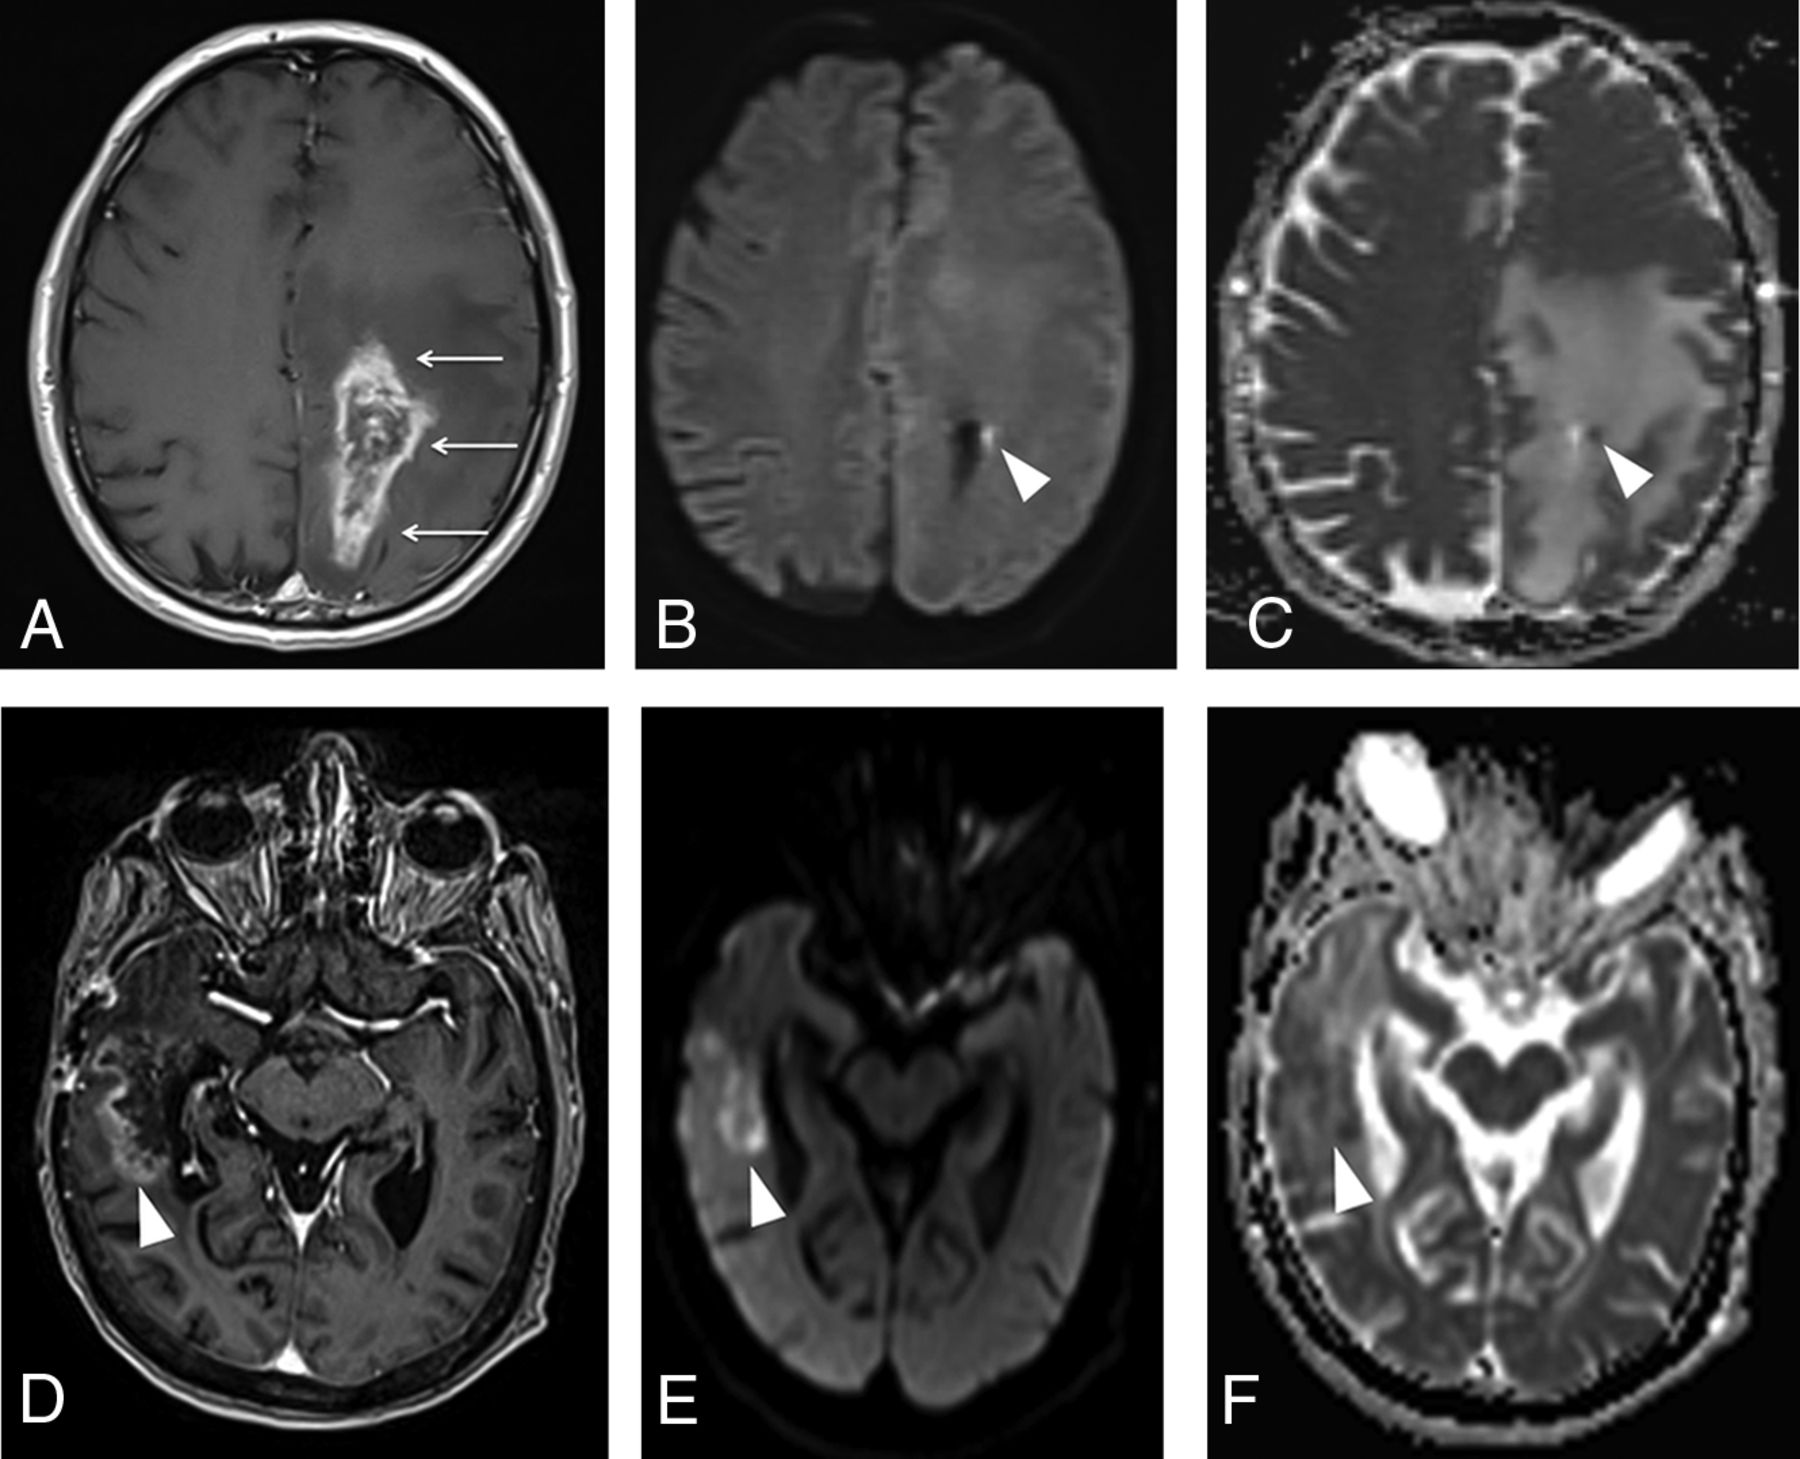
Typical features of pseudoprogression and progressive disease on diffusion-weighted imaging. A, Axial contrast-enhanced T1-weighted image from a previously presented case of a patient with pseudoprogression (Fig 5) after treatment of a GBM in the left parietal lobe shows an enhancing lesion with irregular margins in the surgical bed (arrows). Despite an axial DWI (B) and ADC map (C) showing a punctate focus of restricted diffusion in the lesion (arrowhead), with ADC = 0.9 × 10⁻⁶ mm2/s, most of the enhancing lesion has no corresponding restricted diffusion, exhibiting ADC levels around 1.5–1.7 × 10⁻⁶ mm2/s, which is consistent with radiation injury. D, Axial contrast enhanced T1-weighted image shows a heterogeneously enhancing lesion in the right temporal lobe (arrowhead) in a patient with a resected GBM. Axial DWI (E) and an ADC map (F) show moderately restricted diffusion, with ADC values ranging from 1.0–1.1 × 10⁻⁶ mm2/s, consistent with predominance of malignant cells within the lesion (progressive disease). The ADC measurements were obtained by drawing a circular ROI in the visually lowest ADC areas on the ADC map.
Although the method to calculate ADC is controversial, it can be performed manually or through specific automated software with additional histogram analysis37; the proposed ADC cutoff of most studies to differentiate progressive disease from pseudoprogression is about 1.3 × 10⁻³ mm2/s.38,39
Some patients undergoing bevacizumab therapy can develop lesions with markedly high restricted diffusion (ADC levels under 0.7 × 10⁻³ mm2/s) within a few weeks to several months after drug initiation. These lesions usually appear near the ventricles and the corpus callosum,40 as seen in Fig 12, and were demonstrated to be related to tissue ischemia and coagulative necrosis surrounded by a viable hypercellular tumor, instead of pure tumoral burden.41 Most important, if the areas of restricted diffusion remain stable for >3 months, they are associated with greater overall survival in comparison with the patients with no diffusion restriction and those with progressively growing restricted diffusion lesions.40,41

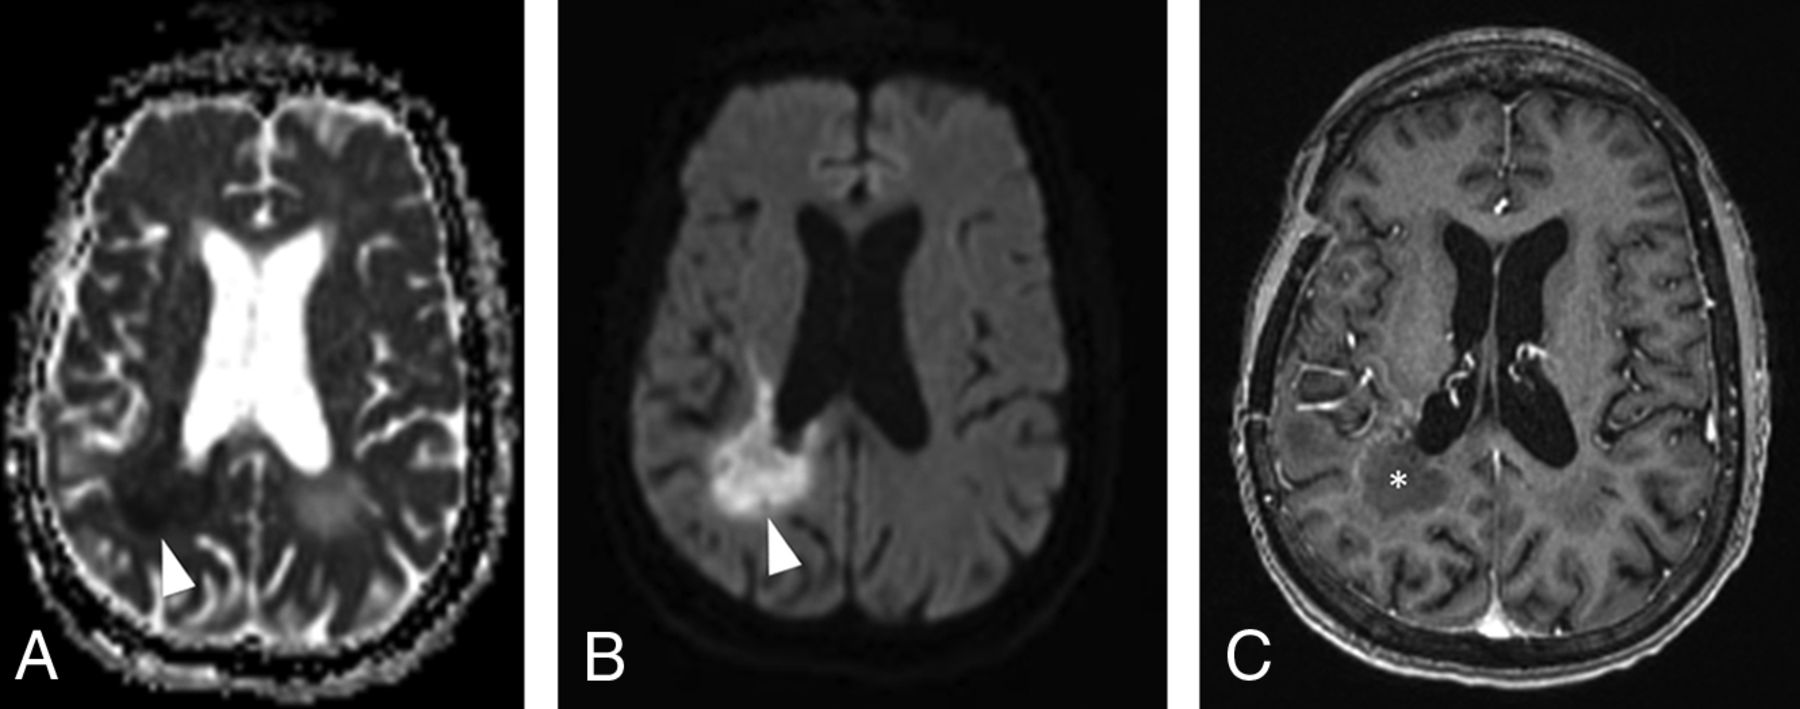
DWI changes after anti-VEGF agent administration in patients with GBM. Axial DWI (A) and an ADC map (B) show markedly restricted diffusion (lowest ADC = 0.5 × 10⁻⁶ mm2/s) in the right periventricular white matter (arrowheads), soon after bevacizumab was started in a patient with recurrent GBM. C, Axial contrast-enhanced T1-weighted image shows only thin rim enhancement in the area of restricted diffusion (asterisk). Those findings most likely represent ischemic changes within the tumor and should not be confused with progressive disease. The ADC measurements were obtained by drawing a circular ROI in the visually lowest ADC areas on the ADC map.
Amino Acid PET.
In 2019, neuro-oncology and nuclear medicine medical associations published practice guidelines and recommendations addressing the application of PET in the management of gliomas, from initial diagnosis to therapy monitoring.42 Glucose analog FDG-PET has shown only modest performance to diagnose tumor recurrence, mainly due to the intense intrinsic uptake of normal brain cortex, as well as hypermetabolism observed in inflammatory and therapy-related changes.43 On the other hand, radiolabeled amino acids were reported to show promising results in glioma PET imaging, as demonstrated by numerous reviews and meta-analyses, especially 11C-methionine (MET), [18F] fluoroethyl tyrosine, and [18F] dihydroxyphenylalanine.43⇓⇓-46 Their use is based on the increased amino acid use in glial tumors in the process of cell proliferation, in comparison with normal brain parenchyma and inflammatory conditions.
Similar to what we noticed in the perfusion MR imaging studies, there are several possible parameters to analyze, such as maximum standard uptake value, mean standard uptake value, mean tumor-to-background ratio, maximum tumor-to-background ratio, and the time-activity curve, leading to substantial heterogeneity among the studies, which, in turn, leads to difficulties in establishing optimal thresholds to detect tumor recurrence. Another major limitation to routine clinical use of those radiotracers is their reduced availability—eg, MET-PET requires an on-site cyclotron and the ability to produce and perform 11C radiochemistry, which has a half-life of 20 minutes.44
CONCLUSIONS
The evaluation of treatment response is especially challenging in neuro-oncology because an operation, radiation, and chemotherapy can lead to the development of contrast-enhanced and T2/FLAIR hyperintense lesions that mimic glioma progression. Because many of the new lesions represent a mixture of tumor cells and tissue with radiation injury, the radiologist aims to identify the predominant component of the lesion and categorize the findings according to the RANO criteria so that the patient can receive the best treatment. The advanced techniques can be extremely helpful, though standardization of the methods used for calculation of rCBV, ADC, spectroscopy peaks, and PET parameters is needed to optimize the evaluation of such patients and accurately compare the data from multicentric studies.
Footnotes
Disclosures: Bruno Policeni—UNRELATED: Expert Testimony: law firms, Comments: expert witness to review legal material, no deposition*; Payment for Lectures Including Service on Speakers Bureaus: University of Kansas, Comments: visiting professor. *Money paid to the institution.
Indicates open access to non-subscribers at www.ajnr.org
References
- Received August 7, 2019.
- Accepted after revision October 29, 2019.
- © 2020 by American Journal of Neuroradiology


Jump to section
Related Articles
Cited By...
- Randomized, open-label, phase 2 study of nivolumab plus ipilimumab or nivolumab monotherapy in patients with advanced or metastatic solid tumors of high tumor mutational burden
- Phase 2 Study of Sorafenib, Valproic Acid, and Sildenafil in the Treatment of Recurrent High-Grade Glioma
- Application of 7T MRS to High-Grade Gliomas