
Article Figures & Data
Figures
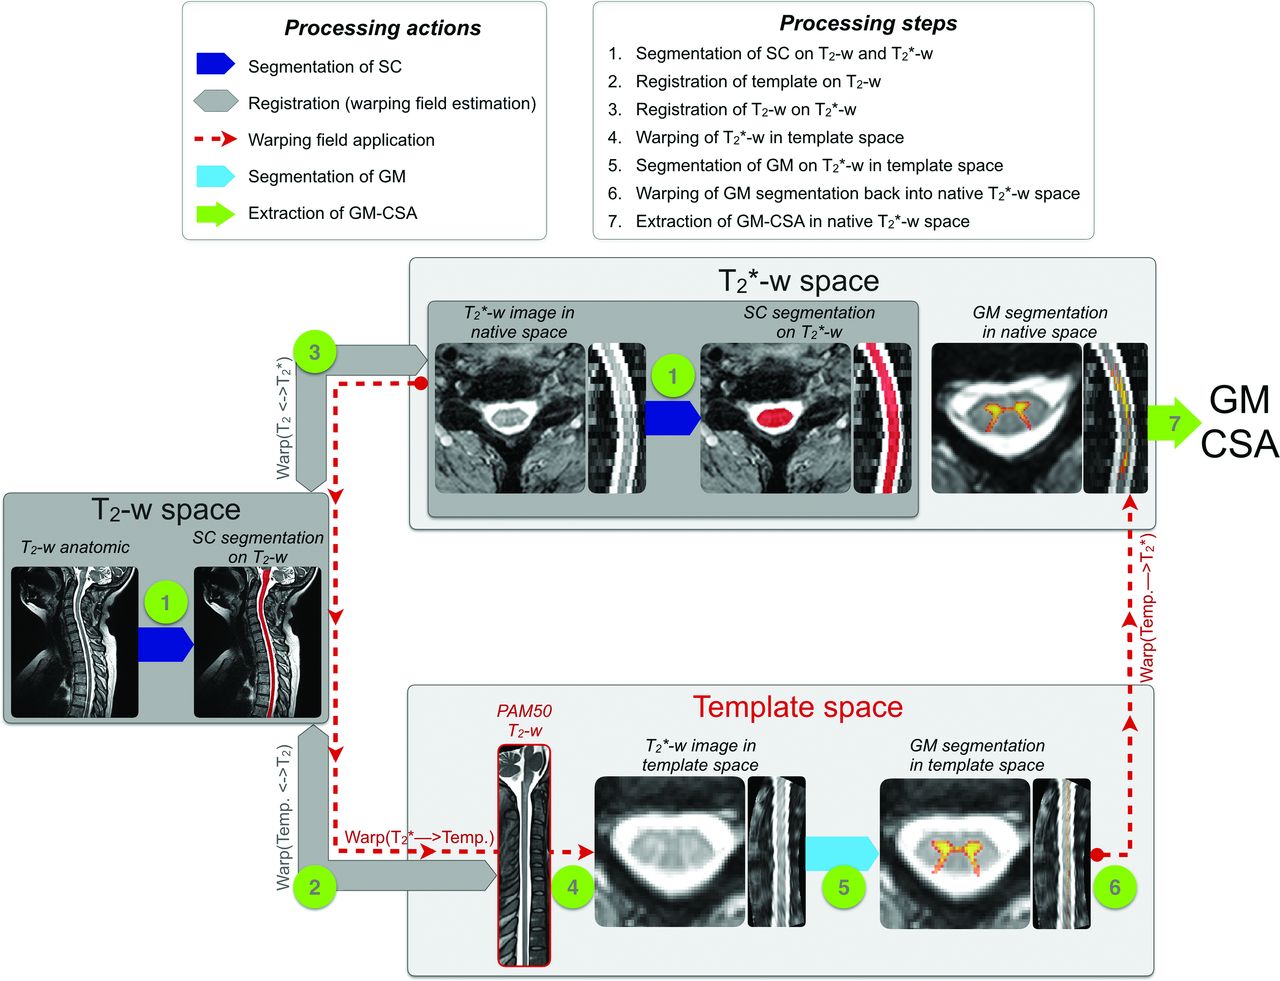
- Fig 1.
Processing pipeline for the GM segmentation and computation of the GMCSA.
- Fig 2.
GM automatic segmentation and manual delineation patients with ALS. Manual delineation of the GM is displayed with the blue line, automatic probabilistic segmentation is shown in red-to-yellow. Dice coefficient comparing the automatic and manual segmentation is shown on the bottom line.
- Fig 3.
GMCSA and SCCSA measured on controls and patients with ALS between the C6–C3 vertebral levels. GMCSA (A) and SCCSA (B) averaged within group and plot against the cervical SC axis. Overall, a stronger intergroup difference can be observed for GMCSA. Asterisk (P ≤ .05) and double asterisk (P ≤ .01) at specific vertebral levels indicate significant differences between patients with ALS and controls according to Student t test P values representing control-to-patient differences in GMCSA and SCCSA for each cervical level between C6 and C3 and across levels.
- Fig 4.
Boxplot distribution of GMCSA (A) and SCCSA (B) averaged between the C4–C6 vertebral levels. Each dark point represents an individual value. The median is represented as a thick horizontal line and the interquartile range as a light rectangle. The horizontal bar at both extremities of the whiskers represent the 5th and 95th percentiles. The 2 patients presenting the SOD1 gene are identified in the plot.
- Fig 5.
Prediction error on the ALSFRS-R at 1 year, from a leave-one-out cross-validation with regression trees. Results are compared between the regression model including clinical predictors (left distribution plot), clinical predictors + SCCSA (middle distribution plot), and clinical predictors + GMCSA + WM/GMCSA (right distribution plot), where each point represents 1 iteration of the leave-one-out cross-validation. The best value is at 0.


Tables
Characteristics Controls Patients with ALS At Baseline 1-Year Follow-Up Subgroup Number 22 25 19 Sex 11 F/11 M 6 F/19 M 3 F/16 M Age at baseline, yr ± SD 50.9 ± 13.0 53.3 ± 10.1 52.8 ± 9.2 Note:—F indicates female; M, male.
Clinical Data Patients with ALS Baseline 1-Year Follow-Up Subgroup Body mass index at MRI (± SD) 23.7 ± 2.7 24.0 ± 2.7 Familial transmission 2 SOD1 mutated 1 SOD1 mutated Site of onset 1 bulbar; 18 upper; 6 lower 1 bulbar; 12 upper; 6 lower Delay from first symptom to diagnosis, mo ± SD 9.9 ± 5.6 10.7 ± 6.0 Note:—SOD1 indicates SuperOxide Dismutase 1 gene.
ALSFRS-R MMT At MRI Progression Rate at MRI Per Month At 1 Year after MRI At MRI Total score, mean ± SD (/maximum) 37.96 ± 6.06 (/48) 0.59 ± 0.45 36.79 ± 4.84 (/48) 114.46 ± 24.36 (/140) Arm subscore, mean ± SD (/maximum) 5.11 ± 2.20 (/8) 0.18 ± 0.14 5.74 ± 2.10 (/8) 53.71 ± 12.25 (/70) Note:—MMT indicates manual muscle testing.
↵a Clinical scores are presented both in total (top row) and for the upper limbs only (arm subscore, bottom row). Presented clinical scores are, from left to right: the revised ALSFRS-R at the time of MRI, ALSFRS-R progression rate at MRI, ALSFRS-R at 1 year after MRI, and MMT at MRI. The progression rate represents the decline of ALSFRS-R score per month between the first onset of symptoms and the MRI.
- Table 5:
Results of regression tree predictions to make prediction of total ALSFRS-R score at 1 year after MRI with several clinical and MRI predictorsa
Predictors Coefficient of Determination R2 (Best Value = 1.0) Mean Squared Error (Best Value = 0.0) Clinical predictors 0.54 41.87 Clinical predictors + SCCSA 0.72 25.39 Clinical predictors + GMCSA + WMCSA/GMCSA 0.74 23.77 Note:—WMCSA indicates white matter cross-sectional area.
↵a GMCSA, WMCSA, and SCCSA are averaged across the C4–C6 vertebral levels. Clinical predictors include age, body mass index, sex, site of onset, delay between first symptoms and diagnosis, total ALSFRS-R score at baseline, and total ALSFRS-R score progression rate at baseline.


Jump to section
Related Articles
Cited By...
- Improved Inter-Subject Alignment of the Lumbosacral Cord for Group-Level In Vivo Gray and White Matter Assessments: A Scan-Rescan MRI Study at 3T
- Reduced Spinal Cord Gray Matter in Patients with Fibromyalgia Using Opioids Long-term
- DeepRetroMoCo: Deep neural network-based Retrospective Motion Correction Algorithm for Spinal Cord functional MRI
- Spinal Cord Gray and White Matter Damage in Different Hereditary Spastic Paraplegia Subtypes
- What are the gray and white matter volumes of the human spinal cord?
- Automatic Spinal Cord Gray Matter Quantification: A Novel Approach