Advertisement

Main menu

  • Home
  • Content
    • Current Issue
    • Accepted Manuscripts
    • Article Preview
    • Past Issue Archive
    • Video Articles
    • AJNR Case Collection
    • Case of the Week Archive
    • Case of the Month Archive
    • Classic Case Archive
  • Special Collections
    • AJNR Awards
    • Low-Field MRI
    • Alzheimer Disease
    • ASNR Foundation Special Collection
    • Photon-Counting CT
    • View All
  • Multimedia
    • AJNR Podcasts
    • AJNR SCANtastic
    • Trainee Corner
    • MRI Safety Corner
    • Imaging Protocols
  • For Authors
    • Submit a Manuscript
    • Submit a Video Article
    • Submit an eLetter to the Editor/Response
    • Manuscript Submission Guidelines
    • Statistical Tips
    • Fast Publishing of Accepted Manuscripts
    • Graphical Abstract Preparation
    • Imaging Protocol Submission
    • Author Policies
  • About Us
    • About AJNR
    • Editorial Board
    • Editorial Board Alumni
  • More
    • Become a Reviewer/Academy of Reviewers
    • Subscribers
    • Permissions
    • Alerts
    • Feedback
    • Advertisers
    • ASNR Home

User menu

  • Alerts
  • Log in

Search

  • Advanced search
American Journal of Neuroradiology

American Journal of Neuroradiology

ASHNR American Society of Functional Neuroradiology ASHNR American Society of Pediatric Neuroradiology ASSR
  • Alerts
  • Log in

Advanced Search

  • Home
  • Content
    • Current Issue
    • Accepted Manuscripts
    • Article Preview
    • Past Issue Archive
    • Video Articles
    • AJNR Case Collection
    • Case of the Week Archive
    • Case of the Month Archive
    • Classic Case Archive
  • Special Collections
    • AJNR Awards
    • Low-Field MRI
    • Alzheimer Disease
    • ASNR Foundation Special Collection
    • Photon-Counting CT
    • View All
  • Multimedia
    • AJNR Podcasts
    • AJNR SCANtastic
    • Trainee Corner
    • MRI Safety Corner
    • Imaging Protocols
  • For Authors
    • Submit a Manuscript
    • Submit a Video Article
    • Submit an eLetter to the Editor/Response
    • Manuscript Submission Guidelines
    • Statistical Tips
    • Fast Publishing of Accepted Manuscripts
    • Graphical Abstract Preparation
    • Imaging Protocol Submission
    • Author Policies
  • About Us
    • About AJNR
    • Editorial Board
    • Editorial Board Alumni
  • More
    • Become a Reviewer/Academy of Reviewers
    • Subscribers
    • Permissions
    • Alerts
    • Feedback
    • Advertisers
    • ASNR Home
  • Follow AJNR on Twitter
  • Visit AJNR on Facebook
  • Follow AJNR on Instagram
  • Join AJNR on LinkedIn
  • RSS Feeds

AJNR Awards, New Junior Editors, and more. Read the latest AJNR updates

Research ArticleAdult Brain
Open Access

In Vivo 7T MR Quantitative Susceptibility Mapping Reveals Opposite Susceptibility Contrast between Cortical and White Matter Lesions in Multiple Sclerosis

W. Bian, E. Tranvinh, T. Tourdias, M. Han, T. Liu, Y. Wang, B. Rutt and M.M. Zeineh
American Journal of Neuroradiology October 2016, 37 (10) 1808-1815; DOI: https://doi.org/10.3174/ajnr.A4830
W. Bian
aFrom the Departments of Radiology (W.B., E.T., B.R., M.M.Z.)
  • Find this author on Google Scholar
  • Find this author on PubMed
  • Search for this author on this site
  • ORCID record for W. Bian
E. Tranvinh
aFrom the Departments of Radiology (W.B., E.T., B.R., M.M.Z.)
  • Find this author on Google Scholar
  • Find this author on PubMed
  • Search for this author on this site
  • ORCID record for E. Tranvinh
T. Tourdias
cService de NeuroImagerie Diagnostique et Thérapeutique (T.T.), Centre Hospitalier Universitaire de Bordeaux, Bordeaux Cedex, France
dInstitut National de la Santé et de la Recherche Médicale U 862 (T.T.), Université de Bordeaux, Bordeaux Cedex, France
  • Find this author on Google Scholar
  • Find this author on PubMed
  • Search for this author on this site
  • ORCID record for T. Tourdias
M. Han
bNeurology (M.H.), Stanford University School of Medicine, Palo Alto, California
  • Find this author on Google Scholar
  • Find this author on PubMed
  • Search for this author on this site
  • ORCID record for M. Han
T. Liu
eDepartment of Radiology (T.L., Y.W.), Weill Medical College of Cornell University, New York, New York.
  • Find this author on Google Scholar
  • Find this author on PubMed
  • Search for this author on this site
  • ORCID record for T. Liu
Y. Wang
eDepartment of Radiology (T.L., Y.W.), Weill Medical College of Cornell University, New York, New York.
  • Find this author on Google Scholar
  • Find this author on PubMed
  • Search for this author on this site
  • ORCID record for Y. Wang
B. Rutt
aFrom the Departments of Radiology (W.B., E.T., B.R., M.M.Z.)
  • Find this author on Google Scholar
  • Find this author on PubMed
  • Search for this author on this site
  • ORCID record for B. Rutt
M.M. Zeineh
aFrom the Departments of Radiology (W.B., E.T., B.R., M.M.Z.)
  • Find this author on Google Scholar
  • Find this author on PubMed
  • Search for this author on this site
  • ORCID record for M.M. Zeineh
  • Article
  • Figures & Data
  • Info & Metrics
  • Responses
  • References
  • PDF
Loading

Article Figures & Data

Figures

  • Tables
  • Fig 1.
    • Download figure
    • Open in new tab
    • Download powerpoint
    Fig 1.

    ROI definition. A whole section of magnitude (A) and QSM images (B) show 1 cortical lesion (red arrows) and 1 WM lesion (blue arrows). C, The ROIs of the cortical lesion and its adjacent normal-appearing cortical gray matter counterpart are delineated in red and green lines, respectively. D, The ROIs of the WM lesion and its adjacent normal-appearing white matter counterpart are delineated in blue and pink lines, respectively. ROIs were first defined on T2*-spoiled gradient-recalled images and then transferred to the other coregistered images. The gap between the lesion ROIs and the adjacent normal-appearing parenchyma reduces the partial volume effect in the segmentation. CSFnMPRAGE indicates CSF-nulled MPRAGE; WMnMPRAGE, WM-nulled MPRAGE.
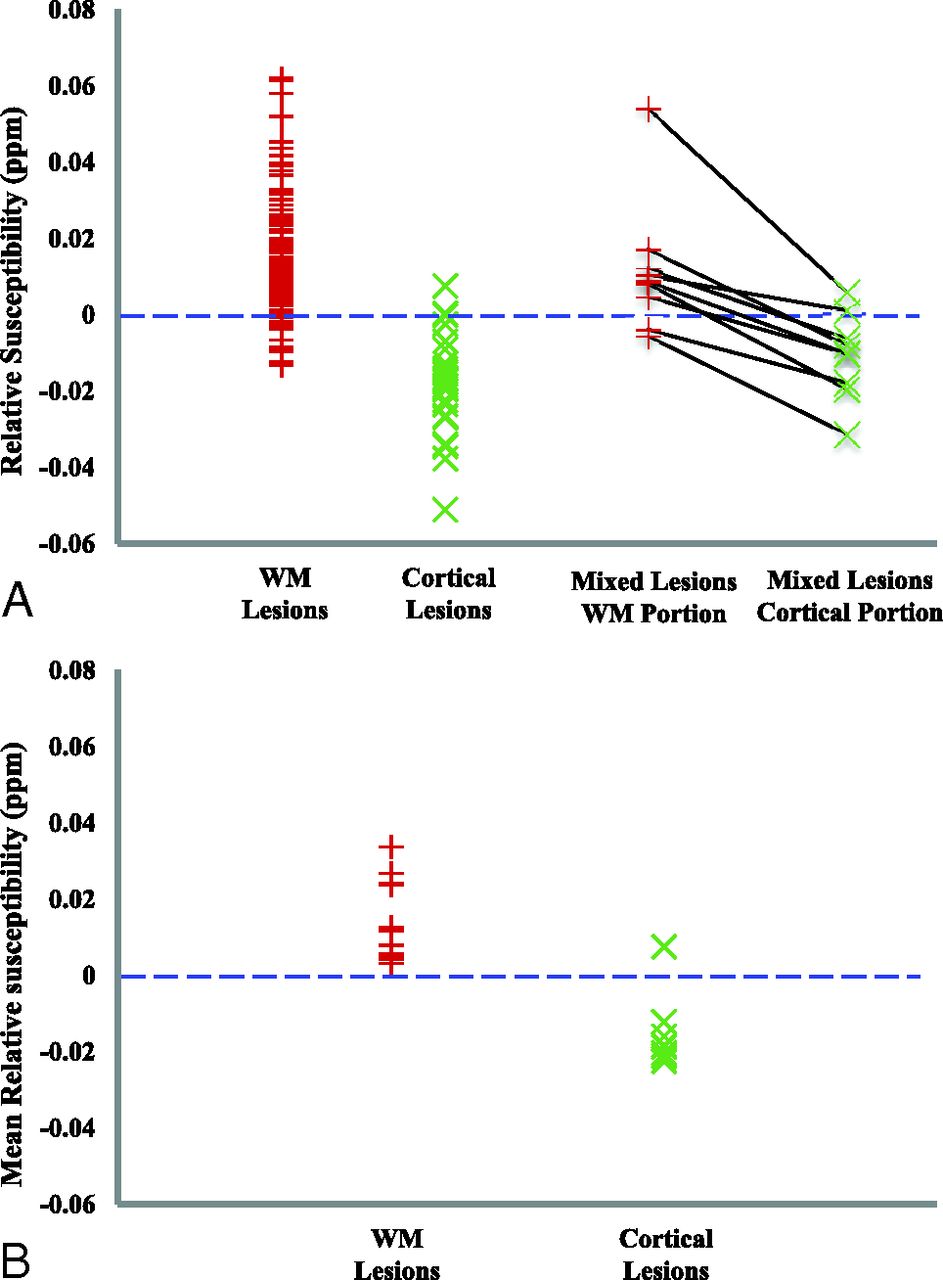
  • Fig 2.
    • Download figure
    • Open in new tab
    • Download powerpoint
    Fig 2.

    Relative susceptibility in MS lesions. A, The relative susceptibility in each individual lesion. Each black line on the right connects a pair of WM and cortical portions in a mixed lesion. B, The mean relative susceptibility after averaging the relative susceptibility across all lesions per type for each patient (13 patients had WM lesions, and 8 patients had cortical lesions).

  • Fig 3.
    • Download figure
    • Open in new tab
    • Download powerpoint
    Fig 3.

    MR images of representative WM and cortical lesions from patients 4 (A) and 5 (B). A whole section of the T2-MPFLAIR image is displayed on the left column with a zoomed-in region (blue/red square) for all image contrasts. Two WM lesions (blue arrows) and 3 cortical lesions (red arrows) are shown. WM and cortical lesions are hyper- and hypointense relative to their adjacent parenchyma on QSM images, respectively, while both types of lesions show an identical contrast on all other images. CSFnMPRAGE indicates CSF-nulled MPRAGE; WMnMPRAGE, WM-nulled MPRAGE.

  • Fig 4.
    • Download figure
    • Open in new tab
    • Download powerpoint
    Fig 4.

    MR images of the only cortical lesion from patient 2. The lesion had a positive relative susceptibility and demonstrated a hyperintense core surrounded by an asymmetric hyperintense rim, suggesting that the lesion may have iron at its edge. Please see the Fig 3 legend for image descriptions.

  • Fig 5.
    • Download figure
    • Open in new tab
    • Download powerpoint
    Fig 5.

    MR images of representative mixed lesions (yellow circles) from patients 1 (A) and 6 (B). The green dashed line divides a mixed lesion into its cortical (red arrow) and WM (blue arrow) components. A, The lesion has a QSM hypointense cortical portion and a hyperintense WM portion relative to adjacent normal-appearing GM and normal-appearing WM, respectively. B, The cortical component is hypointense compared with normal-appearing GM, while the white matter component is centrally isointense but peripherally slightly hyperintense compared with normal-appearing WM. Please see the Fig 3 legend for image descriptions.

Tables

  • Figures
    • View popup
    Table 1:

    Patient demographic/clinical data and lesion countsa

    SexAge (yr)Disease Duration (yr)Treatment TypeMinimum WM Lesion Age (mo)Cortical LesionWM LesionMixed Lesion
    Patient
        1F3711Copaxoneb12261
        2M4212Copaxone101110
        3F423Copaxone8020
        4F303Tysabric95231
        5F492Rebifd187131
        6M326Copaxone103304
        7M421Copaxone7150
        8F331Copaxone10040
        9F4415No Treatment6041
        10F311No Treatment30120
        11F4116Tysabri42151
        12F5825Copaxone6670
        13M378Copaxone130150
        14M486Copaxone5000
    Mean40.4 ± 7.97.9 ± 7.28.6 ± 4.01.9 ± 2.310.5 ± 8.40.64 ± 1.1
    Total271479
    • ↵a Patients 9 and 10 were not on any disease-modifying treatment at the time of their 7T scans. Patient 9 was on Tysabri, but it was stopped 6 months prior to her 7T scan. All patients had relapsing-remitting MS except patient 11, who was in a transitional stage between relapsing-remitting MS and secondary-progressive MS but was still being treated for relapsing-remitting MS. Patient 14 had lesions that all regressed before the 7T scan.

    • ↵b Glatiramer acetate injection.

    • ↵c Natalizumab.

    • ↵d Interferon β-1a.

    • View popup
    Table 2:

    Parameters for MR imaging sequencesa

    ParametersT2* SPGRT1 WM-Nulled MPRAGET1 CSF-Nulled MPRAGET2 MPFLAIR
    Acquisition2D axial3D coronal3D coronal3D coronal
    TR1200 ms8.3 ms3.9 ms8000 ms
    TE17.7 ms3.7 ms8.5 ms109.8 ms
    TINA680 ms1200 ms2135 ms
    Flip angle60°4°6°90°
    Bandwidth19.2 kHz15.6 kHz19.2 kHz62.5 kHz
    FOV180180180180
    Matrix384 × 384180 × 180224 × 224224 × 224
    No. of sections90256256256
    Resolution0.47 × 0.47 × 1 mm31 × 1 × 1 mm30.8 × 0.8 × 0.8 mm30.8 × 0.8 × 0.8 mm3
    Acceleration factorASSET 2ARC 1.5 × 1.5ASSET 2.5ARC 2 × 2
    Acquisition time (min:s)6:395:546:205:48
    • Note:—ASSET indicates array spatial sensitivity encoding technique; SPGR, spoiled gradient-recalled; ARC, Autocalibrating Reconstruction for Cartesian; NA, not applicable.

    • ↵a Two patients had a slightly different resolution for T2* SPGR. One (patient 4 in Table 1) had a resolution of 0.47 × 0.47 × 1.2 mm3 and the other (patient 11 in Table 1) had a resolution of 0.47 × 0.47 × 1.1 mm3.

    • View popup
    Table 3:

    Mean lesion susceptibility relative to normal-appearing parenchymaa

    WM LesionsCortical LesionsMixed Lesions
    WM PortionCortical Portion
    Relative susceptibility (ppm) (per lesion type)0.014 ± 0.014−0.018 ± 0.0130.014 ± 0.018−0.009 ± 0.012
    t testP < 10−22P < 10−7P < .043P < .054
    Relative susceptibility (ppm) (per lesion type per subject)0.014 ± 0.010−0.015 ± 0.009––
    t testP < .0004P < .004––
    • ↵a The null hypothesis of the t test is that the mean of relative susceptibility = 0. The significance level is .0083 after correcting multiple comparisons of 6 using the Bonferroni method.

PreviousNext
Back to top

In this issue

American Journal of Neuroradiology: 37 (10)
American Journal of Neuroradiology
Vol. 37, Issue 10
1 Oct 2016
  • Table of Contents
  • Index by author
  • Complete Issue (PDF)
Advertisement
Print
Download PDF
Email Article

Thank you for your interest in spreading the word on American Journal of Neuroradiology.

NOTE: We only request your email address so that the person you are recommending the page to knows that you wanted them to see it, and that it is not junk mail. We do not capture any email address.

Enter multiple addresses on separate lines or separate them with commas.
In Vivo 7T MR Quantitative Susceptibility Mapping Reveals Opposite Susceptibility Contrast between Cortical and White Matter Lesions in Multiple Sclerosis
(Your Name) has sent you a message from American Journal of Neuroradiology
(Your Name) thought you would like to see the American Journal of Neuroradiology web site.
CAPTCHA
This question is for testing whether or not you are a human visitor and to prevent automated spam submissions.
Cite this article
W. Bian, E. Tranvinh, T. Tourdias, M. Han, T. Liu, Y. Wang, B. Rutt, M.M. Zeineh
In Vivo 7T MR Quantitative Susceptibility Mapping Reveals Opposite Susceptibility Contrast between Cortical and White Matter Lesions in Multiple Sclerosis
American Journal of Neuroradiology Oct 2016, 37 (10) 1808-1815; DOI: 10.3174/ajnr.A4830

Citation Manager Formats

  • BibTeX
  • Bookends
  • EasyBib
  • EndNote (tagged)
  • EndNote 8 (xml)
  • Medlars
  • Mendeley
  • Papers
  • RefWorks Tagged
  • Ref Manager
  • RIS
  • Zotero
0 Responses
Respond to this article
Share
Bookmark this article
In Vivo 7T MR Quantitative Susceptibility Mapping Reveals Opposite Susceptibility Contrast between Cortical and White Matter Lesions in Multiple Sclerosis
W. Bian, E. Tranvinh, T. Tourdias, M. Han, T. Liu, Y. Wang, B. Rutt, M.M. Zeineh
American Journal of Neuroradiology Oct 2016, 37 (10) 1808-1815; DOI: 10.3174/ajnr.A4830
del.icio.us logo Twitter logo Facebook logo Mendeley logo
  • Tweet Widget
  • Facebook Like
  • Google Plus One
Purchase

Jump to section

  • Article
    • Abstract
    • ABBREVIATIONS:
    • Materials and Methods
    • Results
    • Discussion
    • Conclusions
    • Acknowledgments
    • Footnotes
    • References
  • Figures & Data
  • Info & Metrics
  • Responses
  • References
  • PDF

Related Articles

  • No related articles found.
  • PubMed
  • Google Scholar

Cited By...

  • Whole-Cerebrum distortion-free three-dimensional pseudo-Continuous Arterial Spin Labeling at 7T
  • Imaging cortical multiple sclerosis lesions with ultra-high field MRI
  • Quantitative Susceptibility Mapping of Time-Dependent Susceptibility Changes in Multiple Sclerosis Lesions
  • Heterogeneity of Cortical Lesion Susceptibility Mapping in Multiple Sclerosis
  • Crossref
  • Google Scholar

This article has not yet been cited by articles in journals that are participating in Crossref Cited-by Linking.

More in this TOC Section

  • Diagnostic Neuroradiology of Monoclonal Antibodies
  • Clinical Outcomes After Chiari I Decompression
  • Segmentation of Brain Metastases with BLAST
Show more Adult Brain

Similar Articles

Advertisement

Indexed Content

  • Current Issue
  • Accepted Manuscripts
  • Article Preview
  • Past Issues
  • Editorials
  • Editor's Choice
  • Fellows' Journal Club
  • Letters to the Editor
  • Video Articles

Cases

  • Case Collection
  • Archive - Case of the Week
  • Archive - Case of the Month
  • Archive - Classic Case

More from AJNR

  • Trainee Corner
  • Imaging Protocols
  • MRI Safety Corner
  • Book Reviews

Multimedia

  • AJNR Podcasts
  • AJNR Scantastics

Resources

  • Turnaround Time
  • Submit a Manuscript
  • Submit a Video Article
  • Submit an eLetter to the Editor/Response
  • Manuscript Submission Guidelines
  • Statistical Tips
  • Fast Publishing of Accepted Manuscripts
  • Graphical Abstract Preparation
  • Imaging Protocol Submission
  • Evidence-Based Medicine Level Guide
  • Publishing Checklists
  • Author Policies
  • Become a Reviewer/Academy of Reviewers
  • News and Updates

About Us

  • About AJNR
  • Editorial Board
  • Editorial Board Alumni
  • Alerts
  • Permissions
  • Not an AJNR Subscriber? Join Now
  • Advertise with Us
  • Librarian Resources
  • Feedback
  • Terms and Conditions
  • AJNR Editorial Board Alumni

American Society of Neuroradiology

  • Not an ASNR Member? Join Now

© 2025 by the American Society of Neuroradiology All rights, including for text and data mining, AI training, and similar technologies, are reserved.
Print ISSN: 0195-6108 Online ISSN: 1936-959X

Powered by HighWire