
Article Figures & Data
Figures
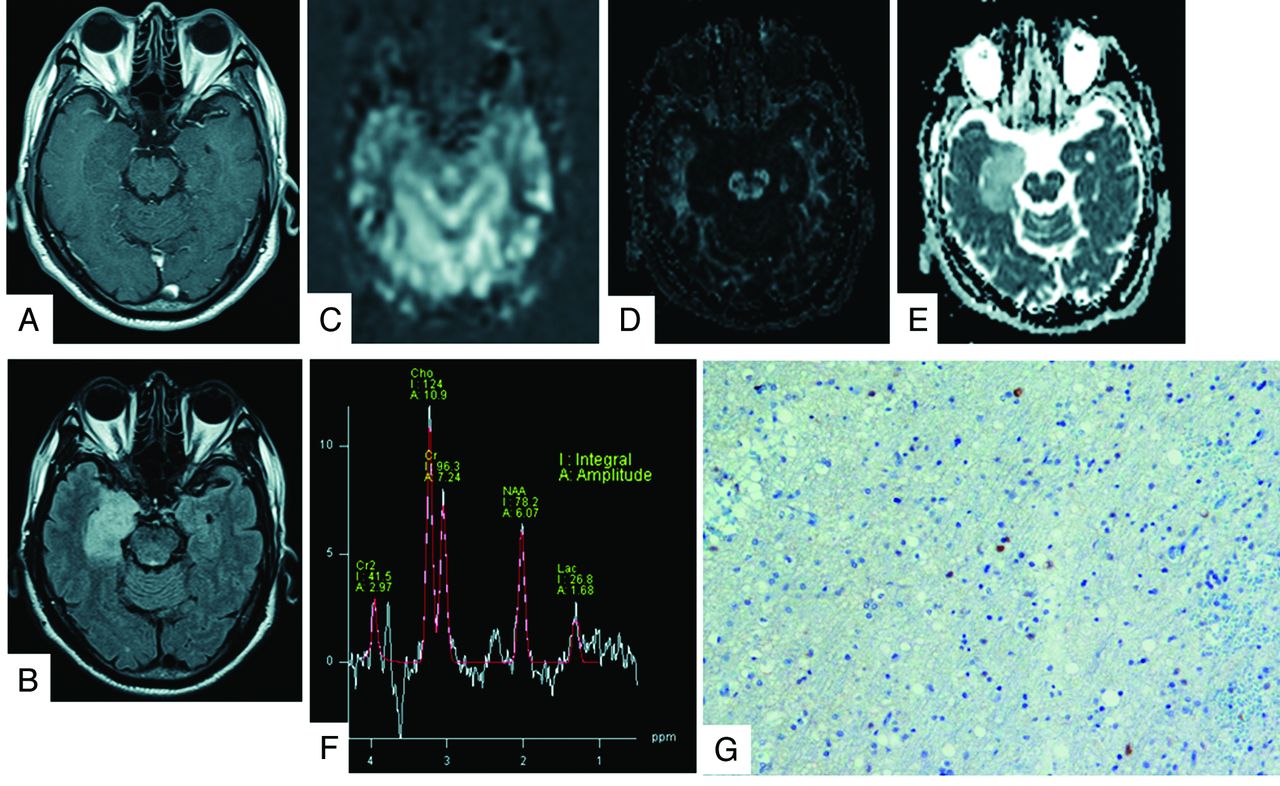
- Fig 1.
A 62-year-old man with a grade II oligoastrocytoma. The contrast-enhanced T1-weighted image shows a nonenhancing mass in the right hippocampus (A). The lesions presented high-intensity signals on FLAIR images (B). The rCBF map on PASL shows no areas of hyperperfusion (C). The FA map shows low FA values (D). The ADC map shows increased tumor diffusion values (E). The tumor MR spectrum shows decreased NAA and slightly increased Cho and Lac (F). The Ki-67 labeling index is 5.0% (original magnification × 400) (G).
- Fig 2.
A 60-year-old woman with a grade IV glioblastoma. The lesion on the left frontotemporal lobe exhibits strong enhancement on gadolinium T1-weighted image (A). The neoplasm is clearly hyperperfused compared with the healthy parenchyma on the PASL image (B). The FA map shows slightly low FA values (C). The ADC map shows heterogeneous tumor diffusion values (D). The tumor MR spectrum shows decreased NAA with a marked increase in Cho and Lac (E). The Ki-67 labeling index is 27.0% (original magnification × 400) (F).


Tables
- Table 1:
Threshold values for multiple parameters for differentiating high- and low-grade gliomas
Parameters Based on Minimum C1 Error Errors Based on Minimum C2 Error Errors Threshold Sensitivity Specificity PPV NPV C1 C2 Threshold Sensitivity Specificity PPV NPV C1 C2 rCBF ratio mean 2.562 0.652 0.778 0.882 0.467 0.285 0.170 2.562 0.652 0.778 0.882 0.467 0.285 0.170 rCBF ratio max 2.845 0.609 0.778 0.875 0.438 0.307 0.202 2.845 0.609 0.778 0.875 0.438 0.307 0.202 rCBF ratio min 2.017 0.739 0.667 0.850 0.500 0.297 0.179 2.017 0.739 0.667 0.850 0.500 0.297 0.179 rCBF ratio meana 1.800 0.824 0.667 0.933 0.401 0.255 0.142 1.800 0.824 0.667 0.933 0.401 0.255 0.142 rCBF ratio maxa 2.258 0.765 0.667 0.929 0.334 0.284 0.166 2.258 0.765 0.667 0.929 0.334 0.284 0.166 rCBF ratio mina 1.254 0.882 0.667 0.938 0.499 0.226 0.125 1.254 0.882 0.667 0.938 0.499 0.226 0.125 FA ratio mean 0.236 0.870 0.556 0.834 0.626 0.287 0.214 0.267 0.739 0.667 0.850 0.500 0.297 0.179 FA ratio max 0.288 0.870 0.667 0.870 0.668 0.232 0.128 0.288 0.870 0.667 0.870 0.668 0.232 0.128 FA ratio min 0.279 0.565 0.667 0.813 0.375 0.384 0.300 0.279 0.565 0.667 0.813 0.375 0.384 0.300 ADC ratio mean 1.659 0.913 0.667 0.875 0.750 0.210 0.118 1.659 0.913 0.667 0.875 0.750 0.210 0.118 ADC ratio max 1.538 0.826 0.556 0.826 0.556 0.309 0.227 1.538 0.826 0.556 0.826 0.556 0.309 0.227 ADC ratio min 1.564 0.913 0.667 0.875 0.750 0.210 0.118 1.564 0.913 0.667 0.875 0.750 0.210 0.118 Cho/Cr 1.789 0.913 0.778 0.913 0.778 0.155 0.057 1.789 0.913 0.778 0.913 0.778 0.155 0.057 NAA/Cho 0.349 0.696 0.778 0.889 0.500 0.263 0.142 0.349 0.696 0.778 0.889 0.500 0.263 0.142 NAA/Cr 1.289 0.304 1.000 1.000 0.360 0.348 0.484 0.894 0.478 0.778 0.846 0.368 0.372 0.322 Lac/Cr 1.789 0.739 1.000 1.000 0.600 0.131 0.068 1.789 0.739 1.000 1.000 0.600 0.131 0.068 Note:—min indicates minimum; max, maximum.
↵a rCBF ratios derived from purely astrocytomas.
- Table 2:
Threshold values for multiple parameters for differentiating glioblastomas and other-grade gliomas
Parameters Based on Minimum C1 Error Errors Based on Minimum C2 Error Errors Threshold Sensitivity Specificity PPV NPV C1 C2 Threshold Sensitivity Specificity PPV NPV C1 C2 rCBF ratio mean 2.562 0.867 0.765 0.765 0.867 0.184 0.073 2.562 0.867 0.765 0.765 0.867 0.184 0.073 rCBF ratio max 2.845 0.867 0.824 0.813 0.875 0.155 0.049 2.845 0.867 0.824 0.813 0.875 0.155 0.049 rCBF ratio min 2.017 0.867 0.588 0.650 0.834 0.273 0.187 2.164 0.800 0.647 0.667 0.786 0.277 0.165 rCBF ratio meana 1.857 0.929 0.833 0.928 0.834 0.119 0.033 1.857 0.929 0.833 0.928 0.834 0.119 0.033 rCBF ratio maxa 2.258 0.929 0.833 0.928 0.834 0.119 0.033 2.258 0.929 0.833 0.928 0.834 0.119 0.033 rCBF ratio mina 2.164 0.786 0.833 0.917 0.625 0.191 0.074 2.164 0.786 0.833 0.917 0.625 0.191 0.074 FA ratio mean 0.380 0.733 0.765 0.733 0.765 0.251 0.127 0.380 0.733 0.765 0.733 0.765 0.251 0.127 FA ratio max 0.371 0.800 0.588 0.631 0.769 0.306 0.210 0.418 0.667 0.706 0.667 0.706 0.314 0.197 FA ratio min 0.333 0.600 0.647 0.600 0.647 0.377 0.285 0.333 0.600 0.647 0.600 0.647 0.377 0.285 ADC ratio mean 1.305 0.800 0.765 0.750 0.813 0.218 0.095 1.305 0.800 0.765 0.750 0.813 0.218 0.095 ADC ratio max 1.494 0.933 0.529 0.636 0.899 0.269 0.226 1.494 0.933 0.529 0.636 0.899 0.269 0.226 ADC ratio min 1.449 0.933 0.647 0.700 0.916 0.210 0.129 1.148 0.733 0.824 0.786 0.778 0.222 0.102 Cho/Cr 1.789 0.933 0.471 0.609 0.888 0.298 0.284 2.813 0.733 0.647 0.647 0.733 0.310 0.196 NAA/Cho 0.338 0.733 0.647 0.647 0.733 0.310 0.196 0.338 0.733 0.647 0.647 0.733 0.310 0.196 NAA/Cr 1.922 0.200 1.000 1.000 0.586 0.400 0.640 0.725 0.600 0.412 0.474 0.539 0.494 0.506 Lac/Cr 2.778 0.667 0.882 0.833 0.750 0.226 0.125 2.778 0.667 0.882 0.833 0.750 0.226 0.125 ↵a rCBF ratio derived from purely astrocytomas.
- Table 3:
Combination of the minimum ADC ratio and Cho/Cr for differentiating high- and low-grade gliomas
Based on Minimum C1 Error Errors Based on Minimum C2 Error Errors Sensitivity Specificity PPV NPV C1 C2 Sensitivity Specificity PPV NPV C1 C2 0.870 0.889 0.952 0.727 0.121 0.029 0.870 0.889 0.952 0.727 0.121 0.029 - Table 4:
Combination of the maximum rCBF ratio and mean ADC ratio for differentiating glioblastomas and other-grade gliomas
Based on Minimum C1 Error Errors Based on Minimum C2 Error Errors Sensitivity Specificity PPV NPV C1 C2 Sensitivity Specificity PPV NPV C1 C2 0.733 0.941 0.917 0.800 0.163 0.075 0.733 0.941 0.917 0.800 0.163 0.075


Jump to section
Related Articles
Cited By...
- Application of 7T MRS to High-Grade Gliomas
- Addition of Amide Proton Transfer Imaging to FDG-PET/CT Improves Diagnostic Accuracy in Glioma Grading: A Preliminary Study Using the Continuous Net Reclassification Analysis
- 3D Pseudocontinuous Arterial Spin-Labeling MR Imaging in the Preoperative Evaluation of Gliomas
- Improving the Grading Accuracy of Astrocytic Neoplasms Noninvasively by Combining Timing Information with Cerebral Blood Flow: A Multi-TI Arterial Spin-Labeling MR Imaging Study