
Article Figures & Data
Figures
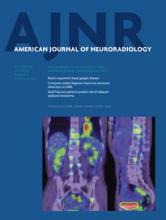
- Fig 1.
Phase (top) and FLAIR imaging (bottom) WM signal abnormalities in patients with clinically isolated syndrome, other neurologic diseases, and healthy controls. Red arrows indicate a hypointense ring on nodular-phase WM-SAs on SWI. Note the presence of phase WM-SA in the right periventricular region in the patient with CIS, which is not present on FLAIR.
- Fig 2.
ROC curves for the number of phase white matter signal abnormalities in differentiating patients with clinically isolated syndrome versus healthy controls (A) and patients with CIS versus those with other neurologic diseases (B).


Tables
- Table 1:
Demographic characteristics of patients with clinically isolated syndrome and other neurologic disorders and healthy controlsa
CIS (n = 48) HC (n = 47) P ONDb (n = 30) Pc Male/female 11:37 12:35 .766 7:23 .827 Age (yr) (mean) 40.7 ± 11.6 40.1 ± 10.7 .814 40.9 ± 15.6 .780 Age at diagnosis (yr) (mean) 38.3 ± 11.6 – – 34.6 ± 17.1 – Disease duration (yr) (mean) 2.8 ± 3.9 – – 12.3 ± 11.2 – Expanded Disability Status Scale (median ± IQR) 1.5 ± 1 – – – – Disease modifying therapy (No.) (%) No therapy 21, 43.8 Interferon β 1a 19, 39.6 – – – – Glatiramer acetate 7, 14.5 Other 1, 2.1 Type of OND (No.) (%)b Degenerative 10 (33.3) Autoimmune – – – 10 (33.3) – Vascular 10 (33.3) WM-SAV 5.1 ± 8.8 0.1 ± 0.3 <.001 3.4 ± 8.6 .042 Normalized brain volume 1532.6 ± 61.9 1556.4 ± 77.9 .103 1549.3 ± 101 .733 Normalized GM volume 785.8 ± 45.7 783.6 ± 45.1 .814 786.9 ± 82.5 .816 Normalized WM volume 746.9 ± 28.9 772.8 ± 49.8 .003 762.4 ± 37.6 .332 Normalized lateral ventricle volume 36.6 ± 15.2 30.5 ± 10.3 .032 36.2 ± 21.9 .151 Note:—CIS indicates clinically isolated syndrome; HC, healthy controls; IQR, interquartile range; OND, other neurological disorders; –, not applicable; WA-SAV, white matter signal abnormality volume.
↵a Values are presented as means. Volumetric measurements are presented in milliliters. Groups were compared using the χ2 test and Student t test.
↵b Degenerative disease group (n = 10) included patients with Parkinson disease (n = 6), epilepsy (n = 2), cerebellum syndrome (n = 1), and dementia (n = 1); autoimmune disease group (n = 10) included patients with antiphospholipid syndrome (n = 4), systemic lupus erythematosus (n = 3), neurosarcoidosis (n = 1), acute disseminated encephalomyelitis (n = 1), and chronic fatigue syndrome (n = 1); neurovascular disease group (n = 10) included patients with migraine (n = 7), transitory ischemic attack (n = 1), headache (n = 1), and CNS vasculitis (n = 1).
↵c P value of OND vs HC.
- Table 2:
Location of white matter signal abnormalities visible on SWI-filtered phase, T2WI, and their overlaps between patients with clinically isolated syndrome, other neurologic disorders, and healthy controlsa
CIS (n = 48) HC (n = 47) OND (n = 30) P P (No.) (%) Mean (SD) Median (No.) (%) Mean (SD) Median (No.) (%) Mean (SD) Median CIS vs HC CIS vs OND Phase WM-SA Total 186 (100) 3.88 (5.18) 2 19 (100) 0.4 (0.85) 0 25 (100) .83 (2.15) 0 .001 .0001 Periventricular 132 (71) 2.75 (3.26) 2 16 (84.2) 0.34 (0.7) 0 14 (56) .47 (1.22) 0 .001 .0001 Juxtacortical 15 (8) 0.31 (0.55) 0 0 (0) 0 (0) 0 4 (16) .13 (.43) 0 .001 .137 Infratentorial 0 (0) 0 (0) 0 0 (0) 0 (0) 0 0 (0) 0 (0) 0 1 1 Deep WM 39 (21) 0.81 (1.99) 0 3 (15.8) 0.06 (0.24) 0 7 (28) .23 (.68) 0 .012 .232 T2 WM-SA Total 770 (100) 16.04 (14.27) 10.5 46 (100) .98 (2.3) 0 243 (100) 8.1 (11.99) 4.5 .001 .0001 Periventricular 403 (52) 8.4 (5.68) 7.5 4 (9) .09 (.28) 0 138 (57) 4.60 (4.92) 3 .001 .0001 Juxtacortical 53 (7) 1.10 (1.65) 1 5 (11) .11 (.43) 0 15 (6) .50 (1.28) 0 .001 .016 Infratentorial 14 (2) 0.29 (0.68) 0 0 0 (0) 0 1 (0) .03 (.18) 0 .005 .083 Deep WM 300 (39) 6.25 (8.66) 2.5 37 (80) .79 (2.1) 0 89 (37) 2.97 (6.63) 0 .001 .010 Overlap Total 92 (100) 1.92 (2.97) 1 0 (0) 0 0 (0) 0 12 (100) .40 (1.4) 0 .001 .0001 Periventricular 70 (76) 1.46 (2.21) 1 0 (0) 0 0 (0) 0 5 (42) .17 (.53) 0 .001 .0001 Juxtacortical 4 (4) 0.08 (0.28) 0 0 (0) 0 0 (0) 0 3 (25) .10 (.40) 0 .082 .918 Infratentorial 0 (0) 0 (0) 0 0 (0) 0 0 (0) 0 0 (0) 0 (0) 0 1 1 Deep WM 18 (20) 0.38 (1.06) 0 0 (0) 0 0 (0) 0 4 (33) .13 (.51) 0 .005 .245 ↵a WM signal abnormality numbers were compared between groups using the Mann-Whitney U test. P values have been corrected for false discovery rate at the P < .05 level.
- Table 3:
Sensitivity and specificity for the presence of SWI-filtered phase, T2, and their overlapping white matter signal abnormalities among patients with clinically isolated syndrome, other neurologic disorders, and age- and sex-matched healthy controlsa
CIS vs HC CIS vs OND Sensitivity Specificity Accuracy Sensitivity Specificity Accuracy Phase WM-SA Total 70.8 76.6 73.7b 70.8 76.7 73.1b Periventricular 66.7 76.6 71.6b 66.7 80 71.8b Juxtacortical 27.1 100 63.2b 27.1 90 51.3 Infratentorial 0 100 – 0 100 – Deep WM 27.1 93.8 60c 27.1 86.7 50 T2 WM-SA Total 93.9 68.8 81.4b 95.8 13.3 64.1 Periventricular 93.8 91.5 92.6b 93.8 13.3 62.8 Juxtacortical 52.1 93.6 72.6b 52.1 83.3 64.1c Infratentorial 18.8 100 58.9c 18.8 96.7 48.7 Deep WM 81.3 74.5 77.9b 81.3 53.3 70.5 Overlapping Total 55.1 100 77.3b 56.3 90 69.2b Periventricular 54.2 100 76.8b 54.2 90 67.9b Juxtacortical 8.3 100 53.7b 8.3 93.3 41 Infratentorial 0 100 – 0 100 – Deep WM 18.8 100 59c 18.8 93.3 47.4 - Table 4:
Sensitivity and specificity for the presence of multiple SWI-filtered phase signal abnormalities and fulfillment of the McDonald 200530 and 20107 criteria for dissemination in space between patients with clinically isolated syndrome and other neurologic disordersa
CIS vs. OND Sensitivity Specificity Accuracy ≥2 Phase WM-SAs 56.3 83.3 66.7b ≥3 Phase WM-SAs 43.8 90 61.5c ≥4 Phase WM-SAs 43.8 93.3 62.8b McDonald 2005 criteria for DIS 52.1 80 62.8c McDonald 2010 criteria for DIS 62.5 76.7 67.9c ≥2 Phase + McDonald 2005 criteria for DIS 33.3 90 55.1 ≥2 Phase + McDonald 2010 criteria for DIS 39.6 90 58.9c


