
Abstract
BACKGROUND AND PURPOSE: The branches of the LSA are the main causative arteries for lacunar infarction, though the vascular changes are largely unknown. Herein, we examined the correlation of LSA imaging findings in patients with lacunar infarction compared with controls by using FSBB-MRA.
MATERIALS AND METHODS: Fifteen patients (9 men, 6 women; mean age, 73 years) with infarction at the basal ganglia and/or its vicinity were prospectively enrolled, and 12 aged-matched control subjects (6 men, 6 women; mean age, 68 years) were examined by using FSBB-MRA on a 1.5T MR imaging system. Total number and length of visualized LSA branches were compared by a 2-tailed 2-sample t test. Stepwise multiple regression analyses were performed, including hypertension, hyperlipidemia, smoking history, and diabetes mellitus after evaluation of their colinearity. P < .05 after correction for multiple comparisons was considered significant.
RESULTS: Patients with stroke had significantly fewer LSA branches (average, 6.3; 95% CI, 5.4–7.1) than controls (8.7; 95% CI, 7.8–9.5) (P = .0003). The total LSA lengths were 117 mm (95% CI, 96–138 mm) for patients with stroke and 162 mm (95% CI, 133–91 mm) for control subjects (P = .01). In stepwise multiple regression analysis, only the LSA branch numbers were significantly related to infarction (P = .0003), while only hypertension was significantly related to total LSA length (P = .0085).
CONCLUSIONS: Using FSBB-MRA to visualize LSA branches, we found a significant reduction in the numbers of LSA branches in patients with stroke, and hypertension was inversely related to total LSA length. FSBB is a promising method to investigate the LSA by using 1.5T MR imaging.
ABBREVIATIONS:
- CI
- confidence interval
- DM
- diabetes mellitus
- FSBB
- flow-sensitive black-blood
- HTN
- hypertension
- LSA
- lenticulostriate artery
The LSAs supply blood to the basal ganglia and its vicinity,1,2 and LSA occlusion can result in infarction of these structures.3⇓–5 LSA branches can be clearly observed by using digital subtraction angiography, though this technique is invasive.6,7 Recently, LSA branches have been successfully visualized with 7T MR imaging by using time-of-flight MRA,8,9 and relationships between decreased LSA visualization and hypertension or infarction at the basal ganglia and/or its vicinity were demonstrated.10,11 However, the availability of 7T MR imaging systems is very limited, and they are currently used for research purposes only. The relationship between decreased LSA visualization and hypertension was previously reported by using a 3T MR imaging system.12 However, there are no studies that compare LSA visualization between patients with a stroke at the basal ganglia and/or its vicinity and control subjects by using 1.5T or 3T MR imaging. Dilated LSA branches were visualized noninvasively with time-of-flight MRA by using 1.5T and 3T MR imaging in patients with Moyamoya disease.13 However, only a few LSA branches can be visualized by time-of-flight MRA at 1.5T when they are not dilated. Most interesting, a recent study of healthy volunteers reported that FSBB-MRA was better than time-of-flight MRA at 1.5T for visualization of the LSA.14
In the present study, we investigated the number and length of LSA branches in patients with a lacunar infarction at the basal ganglia and/or its vicinity and compared results with those of control subjects by using FSBB-MRA acquired on a 1.5T MR imaging system.
Materials and Methods
This prospective study was conducted under the approval of the institutional review board, and written informed consent was obtained from all subjects enrolled in this study.
Subjects
Fifteen patients (9 men and 6 women; mean age, 73 years; range, 57–82 years) with ≥1 stroke at the basal ganglia and/or its vicinity were prospectively enrolled from September 2008 to August 2009 at the outpatient clinic of one of the authors (M.I.). Lacunar infarction was observed at the basal ganglia and/or its vicinity bilaterally (n = 10) or unilaterally (n = 5) on clinically acquired MR images including T1WI, T2WI, DWI, and FLAIR. One patient had subacute infarction that showed slightly high signal intensity on DWI, while the other patients had chronic infarctions. Lacunar infarction showed a high signal intensity on T2WI, low signal intensity on T1WI, and a hyperintense lesion or a lesion with a hypointense center and a hyperintense rim reflecting gliosis on FLAIR images. The patients also had HTN (n = 13), hyperlipidemia (n = 6), DM (n = 4), and smoking history (n = 9). Twelve aged-matched control subjects (6 men and 6 women; mean age, 68 years; range, 50–85 years) were also recruited. No control subjects had any history of neurologic disorder, except 1 subject who had Parkinson disease. Only age and sex were considered so that they matched those of the patients. The control subjects had HTN (n = 5), hyperlipidemia (n = 6), DM (n = 3), and smoking history (n = 5).
Image Acquisition
All subjects were scanned with FSBB-MRA to visualize LSAs by using a 1.5T MR imaging system (Excelart Vantage Powered by Atlas; Toshiba Medical Systems, Tokyo, Japan). In the orientation of the anterior/posterior commissure section, FSBB images were scanned by using a 3D gradient-echo acquisition with the following parameters: TR/TE, 35/20 ms; flip angle, 20°; acquisition matrix size, 256 × 224; FOV, 205 × 179 mm in 1 axial 3D slab of 80 sections (0.8 mm thickness). The scanning time was 6 minutes 35 seconds. A motion-probing gradient of b = 4 s/mm2 was applied to dephase arterial blood flow.14 Final image volumes were reconstructed into cubic-0.4 mm resolution. In the same section orientation, T2-weighted fast spin-echo images were acquired with the following parameters: TR/TE, 4000/105 ms; flip angle, 90/160°; acquisition matrix size, 320 × 256; FOV, 220 × 180 mm; and section thickness, 3 mm with a 0.6-mm gap in 40 sections to cover the whole brain as an anatomic reference. Clinical images were acquired by using 1.5T MR imaging systems (Symphony; Siemens, Erlangen, Germany; and Signa; GE Healthcare, Milwaukee, Wisconsin). FLAIR acquisition parameters were as follows: Symphony: TR/TE/TI, 10,000/114/2000 ms; acquisition matrix size, 256 × 164; Signa: TR/TE/TI, 8802/115/1800 ms; acquisition matrix size, 256 × 160; FOV, 220 × 220 mm; section thickness, 3 mm with a 1-mm gap for both scanners. DWI was acquired with the following parameters: Symphony: TR/TE, 4100–4600/82 ms; acquisition matrix size, 128 × 96; Signa, TR/TE, 10,000/100–102 ms; acquisition matrix size, 128 × 128; FOV, 220 × 220 mm; section thickness, 3 mm with a 1-mm gap and b-value of 1000 s/mm2, for both scanners.
Image Analysis
The 3D image volume data were transferred to a commercially available workstation (Virtual PlaceLexus; Aze, Tokyo, Japan), and the following processing and evaluations were conducted. After reorienting axial 3D-FSBB image volumes into coronal planes (perpendicular to the anterior/posterior commissure line), each of 5 consecutive sections was projected by minimum intensity (ie, minimum intensity projection of 2-mm thickness). By using these and the original images, LSA branches were traced, and their number and length were measured on the workstation. LSA branches longer than 5 mm were analyzed.14 When an artery branched within 5 mm from the MCA origin, each branch was counted and measured separately because >70% of branches were found to originate from common trunks.2 When an artery branched at a more distal site, only the longest branch was counted and measured.14 Two radiologists conducted the analysis in consensus (S.O. and T.O. with 4 and 19 years of experience, respectively).
Statistical Analysis
Differences between patients and controls were examined by using a 2-tailed 2-sample t test for age and a Fisher exact test for sex and the presence or absence of HTN, hyperlipidemia, DM, and smoking history. The average number and total length of LSA branches were compared between the 2 groups with a 2-tailed 2-sample t test. To investigate the effect of confounding factors, we evaluated the correlation between the groups for age, sex, infarction, DM, hyperlipidemia, HTN, and smoking history. When there was a correlation coefficient higher than 0.5 between the 2 groups, the factors with the higher correlation coefficients with either the number or the total length of the LSA branches were included for further analysis. After selecting independent factors, we conducted a stepwise multiple regression analysis to find the factors that significantly correlated with the number and length of the LSA branches. A P value < .05 after Holm correction for multiple comparisons was considered statistically significant. Statistical analyses were conducted by using a commercially available software package, MedCalc for Windows (MedCalc Software, Mariakerke, Belgium).
Results
There was no statistically significant difference in the average age and male/female ratio between patients and control subjects. The number of subjects with HTN was higher in patients than in controls (P = .037), while there was no difference in other factors (Table). The average number of visualized LSA branches per subject was significantly lower in patients with stroke (6.3 [95% CI, 5.4–7.1]) compared with control subjects (8.7 [95% CI, 7.8–9.5]) (P = .0003). The averages of the total length of visualized LSA branches were 117 mm (95% CI, 96–138 mm) for patients and 162 mm (95% CI, 133–91 mm) for control subjects (P = .01).
Characteristics of patients with stroke and control subjectsa
Among the confounding factors, significant correlations were observed between HTN and age (r = 0.62) and smoking history and sex (r = 0.63). In both pairs, the HTN and smoking history factors had higher correlation coefficients with both the average number and length of LSA branches. Therefore, infarction, DM, hyperlipidemia, HTN, and smoking history were included for further analysis. In the stepwise multiple regression analysis, the number of LSA branches was significantly related to the presence of infarction (P = .0003), but not to the other factors (Fig 1). However, the total length of the visualized LSA branches was significantly related to HTN (P = .0085) but not to infarction or the other factors (Fig 2). Representative images with and without infarction and HTN are presented in Figs 3 and 4, respectively.

Average number of LSA branches with and without infarction, HTN, hyperlipidemia, DM, and smoking history. There was a significant reduction in the average number of LSA branches for infarction (asterisk indicates P = .0003) but not for other factors.

Total length of LSA branches with and without infarction, HTN, hyperlipidemia, DM, and smoking history. There was a significant reduction in total length of LSA branches for HTN only (asterisk indicates P = .0085).

Representative cases with (A, 62 years old) and without (B, 59 years old) a stroke. Fewer LSA branches (white arrows) are observed in the patient with stroke. There are 4/3 and 4/6 LSA branches visualized on the right/left sides, respectively, for cases with (A) and without (B) a stroke. The images are minimum-intensity-projected for 20-mm thickness for presentation. For a case with a stroke, FLAIR (C) and DWI (D) are also presented to show a chronic infarction at the right basal ganglia.

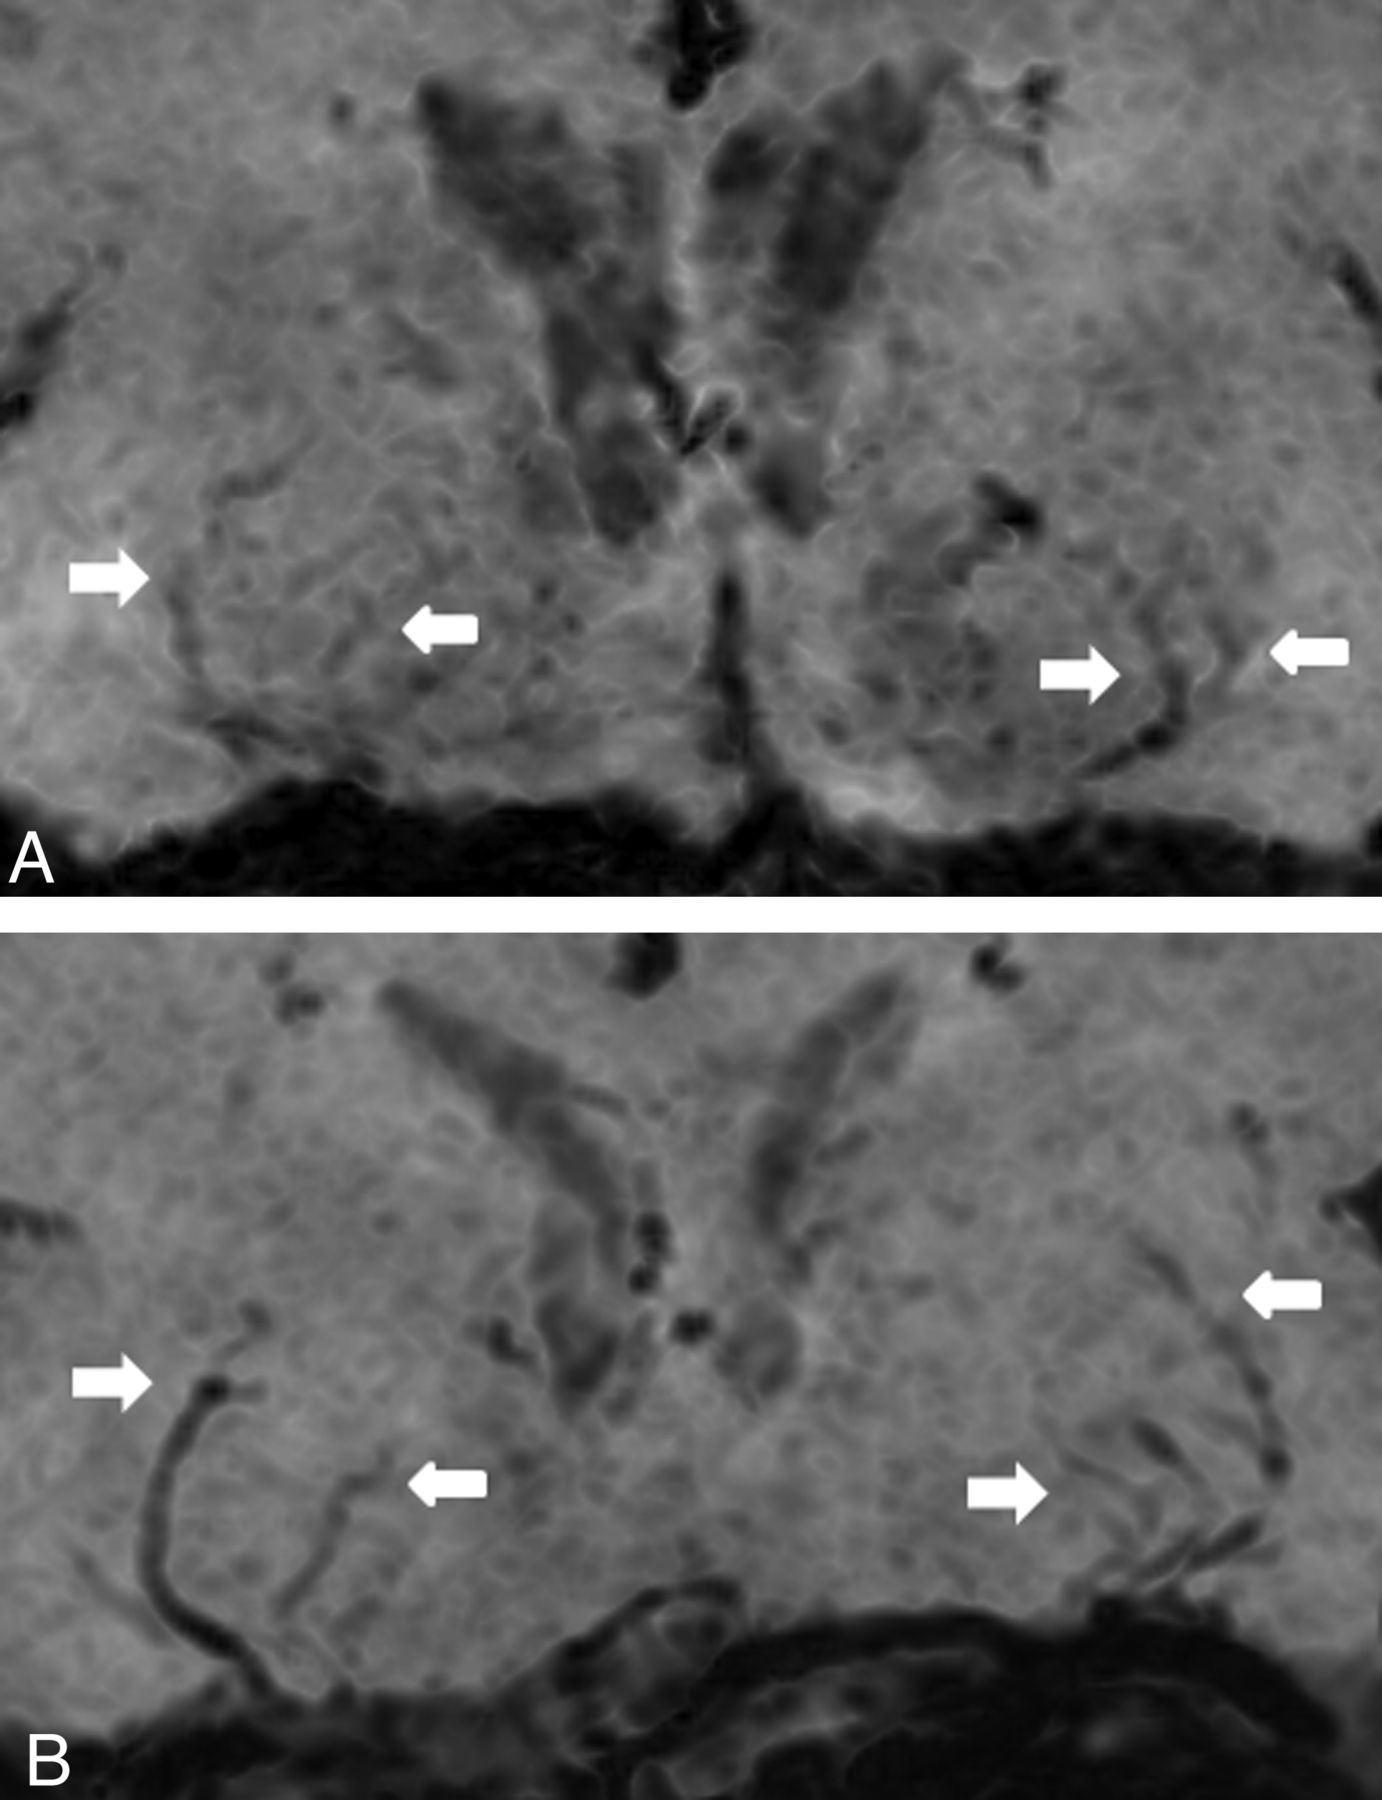
Representative cases with (A, 69 years old) and without (B, 60 years old) hypertension. No infarction was detected in these cases. There were 9 and 9 LSA branches visualized in total, with total lengths of 159 and 225 mm, respectively, for cases with (A) and without (B) hypertension. Visualized LSA branches (white arrows) are shorter in the subject with hypertension. The images are minimum-intensity-projected for 10-mm thickness for presentation.
Discussion
Impairment of the LSA causes lacunar infarction and cerebral hemorrhage, termed “small vessels, big problems.”15 However, there are few imaging studies of the LSA, mainly owing to the required high resolution not being readily attainable by conventional imaging modalities.9,12,14,16 Conventional angiography can provide sufficient resolution, but it is invasive and can be applied only in selected cases. Thus, a noninvasive and widely applicable imaging method to visualize the LSA branches is required.
There are several pulse sequences that may visualize LSA branches by using a 1.5T MR imaging system. Time-of-flight MRA is most frequently used for large intracranial arteries, though only a few LSA branches can be visualized.14 In FSBB-MRA, the signal from rapidly flowing blood is attenuated by applying a very weak motion-probing gradient for signal dephasing, which mainly attenuates the signal from rapidly flowing blood in the artery,17 while the signal from stationary or slow-moving components is much less affected. Small vessels have been successfully visualized as black blood by using SWI,18⇓–20 though phase disturbance is observed mainly in the vein21 and there are no comparative studies.
In the present study, we found significantly fewer LSA branches in patients than in control subjects. Although there were more hypertensive subjects included in the patients, stepwise multiple regression analysis showed a statistically significant reduction only for the presence of the lacunar infarction. In a lacunar infarction at the basal ganglia and/or its vicinity, occlusion occurs at the origin to a distal site of an LSA branch. Even when the occlusion occurs at a distal location, this decreases blood flow and may result in nonvisualization of the affected LSA branch. In the present study, multiple regression analysis demonstrated no significant difference related to HTN. A previous study reported no difference in the mean number of LSA branches in a hypertensive group older than 50 years of age compared with an age-matched nonhypertensive group.12 Similarly, in the present study, patients and controls were 50 years of age or older, and the average number of LSA branches was not statistically related to HTN.
The average total length of the visualized LSA branches was significantly shorter in patients than in controls. However, in the stepwise multiple regression analysis, HTN was the only factor that significantly correlated with this difference and was the only confounding factor that was significantly different between patients and controls. In a recent SPECT study, patients with HTN exhibited significantly lower brain perfusion.22 Thus, decreased brain perfusion and arteriolosclerosis caused by hypertension may induce decreased visualization at the distal part of LSA branches.
FSBB-MRA could detect reduced visualization of LSA branches for patients who are hypertensive or have a stroke at the basal ganglia and/or at its vicinities, even at 1.5T. FSBB acquisition is noninvasive and can be applied to any subjects who are not contraindicated for 1.5T or 3T MRI, which are now widely available. This study provides an initial imaging basis toward prevention of “big problems” caused by “small vessels,”15 though further studies are required to attain it.
There are a few limitations to our study. On FSBB images, the perivascular space or CSF may be detected as the same signal void. In elderly subjects, the perivascular space is frequently dilated, while the CSF signal in the space is usually higher than the dephased signal of the LSA branch. Calcification, small hemorrhage, and iron deposits are also visualized as a signal void, though these can be identified as spotty, nodular, or even masslike lesions and may not exhibit the stringlike shape of LSA branches. Veins can also be visualized as a signal void, though only vessels arising from the MCA were included in this study. Second, we only evaluated the length of LSA branches bilaterally. Nevertheless, 10 of 15 patients exhibited bilateral infarction, suggesting a limited effect on our results. Third, we only evaluated the LSA branches from the horizontal segment of the MCA. LSA branches can arise from other parts of the MCA or anterior cerebral artery, and the origin of LSAs can vary among different individuals. However, histologic examination of the LSAs in the vascular casts of 48 middle cerebral arteries revealed that >90% of LSA branches originated from the first segment of the MCA,2 and we applied this counting rule equally to both patients and controls. Finally, it was reported that the number of LSA branches ranged from 2 to 12 (mean, 7.1) on one side of the cerebral hemisphere of autopsied brain,2 while FSBB angiography could visualize 8.7 LSA branches on average, even after bilateral summation. Thus, it is likely that we could not visualize all LSA branches because of their small size (80–1400 μm).2
Conclusions
We found that FSBB-MRA could be used to visualize LSA branches and detect significant differences between patients with stroke and age-matched controls. FSBB-MRA has proved its potential to investigate the LSA even on a 1.5T MR imaging system. Further studies are required to determine whether the risk of infarction can be assessed by deteriorated visualization of LSA branches by using FSBB-MRA.
Footnotes
This work was supported by a sponsored research program, Research for Improvement of MR Visualization (No. 150100700014), provided to Kaori Togashi by Toshiba Medical Systems Inc, Japan.
References
- Received March 23, 2012.
- Accepted after revision July 12, 2012.
- © 2013 by American Journal of Neuroradiology


