Advertisement

Main menu

  • Home
  • Content
    • Current Issue
    • Accepted Manuscripts
    • Article Preview
    • Past Issue Archive
    • Video Articles
    • AJNR Case Collection
    • Case of the Week Archive
    • Case of the Month Archive
    • Classic Case Archive
  • Special Collections
    • AJNR Awards
    • Low-Field MRI
    • Alzheimer Disease
    • ASNR Foundation Special Collection
    • Photon-Counting CT
    • View All
  • Multimedia
    • AJNR Podcasts
    • AJNR SCANtastic
    • Trainee Corner
    • MRI Safety Corner
    • Imaging Protocols
  • For Authors
    • Submit a Manuscript
    • Submit a Video Article
    • Submit an eLetter to the Editor/Response
    • Manuscript Submission Guidelines
    • Statistical Tips
    • Fast Publishing of Accepted Manuscripts
    • Graphical Abstract Preparation
    • Imaging Protocol Submission
    • Author Policies
  • About Us
    • About AJNR
    • Editorial Board
    • Editorial Board Alumni
  • More
    • Become a Reviewer/Academy of Reviewers
    • Subscribers
    • Permissions
    • Alerts
    • Feedback
    • Advertisers
    • ASNR Home

User menu

  • Alerts
  • Log in

Search

  • Advanced search
American Journal of Neuroradiology

American Journal of Neuroradiology

ASHNR American Society of Functional Neuroradiology ASHNR American Society of Pediatric Neuroradiology ASSR
  • Alerts
  • Log in

Advanced Search

  • Home
  • Content
    • Current Issue
    • Accepted Manuscripts
    • Article Preview
    • Past Issue Archive
    • Video Articles
    • AJNR Case Collection
    • Case of the Week Archive
    • Case of the Month Archive
    • Classic Case Archive
  • Special Collections
    • AJNR Awards
    • Low-Field MRI
    • Alzheimer Disease
    • ASNR Foundation Special Collection
    • Photon-Counting CT
    • View All
  • Multimedia
    • AJNR Podcasts
    • AJNR SCANtastic
    • Trainee Corner
    • MRI Safety Corner
    • Imaging Protocols
  • For Authors
    • Submit a Manuscript
    • Submit a Video Article
    • Submit an eLetter to the Editor/Response
    • Manuscript Submission Guidelines
    • Statistical Tips
    • Fast Publishing of Accepted Manuscripts
    • Graphical Abstract Preparation
    • Imaging Protocol Submission
    • Author Policies
  • About Us
    • About AJNR
    • Editorial Board
    • Editorial Board Alumni
  • More
    • Become a Reviewer/Academy of Reviewers
    • Subscribers
    • Permissions
    • Alerts
    • Feedback
    • Advertisers
    • ASNR Home
  • Follow AJNR on Twitter
  • Visit AJNR on Facebook
  • Follow AJNR on Instagram
  • Join AJNR on LinkedIn
  • RSS Feeds

AJNR Awards, New Junior Editors, and more. Read the latest AJNR updates

Research ArticleBrain

Assessing Abnormal Iron Content in the Deep Gray Matter of Patients with Multiple Sclerosis versus Healthy Controls

C.A. Habib, M. Liu, N. Bawany, J. Garbern, I. Krumbein, H.-J. Mentzel, J. Reichenbach, C. Magnano, R. Zivadinov and E.M. Haacke
American Journal of Neuroradiology February 2012, 33 (2) 252-258; DOI: https://doi.org/10.3174/ajnr.A2773
C.A. Habib
  • Find this author on Google Scholar
  • Find this author on PubMed
  • Search for this author on this site
M. Liu
  • Find this author on Google Scholar
  • Find this author on PubMed
  • Search for this author on this site
N. Bawany
  • Find this author on Google Scholar
  • Find this author on PubMed
  • Search for this author on this site
J. Garbern
  • Find this author on Google Scholar
  • Find this author on PubMed
  • Search for this author on this site
I. Krumbein
  • Find this author on Google Scholar
  • Find this author on PubMed
  • Search for this author on this site
H.-J. Mentzel
  • Find this author on Google Scholar
  • Find this author on PubMed
  • Search for this author on this site
J. Reichenbach
  • Find this author on Google Scholar
  • Find this author on PubMed
  • Search for this author on this site
C. Magnano
  • Find this author on Google Scholar
  • Find this author on PubMed
  • Search for this author on this site
R. Zivadinov
  • Find this author on Google Scholar
  • Find this author on PubMed
  • Search for this author on this site
E.M. Haacke
  • Find this author on Google Scholar
  • Find this author on PubMed
  • Search for this author on this site
  • Article
  • Figures & Data
  • Info & Metrics
  • Responses
  • References
  • PDF
Loading

Article Figures & Data

Figures

  • Tables
  • Fig 1.
    • Download figure
    • Open in new tab
    • Download powerpoint
    Fig 1.

    SWI filtered-phase images displaying the basal ganglia and the midbrain of an age-matched healthy control (A−C) and patient with MS (D−F), showing abnormal iron deposition in the GP, PUT, and the CN (D); the SN and the RN of the midbrain (E); and the PT (F).
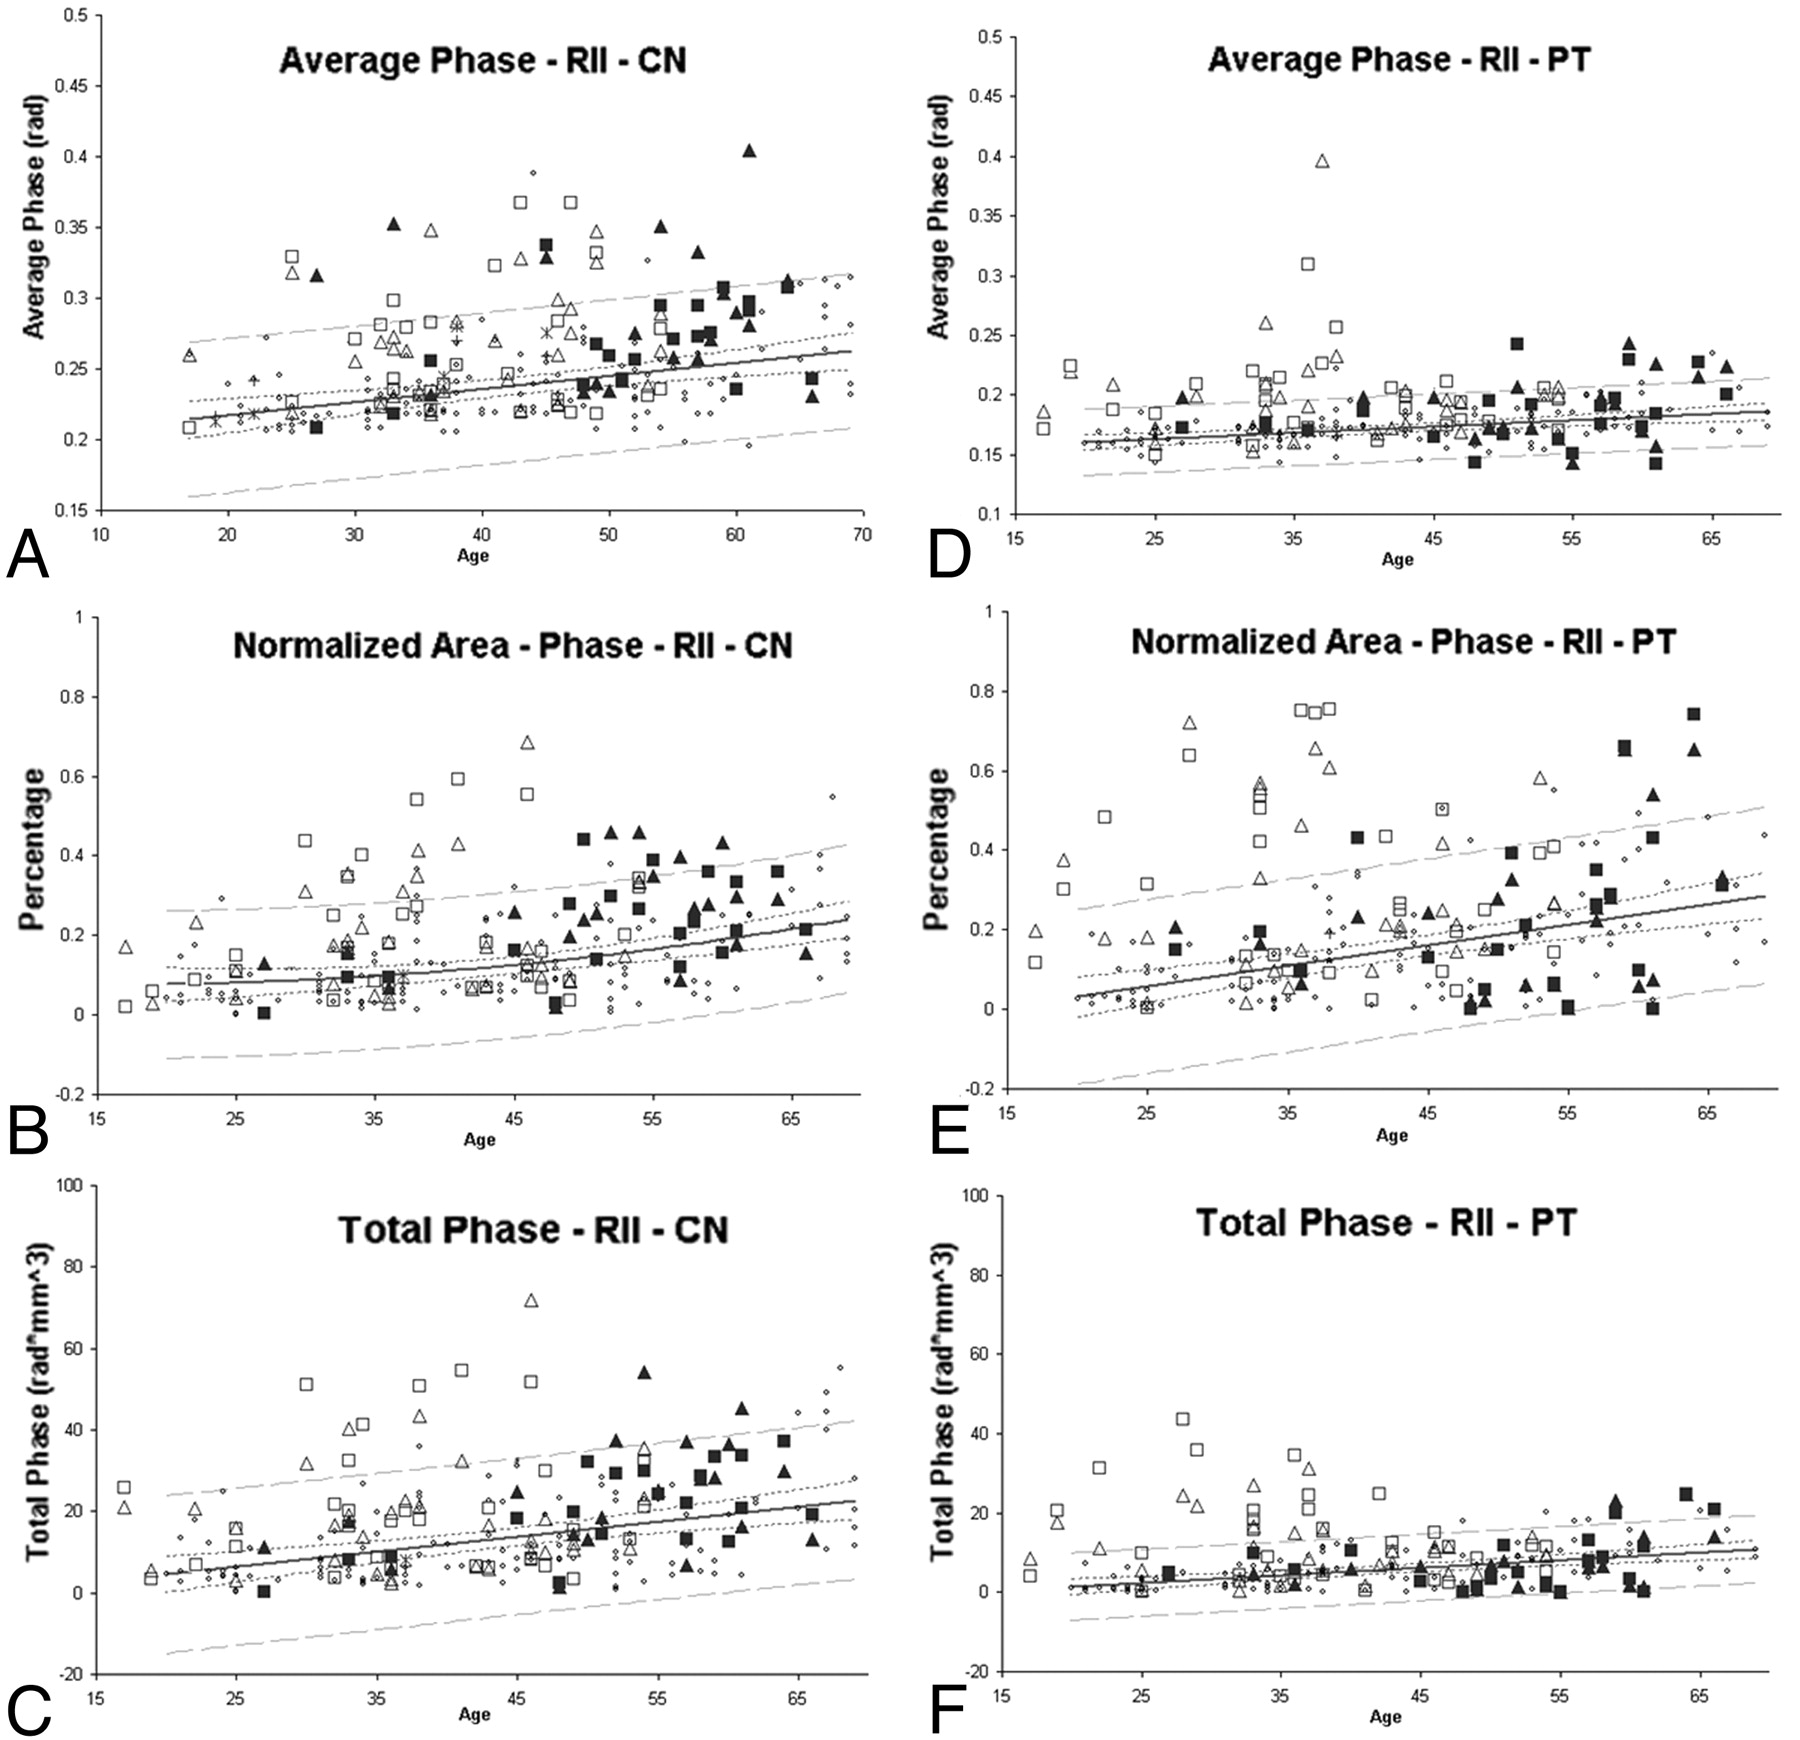
  • Fig 2.
    • Download figure
    • Open in new tab
    • Download powerpoint
    Fig 2.

    Average phase, normalized area, and total phase of RII in the CN and PT. Small dots represent healthy subjects. The solid line is the regression line, and the outer dashed lines represent the 95% prediction interval of the regression. Hollow squares and triangles represent patients with RRMS, and the solid squares and triangles represent patients with SPMS. The squares and triangles represent the left and right hemispheres respectively. Many of the patients with MS have brain iron content beyond the 95% prediction intervals.
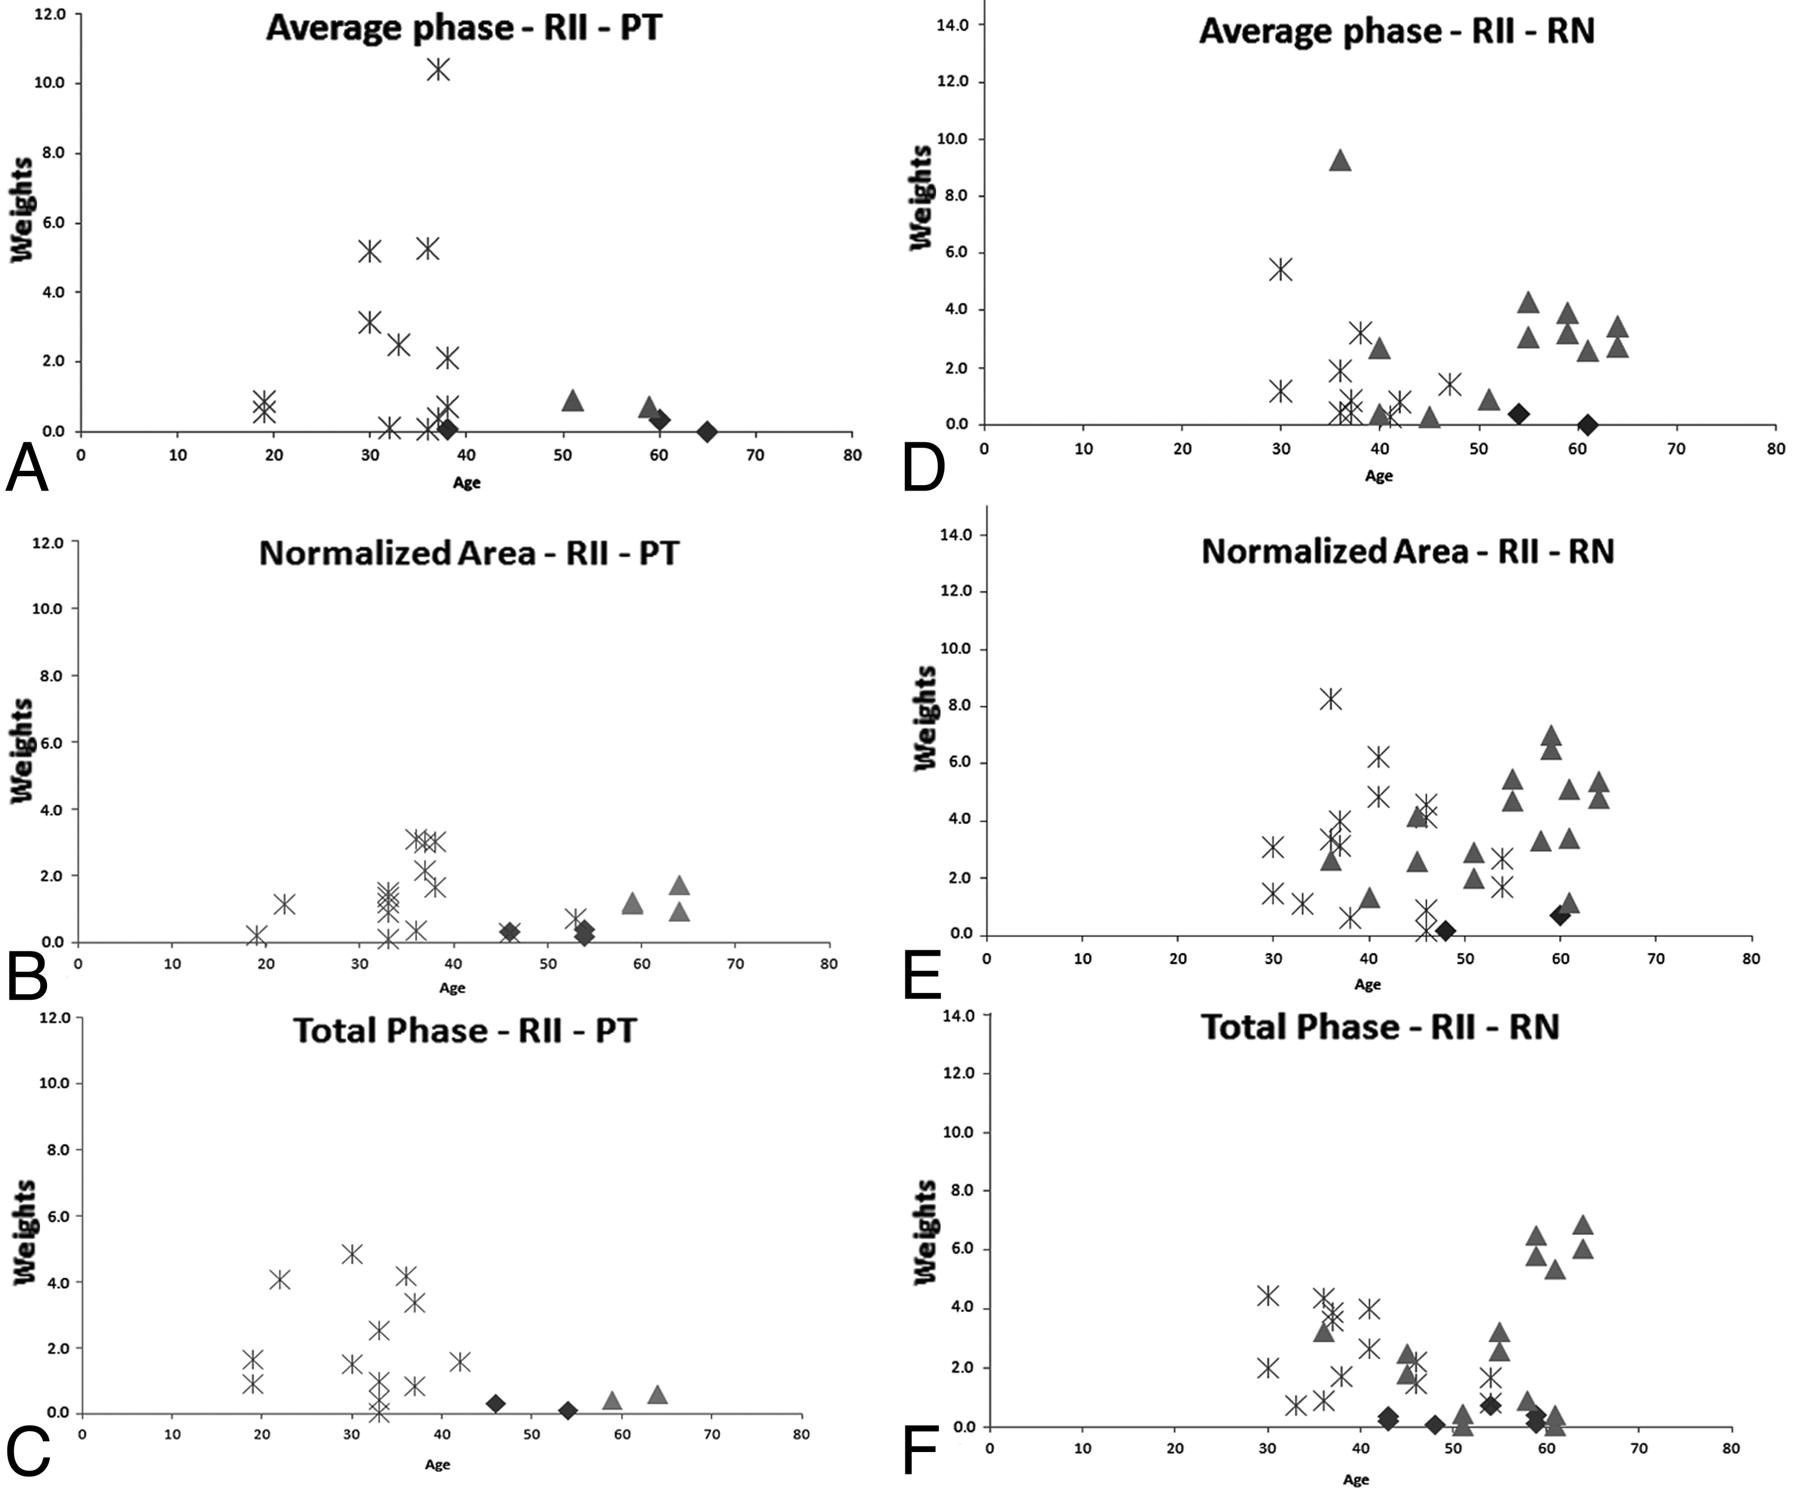
  • Fig 3.
    • Download figure
    • Open in new tab
    • Download powerpoint
    Fig 3.

    Plots showing individual weighting of different parameters (average phase: upper row; normalized area: middle row; and the total phase: lower row) of the PT (A−C) and the RN (D−F). The asterisks represent the patients with RRMS, the triangles represent those with SPMS, and the diamonds represent the healthy subjects. Patients with MS and healthy subjects with weighting higher than 1 are shown in the plots (these results correspond to m = 3; for quantitative evaluation, please refer to Tables 1 and 2).

  • Fig 4.
    • Download figure
    • Open in new tab
    • Download powerpoint
    Fig 4.

    Four plots showing the subtotal (A−C) weighting factors and the total weighting factor (D) of the 4 structures with the weighting factor >1 (these results correspond to m = 3): CN, PT, RN, and SN. The asterisks represent the patients with RRMS, the triangles represent the patients with SPMS, and the diamonds represent healthy subjects. For quantitative results of these graphs, please refer to Table 3.

Tables

  • Figures
    • View popup
    Table 1:

    Percentage of healthy and patient subjects with iron deposition higher than 2 SDs (P < .05) from the mean based on individual structures

    WeightsaRII-Average PhaseRII-Normalized AreaRII-Total Phase
    NPNPNP
    Subtotal12.362.516.463.516.451.9
    Individual
        CN3.718.34.520.25.312.5
        PT2.024.04.527.94.123.1
        RN4.533.76.634.66.130.8
        SN3.716.34.131.72.522.1
        GP4.57.73.36.74.55.8
        THA2.916.33.33.82.03.8
        PUT5.33.84.12.95.31.0
    • Note:—N indicates healthy subjects; P, patients.

    • ↵a Total weight for healthy subjects was 27.01, and for patients, 75.81.

    • View popup
    Table 2:

    Percentage of healthy and patient subjects with iron deposition higher than 3 SDs (P < .05) from the mean based on individual structures

    WeightsaRII-Average PhaseRII-Normalized AreaRII-Total Phase
    NPNPNP
    Subtotal5.743.36.152.95.741.3
    Individual
        CN1.214.42.012.50.48.7
        PT1.213.51.218.30.815.4
        RN0.821.20.830.82.927.9
        SN2.010.62.021.22.510.6
        GP2.04.80.81.02.01.0
        THA0.86.70.01.00.80.0
        PUT2.00.03.31.02.51.0
    • Note:—N indicates healthy subjects; P, patients.

    • ↵a Total weight for healthy subjects was 12.7, and for patients, 65.4.

    • View popup
    Table 3:

    Percentage of healthy and patient subjects with iron deposition higher than 2 and 3 SDs from the mean based on subtotal and total weightsa,b

    Weights2 SDs3 SDs
    RRSPHealthyRRSPHealthy
    MS/TMSMS/TMSHigh/TotalMS/TMSMS/TMSHigh/Total
    Total
        20–4028/36 (78%)6/8 (75%)15/112 (13%)24/36 (67%)4/8 (50%)1/112 (1%)
        41–7018/26 (69%)27/34 (79%)51/132 (38%)16/26 (62%)24/34 (71%)30/132 (23%)
        20–7046/62 (74%)33/42 (79%)66/244b (27%)40/62 (65%)28/42 (67%)31/244b (13%)
    Subtotal-normalized area
        20–4023/36 (64%)4/8 (50%)6/112 (5.4%)19/36 (53%)4/8 (50%)0/112 (0%)
        41–7016/26 (62%)23/34 (68%)34/132 (26%)12/26 (46%)20/34 (59%)15/132 (11%)
        20–7039/62 (63%)27/42 (64%)40/244 (16%)31/62 (50%)24/42 (57%)15/244 (6%)
    Subtotal-average phase
        20–4021/36 (58%)6/8 (75%)6/112 (5.4%)16/36 (44%)6/8 (75%)1/112 (1%)
        41–7013/26 (50%)25/34 (74%)24/132 (18%)9/36 (35%)14/34 (41%)13/132 (10%)
        20–7034/62 (55%)31/42 (74%)30/244 (12%)25/62 (40%)20/42 (50%)14/244 (6%)
    Subtotal-total phase
        20–4021/36 (58%)4/8 (50%)5/112 (4.5%)17/36 (47%)1/8 (13%)0/112 (0%)
        41–7010/26 (38%)19/34 (56%)35/132 (34%)8/26 (31%)17/34 (50%)14/132 (11%)
        20–7031/62 (50%)23/42 (55%)40/244 (16%)25/62 (40%)18/42 (43%)14/244 (6%)
    • Note:—TMS indicates total number of patients with MS.

    • ↵a Total weights summed over the 4 structures (CN, PT, RN, and SN) and all parameters (average phase, normalized area, and total phase). Subtotal weights summed over the 4 structures (CN, PT, RN, and SN) for individual parameters.

    • ↵b Both the left and right hemisphere measurements were included in this calculation. Since the total number of normal controls is 122, including the left and right measurements together will lead to 244 as the total count. This doubling also applies to the MS population studied. There are 62 values quoted for RR and 42 values for SP, yielding a total of 104.

PreviousNext
Back to top

In this issue

American Journal of Neuroradiology: 33 (2)
American Journal of Neuroradiology
Vol. 33, Issue 2
1 Feb 2012
  • Table of Contents
  • Index by author
Advertisement
Print
Download PDF
Email Article

Thank you for your interest in spreading the word on American Journal of Neuroradiology.

NOTE: We only request your email address so that the person you are recommending the page to knows that you wanted them to see it, and that it is not junk mail. We do not capture any email address.

Enter multiple addresses on separate lines or separate them with commas.
Assessing Abnormal Iron Content in the Deep Gray Matter of Patients with Multiple Sclerosis versus Healthy Controls
(Your Name) has sent you a message from American Journal of Neuroradiology
(Your Name) thought you would like to see the American Journal of Neuroradiology web site.
CAPTCHA
This question is for testing whether or not you are a human visitor and to prevent automated spam submissions.
Cite this article
C.A. Habib, M. Liu, N. Bawany, J. Garbern, I. Krumbein, H.-J. Mentzel, J. Reichenbach, C. Magnano, R. Zivadinov, E.M. Haacke
Assessing Abnormal Iron Content in the Deep Gray Matter of Patients with Multiple Sclerosis versus Healthy Controls
American Journal of Neuroradiology Feb 2012, 33 (2) 252-258; DOI: 10.3174/ajnr.A2773

Citation Manager Formats

  • BibTeX
  • Bookends
  • EasyBib
  • EndNote (tagged)
  • EndNote 8 (xml)
  • Medlars
  • Mendeley
  • Papers
  • RefWorks Tagged
  • Ref Manager
  • RIS
  • Zotero
0 Responses
Respond to this article
Share
Bookmark this article
Assessing Abnormal Iron Content in the Deep Gray Matter of Patients with Multiple Sclerosis versus Healthy Controls
C.A. Habib, M. Liu, N. Bawany, J. Garbern, I. Krumbein, H.-J. Mentzel, J. Reichenbach, C. Magnano, R. Zivadinov, E.M. Haacke
American Journal of Neuroradiology Feb 2012, 33 (2) 252-258; DOI: 10.3174/ajnr.A2773
del.icio.us logo Twitter logo Facebook logo Mendeley logo
  • Tweet Widget
  • Facebook Like
  • Google Plus One
Purchase

Jump to section

  • Article
    • Abstract
    • ABBREVIATIONS:
    • Materials and Methods
    • Results
    • Discussion
    • Conclusions
    • Footnotes
    • References
  • Figures & Data
  • Info & Metrics
  • Responses
  • References
  • PDF

Related Articles

  • No related articles found.
  • PubMed
  • Google Scholar

Cited By...

  • MRI phase changes in multiple sclerosis vs neuromyelitis optica lesions at 7T
  • Conventional and Advanced Imaging in Neuromyelitis Optica
  • Effect of Age on MRI Phase Behavior in the Subcortical Deep Gray Matter of Healthy Individuals
  • Crossref
  • Google Scholar

This article has not yet been cited by articles in journals that are participating in Crossref Cited-by Linking.

More in this TOC Section

  • Progression of Microstructural Damage in Spinocerebellar Ataxia Type 2: A Longitudinal DTI Study
  • SWI or T2*: Which MRI Sequence to Use in the Detection of Cerebral Microbleeds? The Karolinska Imaging Dementia Study
  • Statin Therapy Does Not Affect the Radiographic and Clinical Profile of Patients with TIA and Minor Stroke
Show more Brain

Similar Articles

Advertisement

Indexed Content

  • Current Issue
  • Accepted Manuscripts
  • Article Preview
  • Past Issues
  • Editorials
  • Editor's Choice
  • Fellows' Journal Club
  • Letters to the Editor
  • Video Articles

Cases

  • Case Collection
  • Archive - Case of the Week
  • Archive - Case of the Month
  • Archive - Classic Case

More from AJNR

  • Trainee Corner
  • Imaging Protocols
  • MRI Safety Corner
  • Book Reviews

Multimedia

  • AJNR Podcasts
  • AJNR Scantastics

Resources

  • Turnaround Time
  • Submit a Manuscript
  • Submit a Video Article
  • Submit an eLetter to the Editor/Response
  • Manuscript Submission Guidelines
  • Statistical Tips
  • Fast Publishing of Accepted Manuscripts
  • Graphical Abstract Preparation
  • Imaging Protocol Submission
  • Evidence-Based Medicine Level Guide
  • Publishing Checklists
  • Author Policies
  • Become a Reviewer/Academy of Reviewers
  • News and Updates

About Us

  • About AJNR
  • Editorial Board
  • Editorial Board Alumni
  • Alerts
  • Permissions
  • Not an AJNR Subscriber? Join Now
  • Advertise with Us
  • Librarian Resources
  • Feedback
  • Terms and Conditions
  • AJNR Editorial Board Alumni

American Society of Neuroradiology

  • Not an ASNR Member? Join Now

© 2025 by the American Society of Neuroradiology All rights, including for text and data mining, AI training, and similar technologies, are reserved.
Print ISSN: 0195-6108 Online ISSN: 1936-959X

Powered by HighWire