
Article Figures & Data
Figures
- Fig 1.
Anatomic drawing of a coronal view on the arteries and veins of the thoracolumbar spinal cord. The largest and, therefore, considered as the most important supplier of the thoracolumbar spinal cord is the Adamkiewicz artery (AKA). This inlet artery, or great anterior radiculomedullary artery, originates from a posterior branch of a segmental artery and courses through a typical hairpin turn to the ASA. The anterior median vein drains the blood from the spinal cord to the radiculomedullary veins. The largest of the outlet veins is the great anterior radiculomedullary vein (GARV), which connects to a segmental vein that eventually merges with the vena cava. Note the anatomic similarities in the configuration between the AKA and the GARV, which both exhibit a hairpin-like (intradural) course. However, the AKA is normally thinner, has a shorter intradural span, and is located more cranially than the GARV. 1 indicates posterior spinal arteries; 2, spinal cord; 3, ASA; 4, anterior median vein; 5, AKA; 6, segmental artery; 7, GARV; 8, aorta; 9, segmental vein; 10, vertebral body; and 11, vena cava. (Illustration made by Rogier Trompert.)
- Fig 2.
Timing of contrast agent arrival with MR fluoroscopy. By injecting a 2-mL test bolus of gadolinium-based contrast agent and dynamically acquiring every second a single 80-mm-thick sagittal section positioned through the aorta, the arrival of the contrast bolus in the abdominal aorta is 23 seconds after injection for this patient.
- Fig 3.
Schematic representation of the temporal signal intensity changes of arteries and veins due to the bolus injection of an MR contrast agent and the sampling of k-space data. Due to the bolus injection of the contrast agent, a temporarily (∼10-seconds) distinct difference exists in signal intensity between arteries (red) and veins (blue). By accurately timing the start of a first-phase scan, the temporarily existing contrast between arteries and veins can be exploited by first sampling the center of k-space followed by the periphery. Because the contrast of an MR image is highly determined by the central k-space values, arteries will appear brighter than veins on the first-phase images. At the time the consecutive second-phase data are acquired, the signal intensity differences between arteries and veins have vanished in all parts of the k-space, which will provide images wherein arteries and veins appear equally bright.
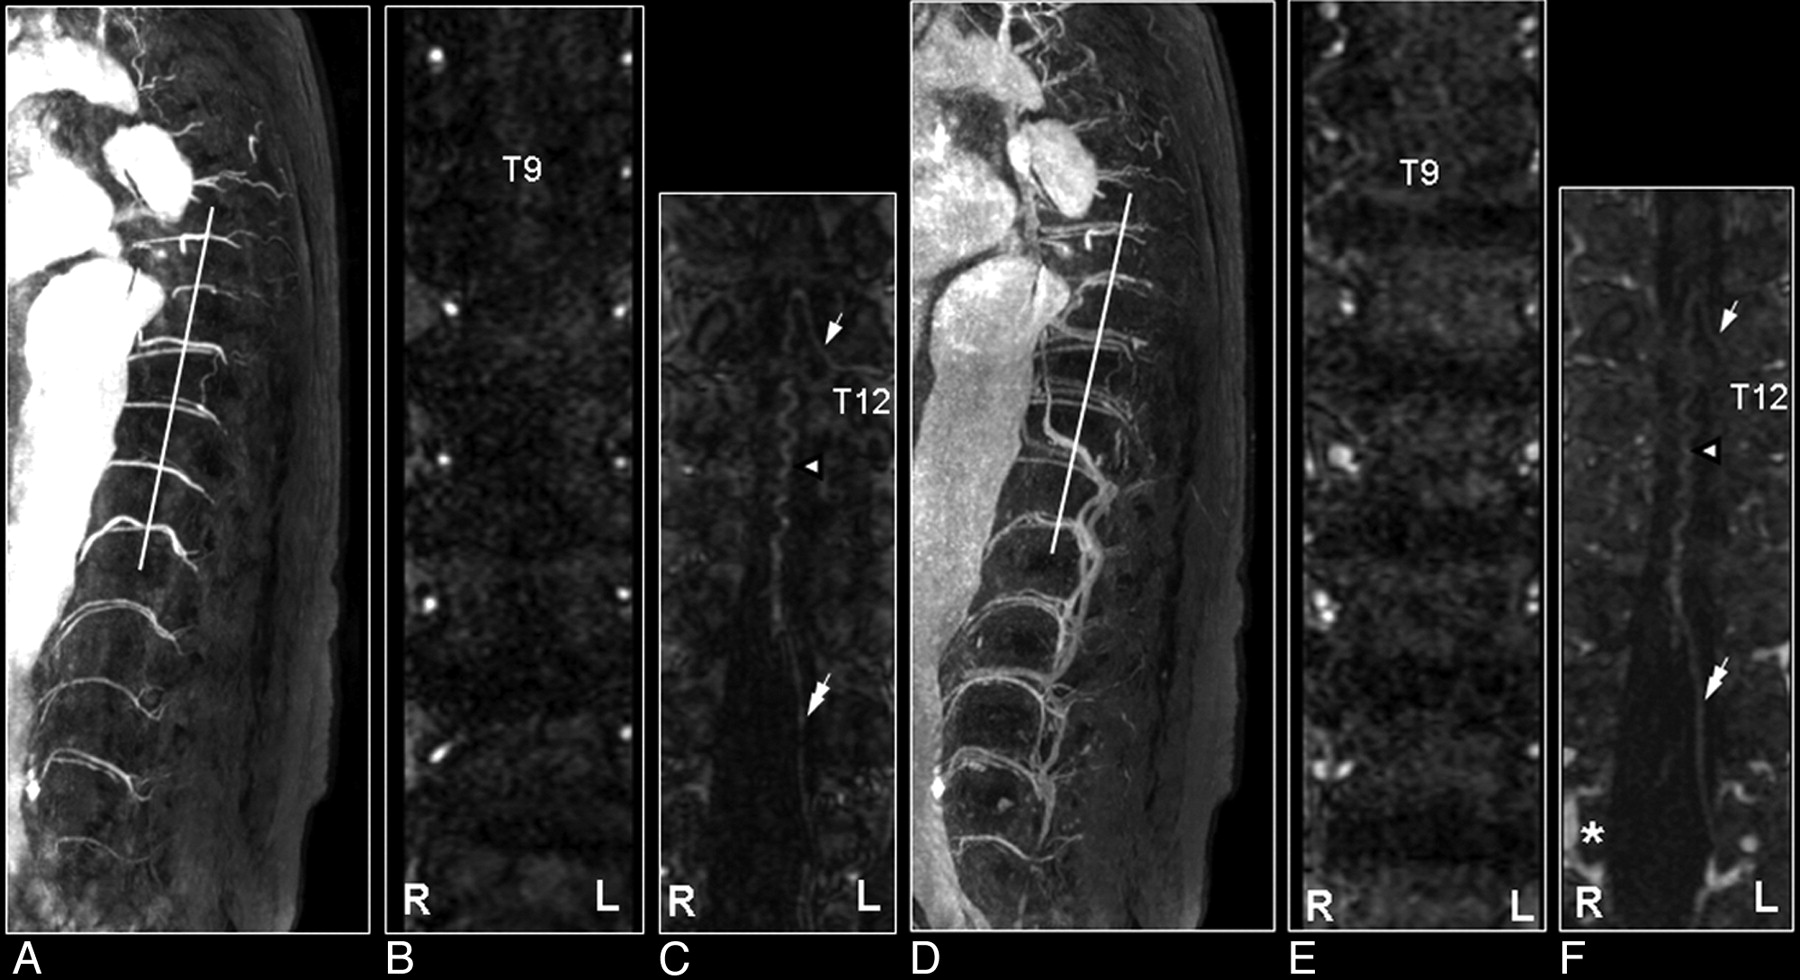
- Fig 4.
First and second dynamic-phase MR angiography images in a 56-year-old male patient with a thoracolumbar aortic aneurysm to demonstrate the differentiation of the spinal cord inlet artery from the outlet vein. On the sagittal section of the first dynamic phase, the dilated aorta and its branching segmental arteries are selectively visualized with high intensities (A), whereas on the second-phase image their appearances are less bright, and segmental veins are visualized as well (D). Oblique coronal multiplanar reformation images (white lines) show at each vertebral level 1 segmental artery on each side of the vertebral column, except for the occluded right segmental artery at T9, on the first-phase image (B) and a combination of arteries and veins on the second-phase image (E). The reformation first-phase image targeted to the spinal canal depicts the inlet artery, that is, the AKA (arrow in C). On the reformation image of the second phase, the AKA displays decreased intensity relative to the first-phase image, whereas the draining vein (double arrow) is visualized more caudally (F), and the epidural venous plexus has become enhanced (*). Note that the midline vasculature most likely represents a combination of the ASA and anterior median vein, which remain spatially unresolved (arrowhead in C and F).
- Fig 5.
Coronal catheter angiographic projection (A) and multiplanar reformatted MR angiogram of the early phase (B) and late phase (C) in a 55-year-old male patient with a SDAVF. On the catheter angiogram (A) the supplying segmental artery (large arrow), the AKA (white arrow) and the ASA (white arrowhead) are depicted. The MR angiogram of the early phase (B) shows the supplying segmental artery (large white arrow) and the AKA (white arrow). Regarding the anterior midline enhancement in the first phase (B) above and below the connection of the AKA with the ASA (white arrowheads), this is most probable enhancement of the spatially unresolved combination of the ASA and the AMV (black arrowheads). The second-phase MR angiogram (C) shows diminished signal intensity of the AKA (white arrow), in contrast with the anterior midline enhancement, which is clearly increased compared with the first phase (B) due to increased venous enhancement. The midline enhancement seen in the second phase (C) is most likely a combination of AMV (black arrowheads) and ASA (white arrowheads) enhancement. Note that there is enhancement of the venous plexus (*) in the late phase (C), which is not seen on the first phase MR angiogram (B). The cephalad enhancement above the connection of the AKA with the ASA is only depicted on the MR images (B and C) and not on the catheter angiogram (A).
- Fig 6.
Multiplanar reformation of a 3D MR angiography image set of the spinal cord demonstrating the visualization of the AKA (arrow) and the ASA (arrowhead; A–C). A, Two bright dots on the axial section represent the cross-sections through the AKA and the ASA. B, The line between these 2 dots is the new orientation of the multiplanar reformation. C, The oblique coronal reformation section shows the spinal cord vessels along the anterior surface of the cord. D–F, Curved multiplanar reformation of the same 3D image set shows a caudally more extended part of the ASA. On the sagittal section, the course of the ASA can be identified on the anterior surface of the cord (A) and then followed to define the curved multiplanar reformation (B). The resulting slightly curved plane represents an image that displays the AKA and a larger part of the ASA (F) compared with C.
- Fig 7.
Comparison of MR angiography with catheter angiography in a patient with a SDAVF. A, Sagittally oriented T2-weighted image displaying the signal intensity voids around the spinal cord, which are characteristic of the vascular pathology. B, The sagittal MIP displays the craniocaudal extent of the dilated perimedullary vein draining the fistula. C, The magnified MR angiographic image depicts the arterial feeder of the fistula (arrow) and the dilated perimedullary vein, together with the ASA (arrowhead). D, The early phase image of the catheter angiography examination verified the vertebral location of the fistula. Note that only the catheter angiography images can reveal the small network of vessels of the fistula (D) and depict the dynamic drainage pattern (E), whereas MR angiography reveals better the spatial extent of the venous drainage (B).
- Fig 8.
Perimedullary SAVM in a 43-year-old female patient visualized by MR and catheter angiography: the problem of separating arteries from veins by MR angiography and of superimpositions in nonselective angiograms. A, Sagittal T2-weighted image showing increased signal intensity of the thoracolumbar cord and enlarged perimedullary and infraconal (serpentine) vessels raising the suspicion of a vascular spinal cord abnormality (small white arrows). B, Sagittal MIP of the MR angiography examination showing the overview and localization of the dilated vessels (small black arrows). C, In the coronal target MR angiography MIP, a mixture of enhanced tortuous arteries and veins is observed. D, On the catheter angiogram, the AP projection of the early phase shows filling of the largest SAVM-feeding radiculomedullary artery (white arrow), which derived from the first lumbar level (L1). In the late phase, the draining veins can clearly be distinguished from the artery (E), which was not possible with MR angiography (C). F, Due to the overprojection and the multiplanar reformation postprocessing, the origin of the large anterior radiculomedullary artery was first falsely localized at the 12th thoracic level (T12) on the MR angiogram (black arrow). G, Retrospectively, the correct level could be localized at L1 (black arrow). H, The T12 level gives rise to an additional posterior feeder of the SAVM, only localized by selective catheter angiography (gray arrow).41
- Fig 9.
SAVM of the filum terminale in a 61-year-old male patient visualized by MR and catheter angiography: the problem of differentiation between this rare type of SAVM and spinal dural AV fistulas is due to difficult shunt localization and vessel identification in present MR angiography. A, Sagittal T2-weighted image showing enlarged infraconal vessels raising the suspicion of a vascular spinal cord abnormality (small white arrows); no signal intensity abnormality of the spinal cord is visible. B, Sagittal MIP of the MR angiography data showing the overview and localization of the dilated vessels (small black arrows). C, The blood vessel demonstrated on the coronal target MR angiography MIP could, retrospectively, be identified to be an enlarged AKA (white arrow) and ASA, with origin from the 11th thoracic level (T11). D, Catheter angiography for comparison. E–G, The continuation of this ASA to the filum terminale (white arrowheads) is the feeding artery for this type of AVM situated at the level of L4 in this individual case (gray arrow). Differentiation of the feeding artery that is running downward (white arrowheads) and the arterialized vein (black arrowheads) that is running upward is only possible with a good time resolution of the selective angiogram, as shown on the catheter angiography images in early (F) and late phases (G).41
- Fig 10.
MR angiography of a patient with an SDAVF before (A) and after treatment (B). Shown are coronal maximum intensity projections. Note on the first-phase MR angiogram the dilated tortuous veins and the arterial feeder at thoracic vertebral level T7 of the fistula (A). After treatment the tortuous veins are not visible anymore (B).
- Fig 11.
Comparison of contrast-enhanced MR angiography of spinal cord vessels with use of gadopentetate dimeglumine (Magnevist; A, B, and C) and the blood pool agent MS-325 (Vasovist; C, D and E) in the same patient with a thoracoabdominal aortic aneurysm. For both contrast agents, the first- and second-phase MR angiograms (each 40 seconds, 0.8 × 0.8 × 1.2 mm) are shown depicting the AKA (white arrow) and the GARV (double arrow). The vessels depicted appear slightly brighter (particularly in the second phase) with the blood agent (D) due to the higher longitudinal relaxivity. E, The main advantage of a blood agent is that it remains for a substantially longer time in the circulation, which allows long acquisition times (6 minutes) and, thus, high signal intensity-to-noise ratio and/or high spatial resolution (0.4 × 0.4 × 0.8 mm), as demonstrated with the steady-state image. Although steady-state images may provide strongly improved image quality compared with fast 2-phase images, differentiation between inlet artery and outlet vein is not possible. Note that the conus of the cord becomes enhanced as well.


Tables
Variable Data Field strength 1.5T Coil Synergy spine phased array coil Pulse sequence 3D fast-gradient recalled echo, with centric k-space filling TR/TE/FA 6.0 ms/1.7 ms/30° Directions Frequency-encoding CC; phase-encoding AP; sagittal slices FOV/RFOV ≤50 cm CC/40%–70% reduction AP Acquisition time 35-52 seconds per dynamic phase Contrast administration 0.2–0.3 mmol Gd-DTPA/kg body weight, injected at 3 mL/s Voxel size ∼0.8 × 0.8 × 1.2 mm Precontrast Similar acquisition for subtraction Dynamic phases ≥2 Scan delay Scan delay time of acquisition is set to filling of abdominal aorta, determined by MR fluoroscopy with 2-mL test bolus Note:—FA indicates flip angle; RFOV, reduced FOV; CC, craniocaudal; AP, anterior-posterior; Gd-DTPA, gadolinium-diethylene-triaminepentaacetic acid.
Item MR Angiography CT Angiography Efficacy for AKA detection High, ≤100 % High, ≤100 % Validation with catheter angiography Realized in patients suspected of spinal vascular disease27 To be demonstrated Differentiation of inlet artery from outlet vein Possible with dynamic multiphase imaging Not demonstrated yet, may require table movement Anatomy (vertebrae) Second phase required Adequately covisualized Voxel size In-plane, 0.8 × 0.8 mm, Section thickness, 1.2 mm In-plane, 0.34 × 0.34 mm, Collimation width, 0.6 mm Spatial coverage Standard T5 to L5, craniocaudal FOV ≤50 cm, other directions (AP or RL) limited Entire spine is possible Scan duration (ie, temporal resolution) Down to 8 seconds, with limited spatial coverage25 Down to 6.5 seconds, with large spatial coverage45 Patient size Independent image quality Contrast-to-noise of vessels decreases for corpulent patients45 Safety Very small risk of NSF due to Gd-based contrast agent; reduces fluoroscopy time and iodinated contrast volume in subsequent catheter angiography Ionizing radiation, potentially nephrotoxic contrast agent Contrast agent 0.2–0.3 mmol Gd-chelate/kg 40–150 mL iodine compound Exam time 30–45 minutes 10–15 minutes Logistics Scheduling required for TAAA patients; MR imaging is already part of diagnosis in patients suspected for spinal cord vascular lesions Already part of preclinical work-up in TAAA patients Note:—AKA indicates Adamkiewicz artery; T5, fifth thoracic vertebral level; L5, fifth lumbar vertebral level; AP, anteroposterior; RL, right-left; TAAA, thoracoabdominal aortic aneurysm; NSF, nephrogenic sclerotic fibrosis; Gd, gadolinium.
In this issue


Jump to section
Related Articles
Cited By...
- Anatomy of the Great Posterior Radiculomedullary Artery
- Spinal Dural Fistulas without Swelling and Edema of the Cord as Incidental Findings
- Neuroradiology Back to the Future: Spine Imaging
- Vascular anatomy of the spinal cord
- Comparison of Gadobenate Dimeglumine and Gadodiamide in the Evaluation of Spinal Vascular Anatomy with MR Angiography