Advertisement

Main menu

  • Home
  • Content
    • Current Issue
    • Accepted Manuscripts
    • Article Preview
    • Past Issue Archive
    • Video Articles
    • AJNR Case Collection
    • Case of the Week Archive
    • Case of the Month Archive
    • Classic Case Archive
  • Special Collections
    • AJNR Awards
    • Low-Field MRI
    • Alzheimer Disease
    • ASNR Foundation Special Collection
    • Photon-Counting CT
    • View All
  • Multimedia
    • AJNR Podcasts
    • AJNR SCANtastic
    • Trainee Corner
    • MRI Safety Corner
    • Imaging Protocols
  • For Authors
    • Submit a Manuscript
    • Submit a Video Article
    • Submit an eLetter to the Editor/Response
    • Manuscript Submission Guidelines
    • Statistical Tips
    • Fast Publishing of Accepted Manuscripts
    • Graphical Abstract Preparation
    • Imaging Protocol Submission
    • Author Policies
  • About Us
    • About AJNR
    • Editorial Board
    • Editorial Board Alumni
  • More
    • Become a Reviewer/Academy of Reviewers
    • Subscribers
    • Permissions
    • Alerts
    • Feedback
    • Advertisers
    • ASNR Home

User menu

  • Alerts
  • Log in

Search

  • Advanced search
American Journal of Neuroradiology

American Journal of Neuroradiology

ASHNR American Society of Functional Neuroradiology ASHNR American Society of Pediatric Neuroradiology ASSR
  • Alerts
  • Log in

Advanced Search

  • Home
  • Content
    • Current Issue
    • Accepted Manuscripts
    • Article Preview
    • Past Issue Archive
    • Video Articles
    • AJNR Case Collection
    • Case of the Week Archive
    • Case of the Month Archive
    • Classic Case Archive
  • Special Collections
    • AJNR Awards
    • Low-Field MRI
    • Alzheimer Disease
    • ASNR Foundation Special Collection
    • Photon-Counting CT
    • View All
  • Multimedia
    • AJNR Podcasts
    • AJNR SCANtastic
    • Trainee Corner
    • MRI Safety Corner
    • Imaging Protocols
  • For Authors
    • Submit a Manuscript
    • Submit a Video Article
    • Submit an eLetter to the Editor/Response
    • Manuscript Submission Guidelines
    • Statistical Tips
    • Fast Publishing of Accepted Manuscripts
    • Graphical Abstract Preparation
    • Imaging Protocol Submission
    • Author Policies
  • About Us
    • About AJNR
    • Editorial Board
    • Editorial Board Alumni
  • More
    • Become a Reviewer/Academy of Reviewers
    • Subscribers
    • Permissions
    • Alerts
    • Feedback
    • Advertisers
    • ASNR Home
  • Follow AJNR on Twitter
  • Visit AJNR on Facebook
  • Follow AJNR on Instagram
  • Join AJNR on LinkedIn
  • RSS Feeds

AJNR Awards, New Junior Editors, and more. Read the latest AJNR updates

Research ArticleBRAIN

Stereotactic Comparison among Cerebral Blood Volume, Methionine Uptake, and Histopathology in Brain Glioma

N. Sadeghi, I. Salmon, C. Decaestecker, M. Levivier, T. Metens, D. Wikler, V. Denolin, S. Rorive, N. Massager, D. Baleriaux and S. Goldman
American Journal of Neuroradiology March 2007, 28 (3) 455-461;
N. Sadeghi
  • Find this author on Google Scholar
  • Find this author on PubMed
  • Search for this author on this site
I. Salmon
  • Find this author on Google Scholar
  • Find this author on PubMed
  • Search for this author on this site
C. Decaestecker
  • Find this author on Google Scholar
  • Find this author on PubMed
  • Search for this author on this site
M. Levivier
  • Find this author on Google Scholar
  • Find this author on PubMed
  • Search for this author on this site
T. Metens
  • Find this author on Google Scholar
  • Find this author on PubMed
  • Search for this author on this site
D. Wikler
  • Find this author on Google Scholar
  • Find this author on PubMed
  • Search for this author on this site
V. Denolin
  • Find this author on Google Scholar
  • Find this author on PubMed
  • Search for this author on this site
S. Rorive
  • Find this author on Google Scholar
  • Find this author on PubMed
  • Search for this author on this site
N. Massager
  • Find this author on Google Scholar
  • Find this author on PubMed
  • Search for this author on this site
D. Baleriaux
  • Find this author on Google Scholar
  • Find this author on PubMed
  • Search for this author on this site
S. Goldman
  • Find this author on Google Scholar
  • Find this author on PubMed
  • Search for this author on this site
  • Article
  • Figures & Data
  • Info & Metrics
  • Responses
  • References
  • PDF
Loading

Article Figures & Data

Figures

  • Tables
  • Fig 1.
    • Download figure
    • Open in new tab
    • Download powerpoint
    Fig 1.

    Image processing in the case of a 67-year-old woman with left parietal mass lesion corresponding to a low-grade astrocytoma (patient 7).

    A, One of the 3 biopsy trajectories (trajectory 2) is projected into 3DT1-weighted image (TE, 20 ms; TR, 4.6 ms; flip angle, 25°; section thickness, 1.3 mm) with contrast. Note that the lesion is not enhancing.

    B–D, On coregistered FLAIR images (TR, 6500 ms; TE, 150 ms; TI, 2200 ms), the lesion is better defined as an area of high signal intensity. Biopsy trajectory 2 is shown, and the point at which the red lines cross shows the area of biopsy at the target (B) and the 2 other samples at 1 (C) and 2 (D) cm from the target.

    E-F, The position of the 3 biopsy areas at the target (0) as well as at 1 cm from the target (−10) and at 2 cm from the target (−20) are shown on both the coregistered CBV map (E) and the PET-MET image (F).

    G–I, Photomicrographs (H&E coloration; original magnification, 400×) show the corresponding histologic characteristics of each biopsy specimen. The biopsy specimen from the target (0) corresponded to “bulk tumor” (G) where vessels with endothelial cell proliferation can be identified (arrows). The biopsy specimen from point (−10) corresponded to “infiltrated tissue” (H) where 1 mitosis (small arrow) and 1 vessel without endothelial cell proliferation (large arrow) are identified. The biopsy specimen from point (−20) corresponded to “peritumoral tissue” (I), where no tumor cell could be identified and vessels show a normal shape (arrow).
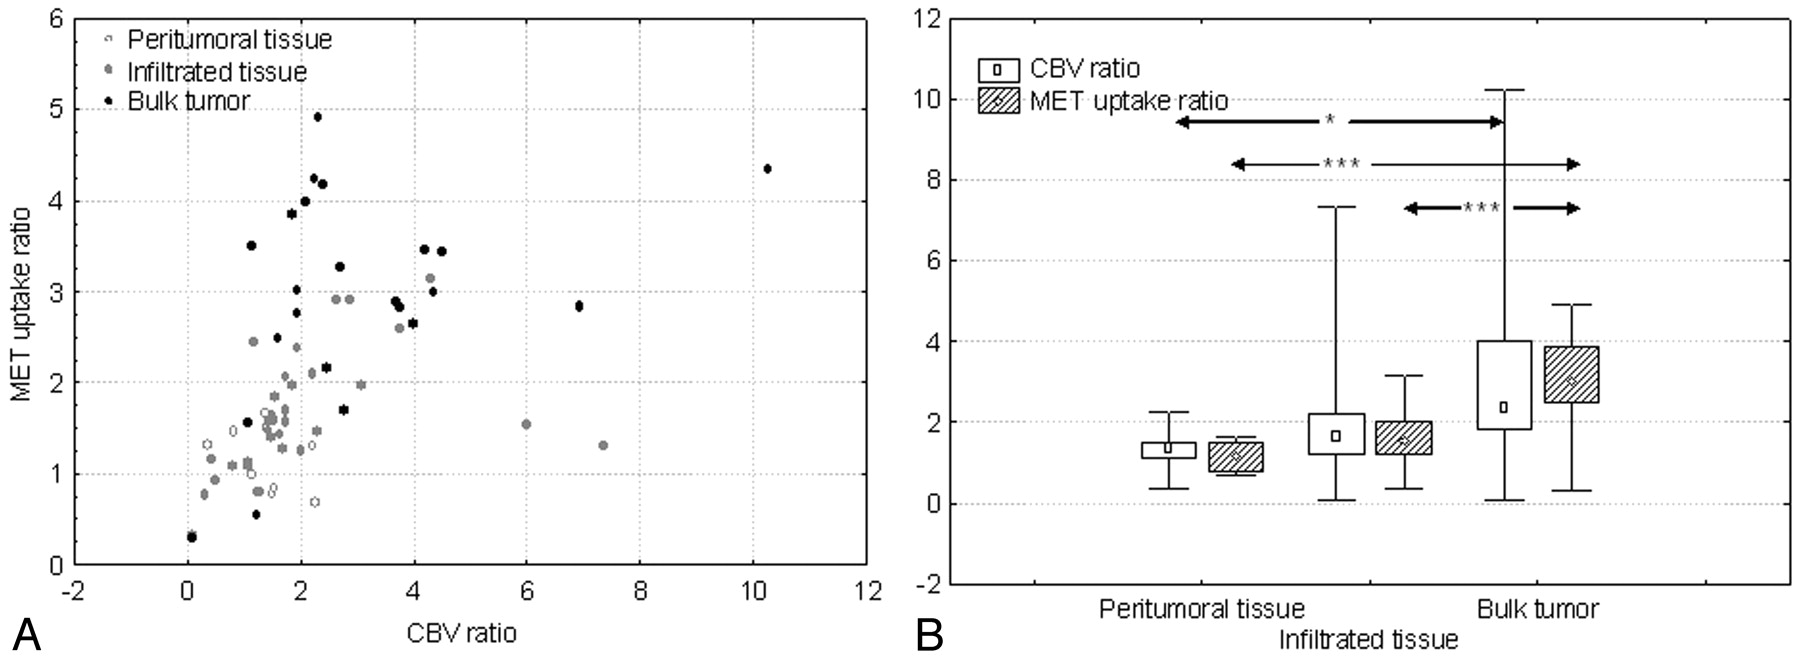
  • Fig 2.
    • Download figure
    • Open in new tab
    • Download powerpoint
    Fig 2.

    A, Scatterplot shows significant positive correlation between CBV ratios and MET uptake ratios (r = 0.65, P < .001). Measurements corresponding to “peritumoral tissue,” “infiltrated tissue,” and “bulk tumor” can also be identified.

    B, Graph shows the relation between both CBV and MET uptake ratios and the histologic categorization of samples as “peritumoral tissue” (n = 10), “infiltrated tissue” (n = 32), and “bulk tumor” (n = 23). Median values increase significantly from “peritumoral tissue” to “bulk tumor” for both CBV and MET uptake ratios. The difference was also statistically significant between “infiltrated tissue” and “bulk tumor” for MET uptake ratios. Values are presented as minimum-maximum range (whiskers), 25th–75th percentile range (box), and median (open symbols). ∗, P = .01; ∗∗∗, P < .001.

  • Fig 3.
    • Download figure
    • Open in new tab
    • Download powerpoint
    Fig 3.

    Graphs show the distribution of CBV ratios (A) and MET uptake ratios (B), respectively, in those patients with low-grade (patients 1–8) and or high-grade gliomas (patients 9–14). All samples are presented with different symbols depending on their category (○, “peritumoral tissue”; ▵, “infiltrated tissue”; □, “bulk tumor”), and different colors depending on their score on the semiquantitative scale of malignancy (blue = 1, green = 2, yellow = 3, orange = 4, red = 5; see text for details).

  • Fig 4.
    • Download figure
    • Open in new tab
    • Download powerpoint
    Fig 4.

    A, Graph shows the relation between both CBV and MET uptake ratios and the endothelial cell proliferation. The median values for both CBV and MET uptake ratios were statistically significantly higher in those areas with presence of endothelial cell proliferation (n = 18) compared with the areas without endothelial cell proliferation (n = 47).

    B, Graph shows the relation between both CBV and MET uptake ratios and mitotic activity. The median values for both CBV and MET uptake ratios were statistically significantly higher in those areas with presence of mitosis (n = 39) compared with the areas without mitosis (n = 26). Values are presented as minimum-maximum range (whiskers), 25th–75th percentile range (box), and median (open symbols). ∗∗, P = .01; ∗∗∗, P < .001.

Tables

  • Figures
  • Patient population

    Patient NoAge (years)SexHistologic DiagnosisHistologic GradeLocationNumber of Biopsy Specimens
    126FPA1R cerebellum4
    225FLA2L temporal3
    355FLA2R frontoparietal4
    439FLA2R frontal2
    519MLA2R frontotemporal11
    678FLA2R temporal3
    767FLA2L parietal8
    847MO2L frontal3
    919MAA3L frontoparietal9
    1033MAA3L temporoparietal3
    1139FO3L temporoparietal3
    1250MGB4R parietal3
    1358MGB4L temporal5
    1439MGB4Brain stem4
    • Note:—PA indicates pilocytic astrocytoma; LA, low-grade astrocytoma; O, oligodendroglioma; AA, anaplastic astrocytoma; GB, glioblastoma; L, left; R, right.

PreviousNext
Back to top

In this issue

American Journal of Neuroradiology: 28 (3)
American Journal of Neuroradiology
Vol. 28, Issue 3
March 2007
  • Table of Contents
  • Index by author
Advertisement
Print
Download PDF
Email Article

Thank you for your interest in spreading the word on American Journal of Neuroradiology.

NOTE: We only request your email address so that the person you are recommending the page to knows that you wanted them to see it, and that it is not junk mail. We do not capture any email address.

Enter multiple addresses on separate lines or separate them with commas.
Stereotactic Comparison among Cerebral Blood Volume, Methionine Uptake, and Histopathology in Brain Glioma
(Your Name) has sent you a message from American Journal of Neuroradiology
(Your Name) thought you would like to see the American Journal of Neuroradiology web site.
CAPTCHA
This question is for testing whether or not you are a human visitor and to prevent automated spam submissions.
Cite this article
N. Sadeghi, I. Salmon, C. Decaestecker, M. Levivier, T. Metens, D. Wikler, V. Denolin, S. Rorive, N. Massager, D. Baleriaux, S. Goldman
Stereotactic Comparison among Cerebral Blood Volume, Methionine Uptake, and Histopathology in Brain Glioma
American Journal of Neuroradiology Mar 2007, 28 (3) 455-461;

Citation Manager Formats

  • BibTeX
  • Bookends
  • EasyBib
  • EndNote (tagged)
  • EndNote 8 (xml)
  • Medlars
  • Mendeley
  • Papers
  • RefWorks Tagged
  • Ref Manager
  • RIS
  • Zotero
0 Responses
Respond to this article
Share
Bookmark this article
Stereotactic Comparison among Cerebral Blood Volume, Methionine Uptake, and Histopathology in Brain Glioma
N. Sadeghi, I. Salmon, C. Decaestecker, M. Levivier, T. Metens, D. Wikler, V. Denolin, S. Rorive, N. Massager, D. Baleriaux, S. Goldman
American Journal of Neuroradiology Mar 2007, 28 (3) 455-461;
del.icio.us logo Twitter logo Facebook logo Mendeley logo
  • Tweet Widget
  • Facebook Like
  • Google Plus One

Jump to section

  • Article
    • Abstract
    • Materials and Methods
    • Results
    • Discussion
    • Conclusion
    • Footnotes
    • References
  • Figures & Data
  • Info & Metrics
  • Responses
  • References
  • PDF

Related Articles

  • No related articles found.
  • PubMed
  • Google Scholar

Cited By...

  • Mitotic Activity in Glioblastoma Correlates with Estimated Extravascular Extracellular Space Derived from Dynamic Contrast-Enhanced MR Imaging
  • Comparison of 18F-FET PET and Perfusion-Weighted MR Imaging: A PET/MR Imaging Hybrid Study in Patients with Brain Tumors
  • Mammary Cancer Bone Metastasis Follow-up Using Multimodal Small-Animal MR and PET Imaging
  • 11C-Methionine Uptake Correlates with Combined 1p and 19q Loss of Heterozygosity in Oligodendroglial Tumors
  • Correlations between Perfusion MR Imaging Cerebral Blood Volume, Microvessel Quantification, and Clinical Outcome Using Stereotactic Analysis in Recurrent High-Grade Glioma
  • Imaging biomarkers of angiogenesis and the microvascular environment in cerebral tumours
  • Clinical applications of imaging biomarkers. Part 2. The neurosurgeon's perspective
  • Value of 1H-magnetic resonance spectroscopy chemical shift imaging for detection of anaplastic foci in diffusely infiltrating gliomas with non-significant contrast-enhancement
  • Correlation of MR Relative Cerebral Blood Volume Measurements with Cellular Density and Proliferation in High-Grade Gliomas: An Image-Guided Biopsy Study
  • Enhancing Fraction in Glioma and Its Relationship to the Tumoral Vascular Microenvironment: A Dynamic Contrast-Enhanced MR Imaging Study
  • Optimized Preload Leakage-Correction Methods to Improve the Diagnostic Accuracy of Dynamic Susceptibility-Weighted Contrast-Enhanced Perfusion MR Imaging in Posttreatment Gliomas
  • Crossref
  • Google Scholar

This article has not yet been cited by articles in journals that are participating in Crossref Cited-by Linking.

More in this TOC Section

  • Usefulness of Quantitative Susceptibility Mapping for the Diagnosis of Parkinson Disease
  • White Matter Alterations in the Brains of Patients with Active, Remitted, and Cured Cushing Syndrome: A DTI Study
  • Qualitative and Quantitative Analysis of MR Imaging Findings in Patients with Middle Cerebral Artery Stroke Implanted with Mesenchymal Stem Cells
Show more Brain

Similar Articles

Advertisement

Indexed Content

  • Current Issue
  • Accepted Manuscripts
  • Article Preview
  • Past Issues
  • Editorials
  • Editor's Choice
  • Fellows' Journal Club
  • Letters to the Editor
  • Video Articles

Cases

  • Case Collection
  • Archive - Case of the Week
  • Archive - Case of the Month
  • Archive - Classic Case

More from AJNR

  • Trainee Corner
  • Imaging Protocols
  • MRI Safety Corner
  • Book Reviews

Multimedia

  • AJNR Podcasts
  • AJNR Scantastics

Resources

  • Turnaround Time
  • Submit a Manuscript
  • Submit a Video Article
  • Submit an eLetter to the Editor/Response
  • Manuscript Submission Guidelines
  • Statistical Tips
  • Fast Publishing of Accepted Manuscripts
  • Graphical Abstract Preparation
  • Imaging Protocol Submission
  • Evidence-Based Medicine Level Guide
  • Publishing Checklists
  • Author Policies
  • Become a Reviewer/Academy of Reviewers
  • News and Updates

About Us

  • About AJNR
  • Editorial Board
  • Editorial Board Alumni
  • Alerts
  • Permissions
  • Not an AJNR Subscriber? Join Now
  • Advertise with Us
  • Librarian Resources
  • Feedback
  • Terms and Conditions
  • AJNR Editorial Board Alumni

American Society of Neuroradiology

  • Not an ASNR Member? Join Now

© 2025 by the American Society of Neuroradiology All rights, including for text and data mining, AI training, and similar technologies, are reserved.
Print ISSN: 0195-6108 Online ISSN: 1936-959X

Powered by HighWire