Advertisement

Main menu

  • Home
  • Content
    • Current Issue
    • Accepted Manuscripts
    • Article Preview
    • Past Issue Archive
    • Video Articles
    • AJNR Case Collection
    • Case of the Week Archive
    • Case of the Month Archive
    • Classic Case Archive
  • Special Collections
    • AJNR Awards
    • Low-Field MRI
    • Alzheimer Disease
    • ASNR Foundation Special Collection
    • Photon-Counting CT
    • View All
  • Multimedia
    • AJNR Podcasts
    • AJNR SCANtastic
    • Trainee Corner
    • MRI Safety Corner
    • Imaging Protocols
  • For Authors
    • Submit a Manuscript
    • Submit a Video Article
    • Submit an eLetter to the Editor/Response
    • Manuscript Submission Guidelines
    • Statistical Tips
    • Fast Publishing of Accepted Manuscripts
    • Graphical Abstract Preparation
    • Imaging Protocol Submission
    • Author Policies
  • About Us
    • About AJNR
    • Editorial Board
    • Editorial Board Alumni
  • More
    • Become a Reviewer/Academy of Reviewers
    • Subscribers
    • Permissions
    • Alerts
    • Feedback
    • Advertisers
    • ASNR Home

User menu

  • Alerts
  • Log in

Search

  • Advanced search
American Journal of Neuroradiology

American Journal of Neuroradiology

ASHNR American Society of Functional Neuroradiology ASHNR American Society of Pediatric Neuroradiology ASSR
  • Alerts
  • Log in

Advanced Search

  • Home
  • Content
    • Current Issue
    • Accepted Manuscripts
    • Article Preview
    • Past Issue Archive
    • Video Articles
    • AJNR Case Collection
    • Case of the Week Archive
    • Case of the Month Archive
    • Classic Case Archive
  • Special Collections
    • AJNR Awards
    • Low-Field MRI
    • Alzheimer Disease
    • ASNR Foundation Special Collection
    • Photon-Counting CT
    • View All
  • Multimedia
    • AJNR Podcasts
    • AJNR SCANtastic
    • Trainee Corner
    • MRI Safety Corner
    • Imaging Protocols
  • For Authors
    • Submit a Manuscript
    • Submit a Video Article
    • Submit an eLetter to the Editor/Response
    • Manuscript Submission Guidelines
    • Statistical Tips
    • Fast Publishing of Accepted Manuscripts
    • Graphical Abstract Preparation
    • Imaging Protocol Submission
    • Author Policies
  • About Us
    • About AJNR
    • Editorial Board
    • Editorial Board Alumni
  • More
    • Become a Reviewer/Academy of Reviewers
    • Subscribers
    • Permissions
    • Alerts
    • Feedback
    • Advertisers
    • ASNR Home
  • Follow AJNR on Twitter
  • Visit AJNR on Facebook
  • Follow AJNR on Instagram
  • Join AJNR on LinkedIn
  • RSS Feeds

AJNR Awards, New Junior Editors, and more. Read the latest AJNR updates

Research ArticleBrain

Advantages and Pitfalls in 3T MR Brain Imaging: A Pictorial Review

Bernd L. Schmitz, Andrik J. Aschoff, Martin H.K. Hoffmann and Georg Grön
American Journal of Neuroradiology October 2005, 26 (9) 2229-2237;
Bernd L. Schmitz
  • Find this author on Google Scholar
  • Find this author on PubMed
  • Search for this author on this site
Andrik J. Aschoff
  • Find this author on Google Scholar
  • Find this author on PubMed
  • Search for this author on this site
Martin H.K. Hoffmann
  • Find this author on Google Scholar
  • Find this author on PubMed
  • Search for this author on this site
Georg Grön
  • Find this author on Google Scholar
  • Find this author on PubMed
  • Search for this author on this site
  • Article
  • Figures & Data
  • Info & Metrics
  • Responses
  • References
  • PDF
Loading

Article Figures & Data

Figures

  • Fig 1.
    • Download figure
    • Open in new tab
    • Download powerpoint
    Fig 1.

    Comparison of the theoretical signal intensity increase when increasing NEX (gray line) or field strength (B0, black line). To reach the same signal intensity one can get from the doubling field strength, the acquisition time is 4 times longer (circles). Numbers along the x axis refer to levels of NEX and B0, respectively.

  • Fig 2.
    • Download figure
    • Open in new tab
    • Download powerpoint
    Fig 2.

    Theoretic increase in relative signal intensity for NEX and field strengths B0 (gray lines) as in Fig 1. Note the relative increase in SAR related to field strength (black line). Although signal intensity linearly increases with field strengths, SAR increases with the square of field strengths. Values on the y axis are arbitrary units solely to demonstrate the relationship between the increases of different parameters in one graph.

  • Fig 3.
    • Download figure
    • Open in new tab
    • Download powerpoint
    Fig 3.

    Chemical shift artifacts at different bandwidths at 1.5 (upper row: TR, 172 ms; TE, 9 ms; field of view [FOV], 220 × 220 mm2; matrix, 256 × 192) and 3T (lower row: TR, 206 ms; TE, 10 ms; section thickness, 5 mm; FOV, 220 × 220 mm2; matrix, 256 × 192). Bandwidth increases from left to right (60, 120, 240, 480 Hz/pixel), resulting in chemical shift of 7.4, 3.7, 1.9, and 0.9 pixels, respectively, at 3T, and half of these values at 1.5T. Note the double line of the occipital subcutaneous tissue at lower bandwidths (between white arrows). Of note also is the increasing noise at higher bandwidths.

  • Fig 4.
    • Download figure
    • Open in new tab
    • Download powerpoint
    Fig 4.

    T2 turbo spin-echo (left) and hyperecho (right) of the same section position and with all other parameters kept equal (TR, 3810 ms; TE, 78 ms; matrix, 832 × 416; FOV, 220 × 220 mm2; echo train length [ETL] 9; section thickness, 5 mm; bandwidth, 145 Hz/pixel; flip angle, 120°), demonstrating that there is no difference in image contrast while SAR was significantly reduced.

  • Fig 5.
    • Download figure
    • Open in new tab
    • Download powerpoint
    Fig 5.

    Gradient echo T1 (left: TR, 311 ms; TE, 2.5 ms; section thickness, 5 mm; matrix, 512 × 256; FOV, 220 × 220 mm2; bandwidth, 465 Hz/pixel; flip angle, 90°) compared with T1 spin-echo (right: TR, 700 ms; TE, 10 ms; section thickness, 5 mm; matrix, 256 × 192; FOV, 220 × 220 mm2; bandwidth, 200 Hz/pixel; flip angle, 90°) in the same subject at 3T, which indicates higher contrast in gradient echo than spin-echo sequences at 3T.
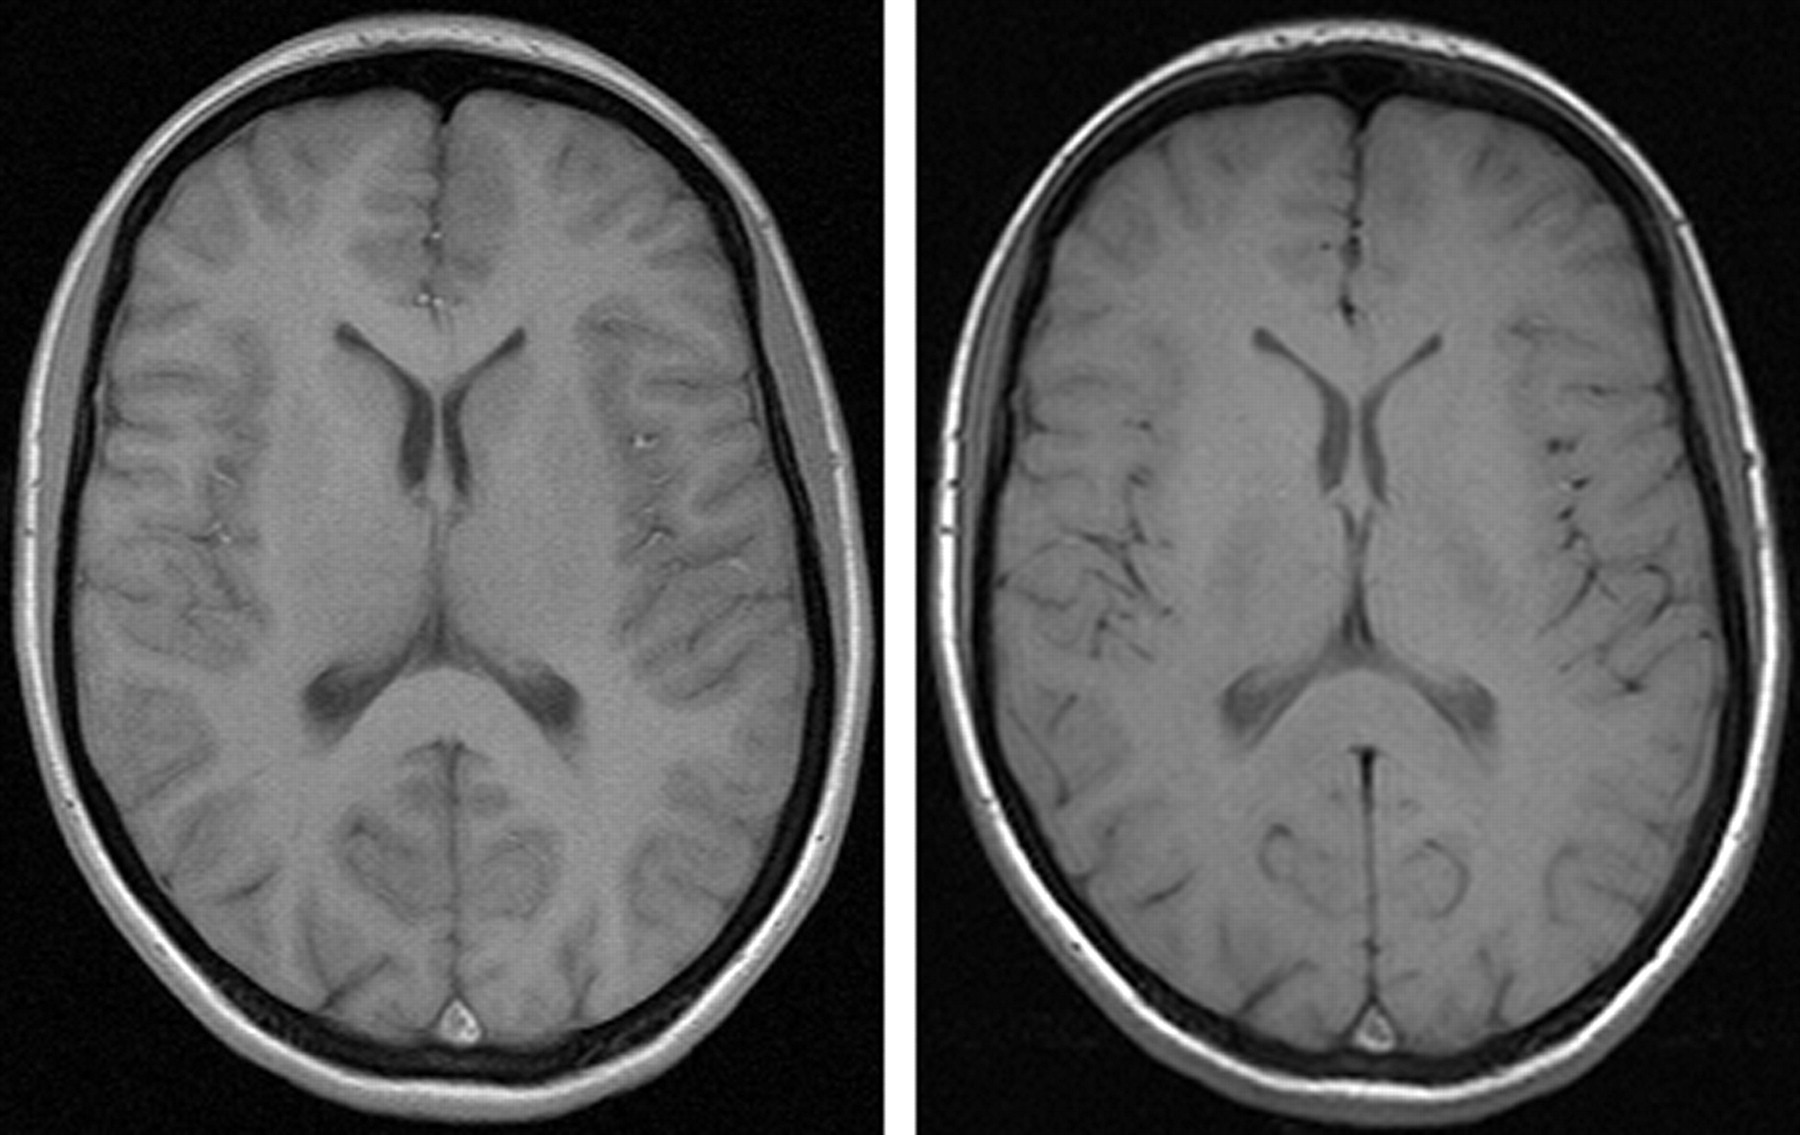
  • Fig 6.
    • Download figure
    • Open in new tab
    • Download powerpoint
    Fig 6.

    Left, T1 spin-echo image at 1.5T (TR, 600 ms; TE, 14 ms; bandwidth, 90 Hz/pixel; section thickness, 5 mm; matrix, 256 × 192; FOV, 220 × 220 mm2; flip angle, 90°). Right, T1 spin-echo at 3T (TR, 700 ms; TE, 10 ms; section thickness, 5 mm; 19 sections; bandwidth, 200 Hz/pixel; matrix, 256 × 192; FOV, 220 × 220 mm2; flip angle, 90°), which is indicative of the reduced gray-to-white matter contrast at higher fields.

  • Fig 7.
    • Download figure
    • Open in new tab
    • Download powerpoint
    Fig 7.

    Turbo inversion recovery (TIR) sequence at 1.5T (left: TR, 8770 ms; TE, 92 ms; TI, 300; matrix, 512 × 256; section thickness, 3 mm; FOV, 220 × 220 mm2; bandwidth, 130 Hz/pixel) and 3T (right: TR, 8890 ms; TE, 95 ms; TI, 300; all other parameters equal), which demonstrates clear depiction of gray and white matter at both field strengths.
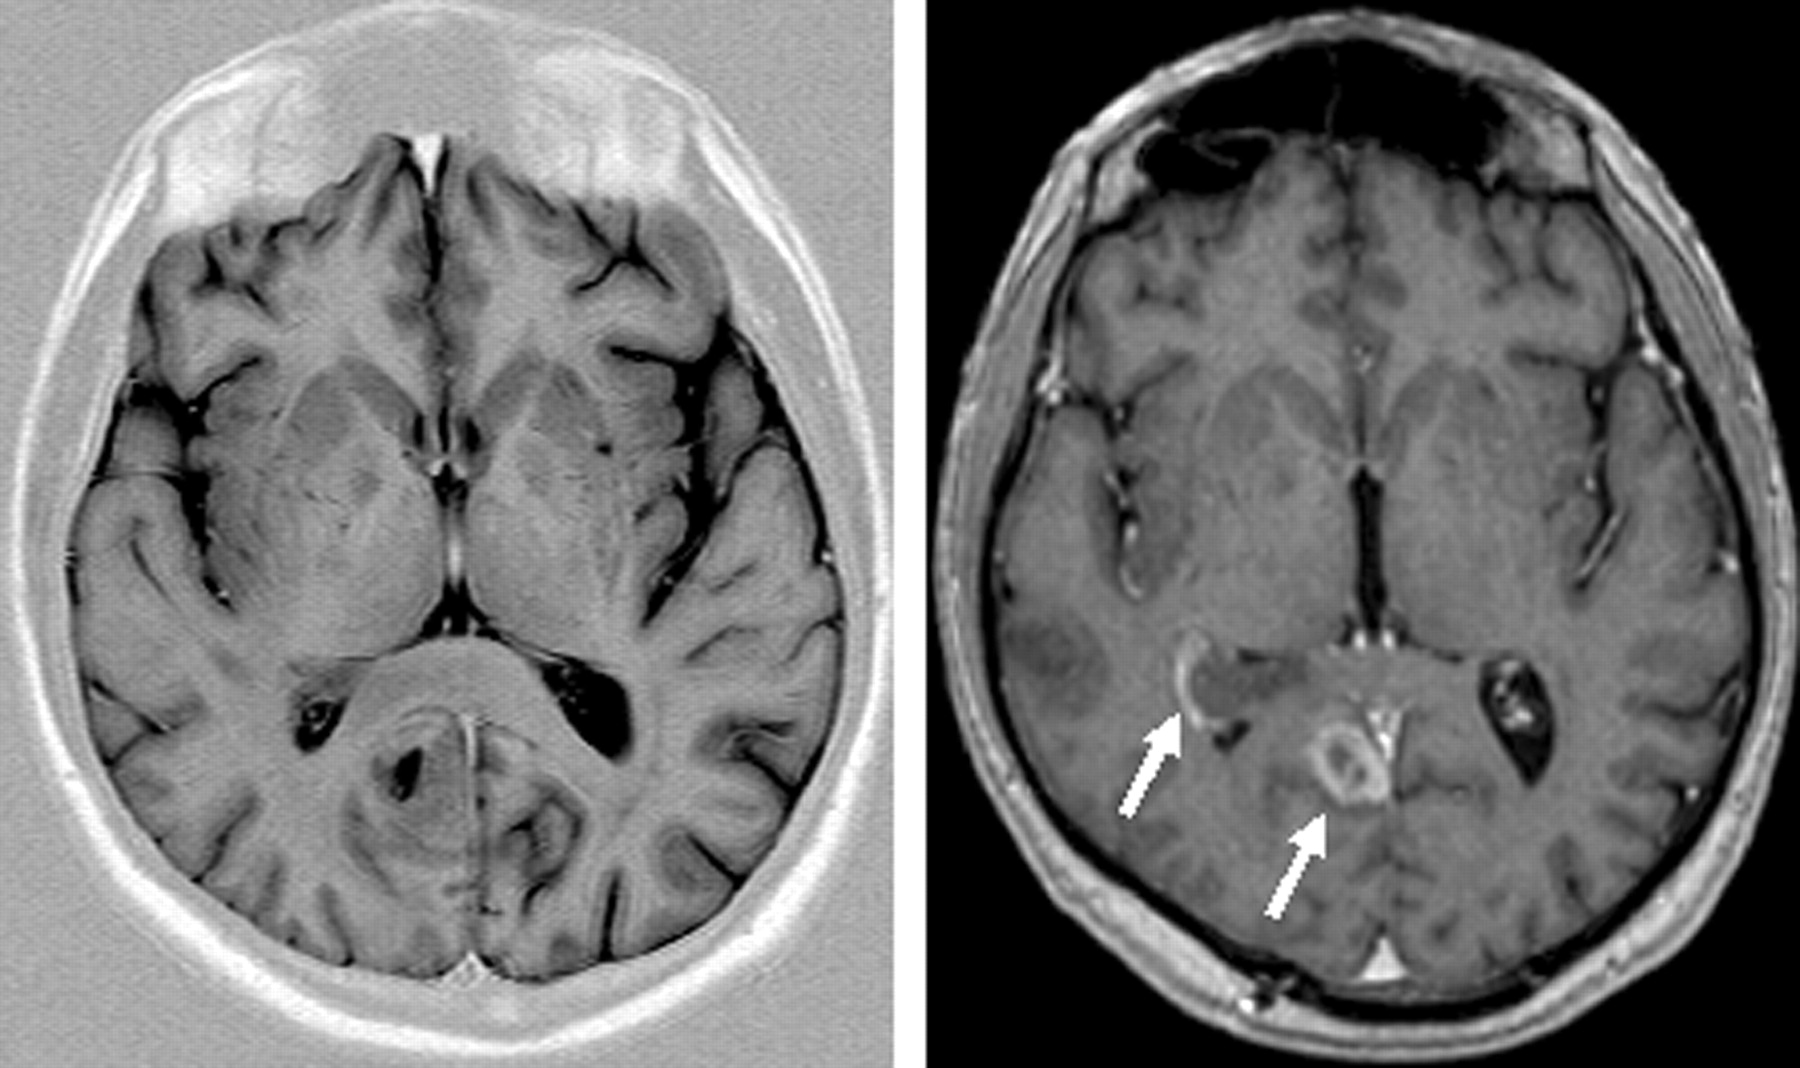
  • Fig 8.
    • Download figure
    • Open in new tab
    • Download powerpoint
    Fig 8.

    Same axial section position of a TIR (TR, 7670 ms; TE, 68 ms; TI, 300; ETL, 15; matrix, 448 × 224; section thickness, 4.5 mm; bandwidth, 130 Hz/pixel; flip angle, 150°) and T1 sequence (magnetization-preparation rapid gradient echo TR, 1880 ms; TE, 3.7 ms; matrix, 256 × 230; FOV, 256 × 256 mm2; section thickness, 5 mm, reconstructed from 1.0 mm primarily; bandwidth, 160 Hz/pixel; flip angle, 8°) after contrast agent in a patient with a contrast-enhancing lesion. Note the absent contrast enhancement in the TIR image (white arrows in the T1 image).

  • Fig 9.
    • Download figure
    • Open in new tab
    • Download powerpoint
    Fig 9.

    Same section position with spin-echo T1-weighted sequences at 1.5T (upper row: TR, 700 ms; TE, 10 ms; section thickness, 5 mm; matrix, 256 × 192; FOV, 220 × 220 mm2; bandwidth, 200 Hz/pixel) and 3T (lower row: same imaging parameters). Flip angles decreasing from left to right 130°, 110°, 90°, 70°, 50°. The lowest flip angle shows the best gray-to-white matter contrast. The effect is stronger at higher field.

  • Fig 10.
    • Download figure
    • Open in new tab
    • Download powerpoint
    Fig 10.

    Patient with multiple cavernomas inducing large susceptibility artifacts in T2* imaging at 3T, which is indicative of the high sensitivity for susceptibility effects at 3T (TR, 800 ms; TE, 26 ms; flip angle, 20°; bandwidth, 80 Hz/pixel; section thickness, 5 mm; matrix, 320 × 320; FOV, 220 × 220 mm2).

  • Fig 11.
    • Download figure
    • Open in new tab
    • Download powerpoint
    Fig 11.

    Empirical data from a blocked finger tapping fMRI study at 1.5T and 3T comparing BOLD signal intensity strength in terms of statistical effect sizes (beta values from a linear regression equation; units are arbitrary) at different TEs (54 volumes scanned, a stimulus onset asynchrony of 16 volumes, and an epoch length of 8 volumes. Beta values were computed from scaled episeries within the general linear model by using SPM 99). There is a more than linear increase in BOLD signal intensity with higher field strength.

  • Fig 12.
    • Download figure
    • Open in new tab
    • Download powerpoint
    Fig 12.

    Comparison of susceptibility artifacts at the skull base for 1.5T and 3T at different TEs, keeping all other parameters equal (TR, 4500 ms; isotropic voxel size, 3.3 mm; 48 sections; bandwidth, 2170 Hz/pixel). Artifacts are larger at any TE for 3T and increase with rising TE for both field strengths. At low TE, however, skull base artifacts are tolerable at 3T.

  • Fig 13.
    • Download figure
    • Open in new tab
    • Download powerpoint
    Fig 13.

    Same section position in axial EPI images of the same subject (TR, 4090 ms; TE, 54 ms; isotropic voxel size, 3.3 mm; 36 sections at 3.0T). Decrease of susceptibility effects with increasing bandwidth (in Hz/pixel) due to shorter echo spacing and duration of EPI readout. At low bandwidths (752 Hz/pixel, in this example), distortion effects from the frontal sinus are clearly obvious; however, very high bandwidths (4882 Hz/pixel) do not yield a significant further reduction of distortions that are already achieved with bandwidths at 2520 Hz/pixel.

  • Fig 14.
    • Download figure
    • Open in new tab
    • Download powerpoint
    Fig 14.

    Comparison of EPI with different voxel size regarding susceptibility artifacts at 3T. (A) Thinner sections (matrix, 64 × 64; TR 4500 ms; TE, 38 ms; bandwidth, 2170 Hz/pixel; FOV, 190 × 190 mm2; 53 sections; section thickness, 2 and 5 mm) and (B) smaller in-plane voxel sizes (matrix, 128 × 128; all other parameters same as in A) result in fewer susceptibility artifacts, especially in frontobasal regions.

  • Fig 15.
    • Download figure
    • Open in new tab
    • Download powerpoint
    Fig 15.

    Maximum intensity projection of a time-of-flight angiography (TR, 28 ms; TE, 4.92 ms; matrix, 704 × 576; FOV, 163 × 200 mm2; 92 sections; section thickness, 0.75 mm; bandwidth, 105 Hz/pixel; flip angle, 25°) at 3T showing the clear depiction of even very small vessels.

PreviousNext
Back to top

In this issue

American Journal of Neuroradiology: 26 (9)
American Journal of Neuroradiology
Vol. 26, Issue 9
1 Oct 2005
  • Table of Contents
  • Index by author
Advertisement
Print
Download PDF
Email Article

Thank you for your interest in spreading the word on American Journal of Neuroradiology.

NOTE: We only request your email address so that the person you are recommending the page to knows that you wanted them to see it, and that it is not junk mail. We do not capture any email address.

Enter multiple addresses on separate lines or separate them with commas.
Advantages and Pitfalls in 3T MR Brain Imaging: A Pictorial Review
(Your Name) has sent you a message from American Journal of Neuroradiology
(Your Name) thought you would like to see the American Journal of Neuroradiology web site.
CAPTCHA
This question is for testing whether or not you are a human visitor and to prevent automated spam submissions.
Cite this article
Bernd L. Schmitz, Andrik J. Aschoff, Martin H.K. Hoffmann, Georg Grön
Advantages and Pitfalls in 3T MR Brain Imaging: A Pictorial Review
American Journal of Neuroradiology Oct 2005, 26 (9) 2229-2237;

Citation Manager Formats

  • BibTeX
  • Bookends
  • EasyBib
  • EndNote (tagged)
  • EndNote 8 (xml)
  • Medlars
  • Mendeley
  • Papers
  • RefWorks Tagged
  • Ref Manager
  • RIS
  • Zotero
0 Responses
Respond to this article
Share
Bookmark this article
Advantages and Pitfalls in 3T MR Brain Imaging: A Pictorial Review
Bernd L. Schmitz, Andrik J. Aschoff, Martin H.K. Hoffmann, Georg Grön
American Journal of Neuroradiology Oct 2005, 26 (9) 2229-2237;
del.icio.us logo Twitter logo Facebook logo Mendeley logo
  • Tweet Widget
  • Facebook Like
  • Google Plus One

Jump to section

  • Article
    • Theoretical Advantages and Disadvantages of MR Imaging at 3T
    • Practical Considerations Combined with Imaging at 3T
    • Conclusion
    • Footnotes
    • References
  • Figures & Data
  • Info & Metrics
  • Responses
  • References
  • PDF

Related Articles

  • No related articles found.
  • PubMed
  • Google Scholar

Cited By...

  • Diagnostic Performance of TOF, 4D MRA, Arterial Spin-Labeling, and Susceptibility-Weighted Angiography Sequences in the Post-Radiosurgery Monitoring of Brain AVMs
  • Clinical and Pathophysiologic Correlates of Basilar Artery Measurements in Fabry Disease
  • High-Resolution MRA Cerebrovascular Findings in a Tri-Ethnic Population
  • Assessment of Heating on Titanium Alloy Cerebral Aneurysm Clips during 7T MRI
  • Comparison of structural MRI brain measures between 1.5T and 3T: data from the Lothian Birth Cohort 1936
  • Brain Tumor-Enhancement Visualization and Morphometric Assessment: A Comparison of MPRAGE, SPACE, and VIBE MRI Techniques
  • Susceptibility-Weighted Angiography for the Follow-Up of Brain Arteriovenous Malformations Treated with Stereotactic Radiosurgery
  • Comparison of Dynamic Contrast-Enhanced 3T MR and 64-Row Multidetector CT Angiography for the Localization of Spinal Dural Arteriovenous Fistulas
  • Blood Flow of Ophthalmic Artery in Healthy Individuals Determined by Phase-Contrast Magnetic Resonance Imaging
  • Can 3T MR Angiography Replace DSA for the Identification of Arteries Feeding Intracranial Meningiomas?
  • High-Resolution 3D-Constructive Interference in Steady-State MR Imaging and 3D Time-of-Flight MR Angiography in Neurovascular Compression: A Comparison between 3T and 1.5T
  • Normal Pituitary Stalk: High-Resolution MR Imaging at 3T
  • 3T MR Imaging of Postoperative Recurrent Middle Ear Cholesteatomas: Value of Periodically Rotated Overlapping Parallel Lines with Enhanced Reconstruction Diffusion-Weighted MR Imaging
  • Crossref
  • Google Scholar

This article has not yet been cited by articles in journals that are participating in Crossref Cited-by Linking.

More in this TOC Section

  • Optimal MRI Sequence for Identifying Occlusion Location in Acute Stroke: Which Value of Time-Resolved Contrast-Enhanced MRA?
  • Evaluating the Effects of White Matter Multiple Sclerosis Lesions on the Volume Estimation of 6 Brain Tissue Segmentation Methods
  • Quiet PROPELLER MRI Techniques Match the Quality of Conventional PROPELLER Brain Imaging Techniques
Show more Brain

Similar Articles

Advertisement

Indexed Content

  • Current Issue
  • Accepted Manuscripts
  • Article Preview
  • Past Issues
  • Editorials
  • Editor's Choice
  • Fellows' Journal Club
  • Letters to the Editor
  • Video Articles

Cases

  • Case Collection
  • Archive - Case of the Week
  • Archive - Case of the Month
  • Archive - Classic Case

More from AJNR

  • Trainee Corner
  • Imaging Protocols
  • MRI Safety Corner
  • Book Reviews

Multimedia

  • AJNR Podcasts
  • AJNR Scantastics

Resources

  • Turnaround Time
  • Submit a Manuscript
  • Submit a Video Article
  • Submit an eLetter to the Editor/Response
  • Manuscript Submission Guidelines
  • Statistical Tips
  • Fast Publishing of Accepted Manuscripts
  • Graphical Abstract Preparation
  • Imaging Protocol Submission
  • Evidence-Based Medicine Level Guide
  • Publishing Checklists
  • Author Policies
  • Become a Reviewer/Academy of Reviewers
  • News and Updates

About Us

  • About AJNR
  • Editorial Board
  • Editorial Board Alumni
  • Alerts
  • Permissions
  • Not an AJNR Subscriber? Join Now
  • Advertise with Us
  • Librarian Resources
  • Feedback
  • Terms and Conditions
  • AJNR Editorial Board Alumni

American Society of Neuroradiology

  • Not an ASNR Member? Join Now

© 2025 by the American Society of Neuroradiology All rights, including for text and data mining, AI training, and similar technologies, are reserved.
Print ISSN: 0195-6108 Online ISSN: 1936-959X

Powered by HighWire