
Article Figures & Data
Figures
- Fig 1.
A 22-year-old man with low-grade oligoastocytoma (WHO II) in left frontoparietal lobe.
A, Axial T2-weighted spin-echo image (2295/90) shows hyperintense mass involving left insula and temporal operculum.
B, Tumor does not demonstrate contrast-enhancement on axial T1-weighted image (583/15), which suggests a LGGT.
C, Gradient-echo axial perfusion MR image (627/30) with rCBV color overlay map shows a low rCBVT value of 1.50 and rCBVP value of 1.18, in keeping with LGGTs.
D, Time-signal intensity and gamma-variate fitted curves from tumoral (red), peritumoral (blue), and normal (purple) areas show prominent decrease in signal intensity from tumoral area. Decreased signal intensity in peritumoral area is at least equal to that of normal gray matter.
- Fig 2.
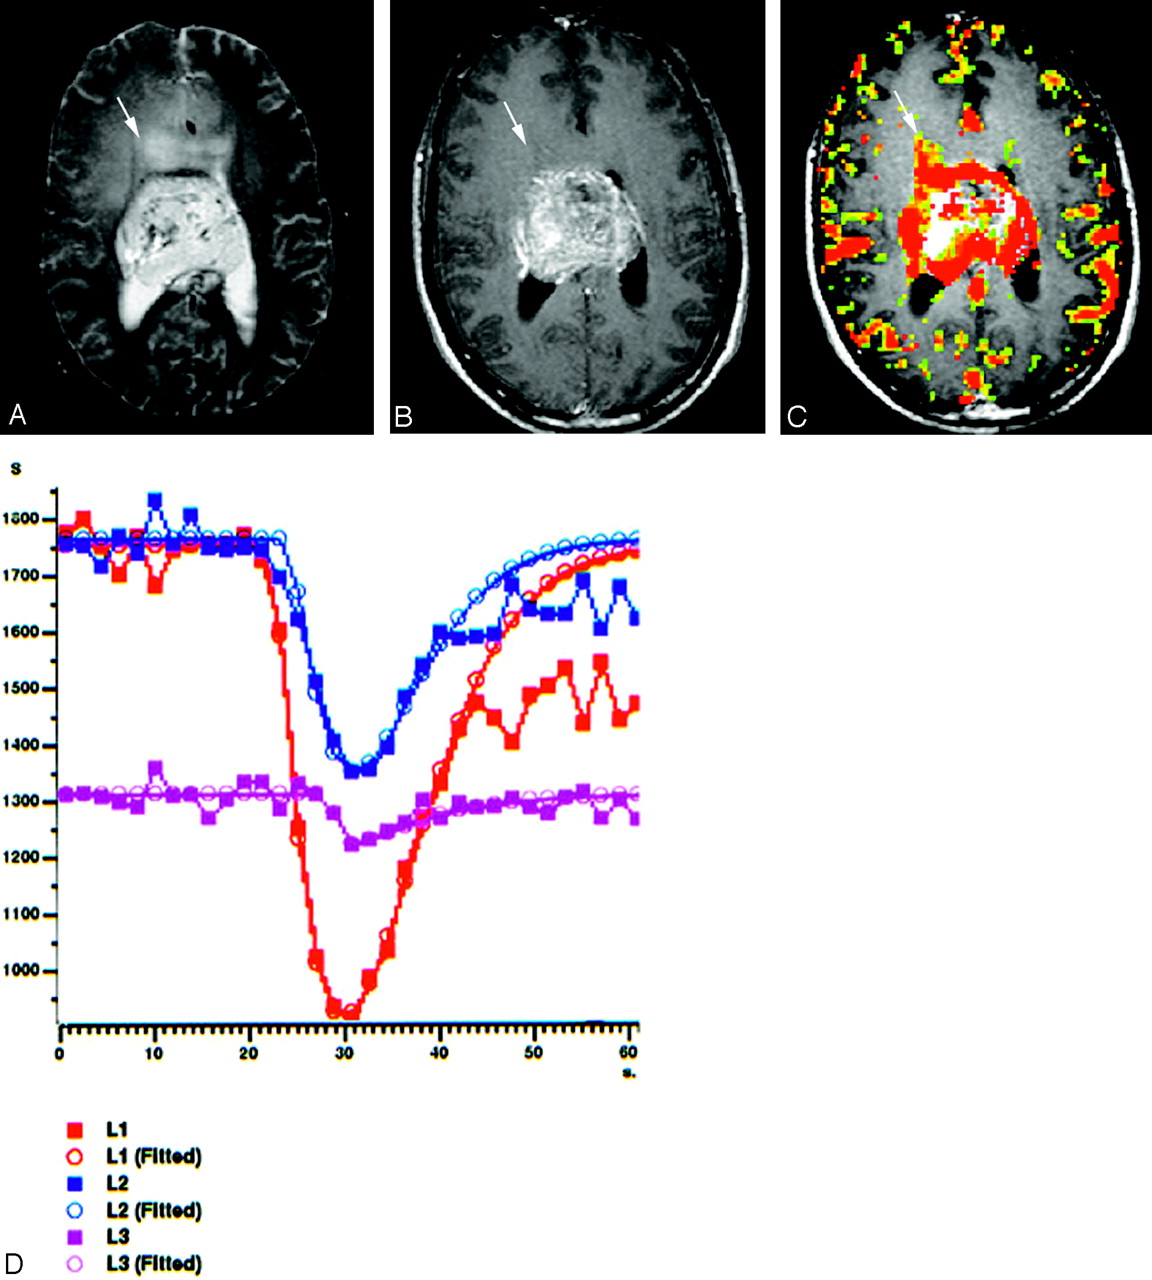
A 22-year-old man with centrally located glioblastoma multiforme (WHO IV).
A, Tumor shows heterogeneous hyperintensity with prominent peritumoral edema and/or tumoral infiltration (arrow) on axial T2-weighted SE image (2295/90).
B, There is a significant heterogeneous enhancement in tumoral borders but not in peritumoral area (arrow) on axial T1-weighted image (583/15).
C, Gradient-echo axial perfusion MR image (627/30) with rCBV color overlay map shows both high rCBVT value of 6.58 and rCBVP value of 2.21, which are consistent with HGGT. Peritumoral increased rCBV (arrow) shows tumoral infiltration outside the tumoral margins, which is not perceptible on T2- and contrast-enhanced T1-weighted images.
D, Time-signal intensity and gamma-variate fitted curves from tumoral (red), peritumoral (blue), and normal (purple) areas show prominent decrease in signal intensity from tumoral and peritumoral areas, when compared with signal intensity of normal gray matter.
- Fig 3.
Scatter plots of the tumoral (A–C) and peritumoral (D–E) rCBV values of different tumor groups show that higher rCBV values are linearly related to higher degree malignancy. Lines are fitted by linear regression with 95% confidence interval. LGGT indicates low-grade glial tumor; HGGT, high-grade glial tumor; MET, metastasis; LGA, low-grade astrocytoma; LGMT, low-grade mixed tumor; HGA, high-grade astrocytoma; HGMT, high-grade mixed tumor; DAS, diffuse astrocytoma; PAS, pilocytic astrocytoma; AAS, anaplastic astrocytoma; GBM, glioblastoma multiforme.
- Fig 4.
Correlation plots of individual data points show linear correlation between tumoral and peritumoral rCBV values of different tumor groups. Lines are fitted by linear regression with 95% confidence interval.
- Fig 5.
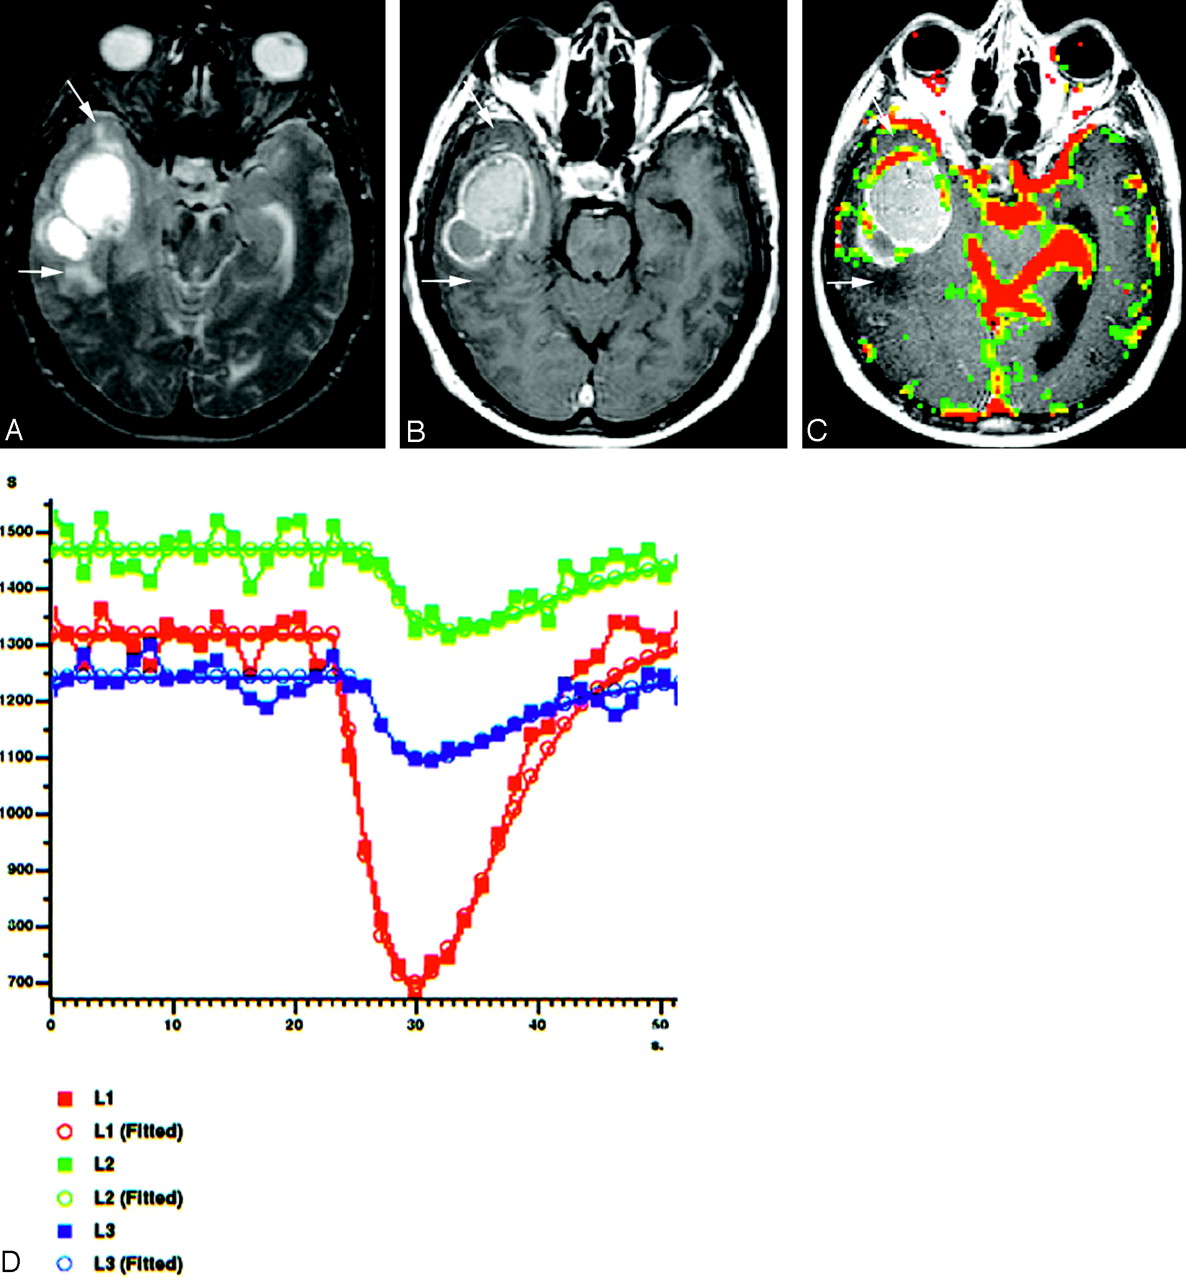
A 51-year-old man with cystic METs from lung carcinoma located in right temporal lobe.
A, Axial T2-weighted spin-echo image (2295/90), shows hyperintense cystic mass with peritumoral edema and/or infiltration (arrows).
B, Axial contrast-enhanced T1-weighted image (583/15) reveals an irregularly ringlike enhancing mass without any peritumoral contrast enhancement (arrows).
C, Gradient-echo axial perfusion MR image (627/30) with rCBV color overlay map shows a high rCBVT value of 3.05 but low rCBVP value of 1.05, which is consistent with METs. No rCBV increase is present on peritumoral area (arrows).
D, Time-signal intensity and gamma-variate fitted curves from tumoral (red), peritumoral (green), and normal (blue) areas show prominent decrease in signal intensity from tumoral area. Decreased signal intensity in peritumoral area is at least equal to or less than that of normal gray matter.
- Fig 6.
A 20-year-old man with pilocytic astocytoma (WHO I) in the brain stem.
A, Axial T2-weighted spin-echo image (2295/90), shows hyperintense mass involving brain stem without significant peritumoral edema.
B, Tumor strongly enhances on postcontrast axial T1-weighted image (583/15), which suggests a HGGT.
C, Gradient-echo axial perfusion MR image (627/30) with rCBV color overlay map shows no significant perfusion with a low rCBVT value of 1.14 and rCBVP value of 0.88, in keeping with a LGGT. Very low rCBVP value helps to differentiate it from low-grade astrocytomas (WHO II).
D, Time-signal intensity and gamma-variate fitted curves from tumoral (red), peritumoral (blue), and normal (yellow) areas show prominent decrease in signal intensity from tumoral area. Decreased signal intensity in peritumoral area is similar to that of normal gray matter.


Tables
Tumor Type* n (%) Parameter Mean/SD/SE 95% CI for Mean Range LGGT (I–II/IV) 36/75 (48.00) rCBVT 2.30/1.12/0.19 1.92–2.68 0.84–5.73 rCBVP 1.18/0.24/0.04 1.10–1.26 0.77–1.86 LGAT (I–II/IV) 24/75 (32.00) rCBVT 1.75/0.38/0.08 1.59–1.91 0.84–2.52 rCBVP 1.15/0.23/0.05 1.05–1.25 0.77–1.86 LGODG (II/IV) 12/75 (16.00) rCBVT 3.40/1.29/0.37 2.59–4.22 1.73–5.73 rCBVP 1.23/0.25/0.07 1.07–1.38 0.87–1.83 HGGT (III–IV/IV) 22/75 (29.33) rCBVT 5.42/1.52/0.33 4.74–6.09 3.15–8.96 rCBVP 2.17/0.82/0.18 1.80–2.53 1.00–4.14 HGAT (III–IV/IV) 15/75 (20.00) rCBVT 4.78/0.99/0.26 4.23–5.33 3.15–6.58 rCBVP 1.99/0.59/0.15 1.66–2.31 1.00–3.09 HGODG (III/IV) 7/75 (9.33) rCBVT 6.78/1.63/0.62 5.27–8.29 4.55–8.96 rCBVP 2.55/1.15/0.43 1.49–3.61 1.23–4.14 MET 17/75 (22.67) rCBVT 3.21/0.98/0.24 2.70–3.71 1.27–5.60 rCBVP 0.97/0.09/0.02 0.93–1.02 0.80–1.13 Note.—LGGT indicates low-grade glial tumor; LGAT, low-grade astrocytic tumor; LGODG, low-grade oligodendroglioma; HGGT, high-grade glial tumor; HGAT, high-grade astrocytic tumor; HGODG, high-grade oligodendroglioma; MET, metastasis; rCBVT, tumoral relative cerebral blood volume; rCBVP, peritumoral relative cerebral blood volume.
* Roman numerals in parentheses show tumor grade according to the World Health Organization 2000 classification scheme.
Tumor Type* n (%) Parameter Mean/SD/SE 95% CI for Mean Range PAS (I/IV) 10/75 (13.33) rCBVT 1.71/0.45/0.14 1.39–2.03 0.84–2.52 rCBVP 0.97/0.14/0.05 0.87–1.07 0.77–1.29 DAS (II/IV) 14/75 (18.67) rCBVT 1.78/0.35/0.09 1.58–1.98 1.29–2.43 rCBVP 1.28/0.19/0.05 1.17–1.39 1.07–1.86 Note.—PAS indicates pilocytic astrocytoma; DAS, diffuse astrocytoma; rCBVT, tumoral relative cerebral blood volume; rCBVP, peritumoral relative cerebral blood volume.
* Roman numerals in parentheses show tumor grade according to the World Health Organization 2000 classification scheme.
Tumor Type* n (%) Parameter Mean/SD/SE 95% CI for Mean Range AAS (III/IV) 4/75 (5.33) rCBVT 4.09/0.06/0.03 3.99–4.19 4.04–4.18 rCBVP 1.92/0.43/0.22 1.23–2.61 1.28–2.19 GBM (IV/IV) 11/75 (14.67) rCBVT 5.03/1.05/0.32 4.32–5.74 3.15–6.58 rCBVP 2.01/0.65/0.20 1.58–2.45 1.00–3.09 Note.—AAS indicates anaplastic astrocytoma; GBM, glioblastoma multiforme; rCBVT, tumoral relative cerebral blood volume; rCBVP, peritumoral relative cerebral blood volume.
* Roman numerals in parentheses show tumor grade according to the World Health Organization 2000 classification scheme.
- TABLE 4:
Statistically significant lowest cutoff rCBVT values tested for different mean differences
Parameter Cutoff rCBVT Values For Grading* For Differentiation† 3.9a 2.6b 4.3c 2.3d 3.9e 2.3f 3.9g 3.9h 2.2i 2.3j 3.9k 3.9l 2.3m 2.2n 2.5o ROC area 0.936 1.000 0.917 0.804 0.918 0.929 0.908 0.941 0.921 0.935 0.941 0.896 0.875 0.867 0.875 SE 0.037 0.000 0.068 0.061 0.053 0.047 0.060 0.049 0.065 0.052 0.052 0.069 0.072 0.085 0.079 AS 0.000 0.000 0.003 0.000 0.000 0.000 0.000 0.001 0.000 0.000 0.007 0.000 0.000 0.004 0.001 Sensitivity 95.46 100 100 94.12 90.91 94.12 95.46 100 94.12 94.12 100 90.91 83.33 83.33 75.00 Specificity 91.67 100 83.33 66.67 88.24 66.67 88.24 88.24 90.00 92.86 88.24 88.24 91.67 90.00 100 PPV 87.50 100 77.78 57.14 90.91 57.14 91.30 77.78 94.12 94.12 66.67 83.33 83.33 90.91 100 NPV 97.06 100 100 96.00 88.24 96.00 93.75 100 90.00 92.86 100 93.75 91.67 81.82 82.35 Accuracy 93.10 100 89.47 75.47 89.74 75.47 92.31 91.67 92.59 93.55 90.48 89.29 88.89 86.36 88.46 Note.—rCBVT indicates tumoral relative cerebral blood volume; ROC, area under curve; SE, standard error; AS, asymptotic significance; PPV, positive predictive value; NPV, negative predictive value.
* Superscripts indicate:
a Low- and high-grade glial tumors;
b low- and high-grade astrocytic gliomas;
c low- and high-grade non-astrocytic gliomas.
† Superscripts indicate:
d Low-grade glial tumors from metastases
e high-grade glial tumors from metastases;
f low-grade astrocytomas from metastases;
g high-grade astrocytomas from metastases;
h high-grade non-astrocytic gliomas from metastases;
i pilocytic astrocytomas from metastases;
j diffuse astrocytomas from metastases;
k anaplastic astrocytomas from metastases;
l glioblastoma multiforme from metastases;
m low-grade astrocytomas from low-grade oligodendrogliomas;
n pilocytic astrocytomas from low-grade oligodendrogliomas;
o diffuse astrocytomas from low-grade oligodendrogliomas.
- TABLE 5:
Statistically significant lowest cutoff rCBVP values tested for different mean differences
Parameter Cutoff rCBVP Values For Grading* For Differentiation† 1.9a 1.5b 1.1c 1.2d 1.1e 1.2f 1.1g 1.2h 1.1i 1.1j ROC area 0.841 0.879 0.747 0.955 0.733 0.933 0.900 0.909 0.914 0.905 SE 0.063 0.067 0.070 0.037 0.079 0.053 0.066 0.071 0.069 0.061 AS 0.000 0.000 0.004 0.000 0.012 0.000 0.000 0.000 0.001 0.000 Sensitivity 68.18 80.00 61.11 90.91 58.33 86.67 91.67 81.82 92.86 92.86 Specificity 100 95.83 88.24 100 88.24 100 88.24 100 90.00 88.24 PPV 100 92.31 91.67 100 87.50 100 84.62 100 92.86 86.67 NPV 83.72 88.46 51.72 89.47 60.00 89.47 93.75 89.48 90.00 93.75 Accuracy 87.93 89.74 69.81 94.87 70.73 93.75 89.66 92.86 91.67 90.32 Note.—rCBVP indicates peritumoral relative cerebral blood volume; ROC, area under curve; SE, standard error; AS, asymptotic significance; PPV, positive predictive value; NPV, negative predictive value.
* Superscripts indicate:
a Low- and high-grade glial tumors;
b low- and high-grade astrocytic gliomas.
† Superscripts indicate:
c Low-grade glial tumors from metastases;
d high-grade glial tumors from metastases;
e low-grade astrocytomas from metastases;
f high-grade astrocytomas from metastases;
g low-grade non-astrocytic glial tumors from metastases;
h glioblastoma multiforme from metastases;
i diffuse astrocytomas from pilocytic astrocytomas;
j diffuse astrocytomas from metastases.
In this issue


Jump to section
Related Articles
Cited By...
- Multisite Benchmark Study for Standardized Relative CBV in Untreated Brain Metastases Using the DSC-MRI Consensus Acquisition Protocol
- Solitary Cerebral Metastases vs. High-grade Gliomas: Usefulness of Two MRI Signs in the Differential Diagnosis
- Improved Brain Tumor Classification by Sodium MR Imaging: Prediction of IDH Mutation Status and Tumor Progression
- MRI Grading versus Histology: Predicting Survival of World Health Organization Grade II-IV Astrocytomas
- The Added Value of Apparent Diffusion Coefficient to Cerebral Blood Volume in the Preoperative Grading of Diffuse Gliomas
- Imaging biomarkers of angiogenesis and the microvascular environment in cerebral tumours
- Usefulness of diffusion/perfusion-weighted MRI in patients with non-enhancing supratentorial brain gliomas: a valuable tool to predict tumour grading?