
Article Figures & Data
Figures
fig. 1. Axial nonenhanced CT sections obtained 24 h after seizure in a patient (case 4) who was conditioned for transplantation with cyclophosphamide and TBI. She had a new-onset seizure 23 d after transplantation. At the onset of toxic reaction, she had grade 3 BMT-related TM, and her CsA level was within the normal therapeutic range. The initial head CT study obtained on the day of the seizure was normal. Her baseline blood pressure was 92/52 mm Hg but increased to 230/130 mm Hg at the time of toxic reaction and initial CT.
A, Image at the level of lateral ventricles shows edema in the corpus callosum (arrow).
B, Image at the level of the sentrum semiovale shows extensive areas of white matter edema in the parietal region bilaterally (arrow).
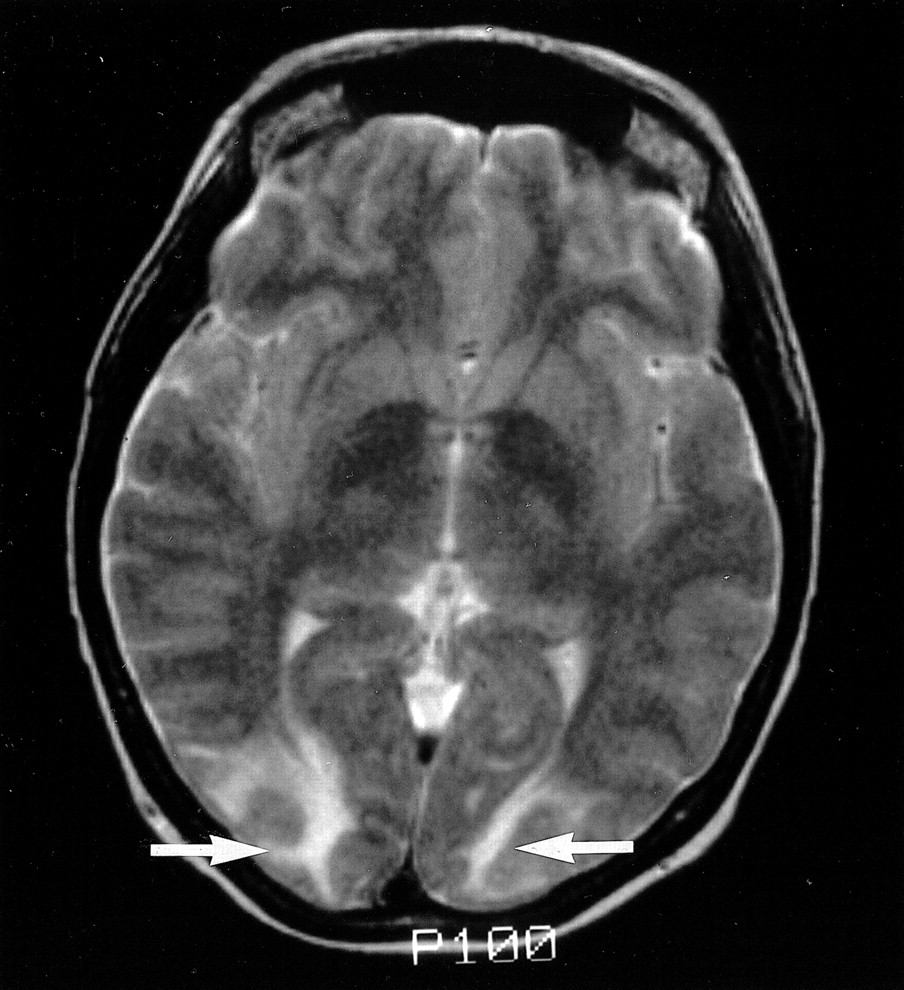
fig. 2. T2-weighted MR image (2500/84/2) obtained on the day of presentation shows typical areas of subcortical white matter abnormality without cortical involvement (arrows) in patient (case 2) who was conditioned for transplantation with cyclophosphamide and TBI and who presented with confusion and altered mental status 14 d after transplantation. She did not develop seizures. At the time of toxic reaction, she had grade 4 BMT-related TM and a CsA level within the normal therapeutic range. Her baseline blood pressure of 115/85 mm Hg increased to 167/104 mm Hg at the time of toxic reaction and MR imaging
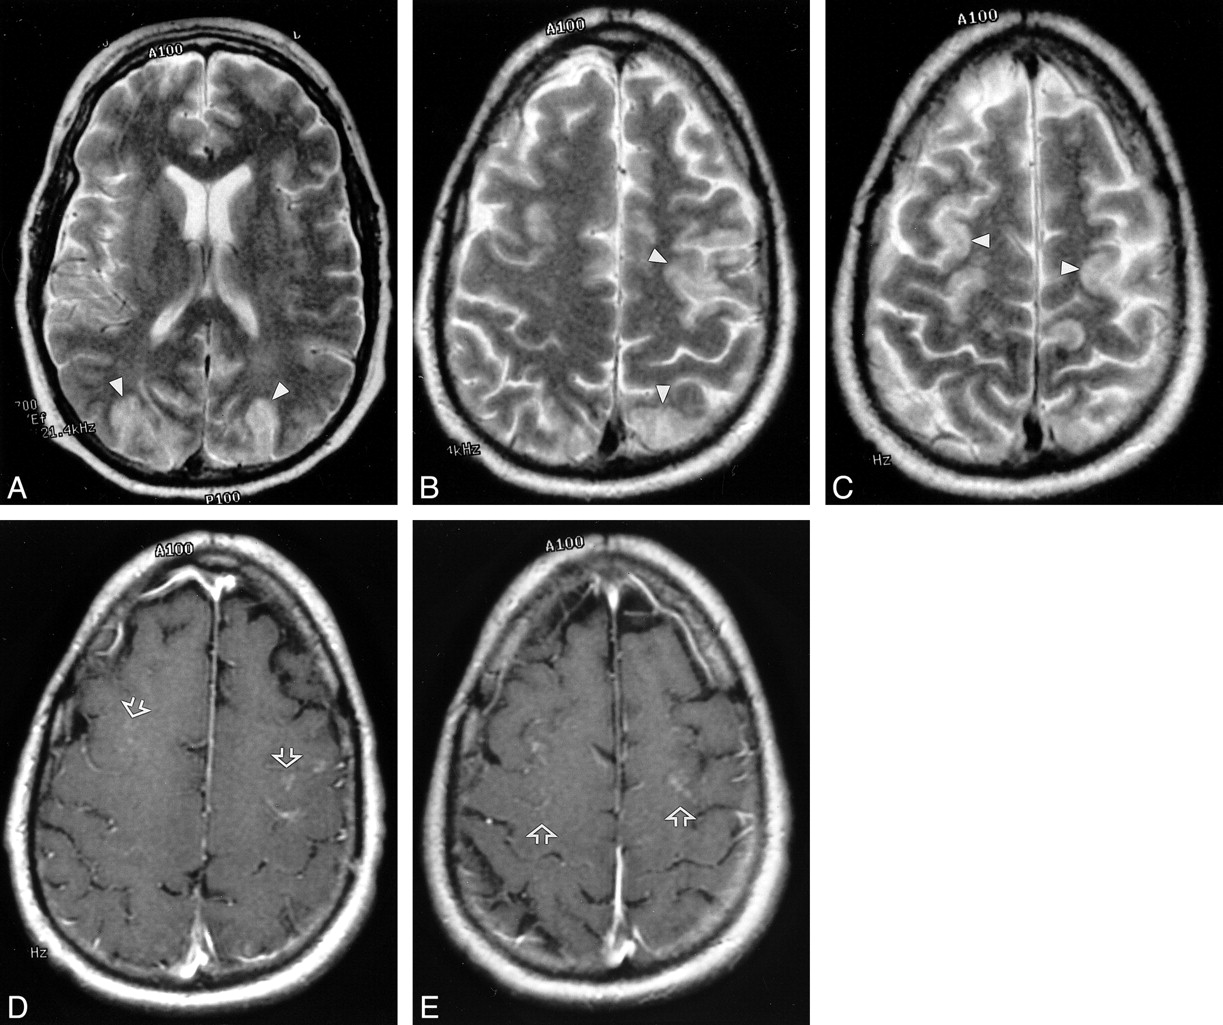
fig. 3. MR images in a patient (case 14), conditioned for transplantation with cyclophosphamide and busulfan, who presented with new-onset seizure 176 d after transplantation. The patient had grade 3 BMT-related TM that rapidly progressed to grade 4. The CsA level was in the normal therapeutic range. His baseline blood pressure was 160/90 mm Hg, which increased to 170/110 mm Hg at the time of toxic reaction. The initial CT scan showed only nonspecific areas of low attenuation in the parietal region. MR images were obtained 6 h after CT.
A–C, T2-weighted MR images from the midventricular level and high parietal region (2500/84/2) show extensive high-signal-intensity edema involving the cortex in the frontal and parietal regions bilaterally (arrowheads).
D and E, Contrast-enhanced images corresponding to B and C show bilateral punctate enhancement in the cortex of the frontal region (arrows). These areas of enhancement correspond to the regions of cortical signal abnormality noted in B and C.
fig. 4. CT scans obtained at the time of toxic reaction shows areas of low attenuation extending centrally from the frontal lobe to the parietal region, involving the white matter and projecting to the cortical surface. Hemorrhages are noted in the right frontal lobe and right parietal area (arrows). The brain abnormalities are severe and appear to lie in a region that could easily coincide with the boundary between anterior cerebral and middle cerebral territories. Images were obtained in a patient (case 11), conditioned for transplantation with cyclophosphamide and busulfan, who presented with generalized tonic-clonic seizure activity 8 d after transplantation. At the onset of toxic reaction, the patient had grade 3 BMT-related TM that rapidly worsened to grade 4. The cyclosporin level at the time of toxic reaction was within the normal therapeutic range. Her baseline blood pressure was 110/70 mm Hg, which increased to 152/96 mm Hg at toxic reaction
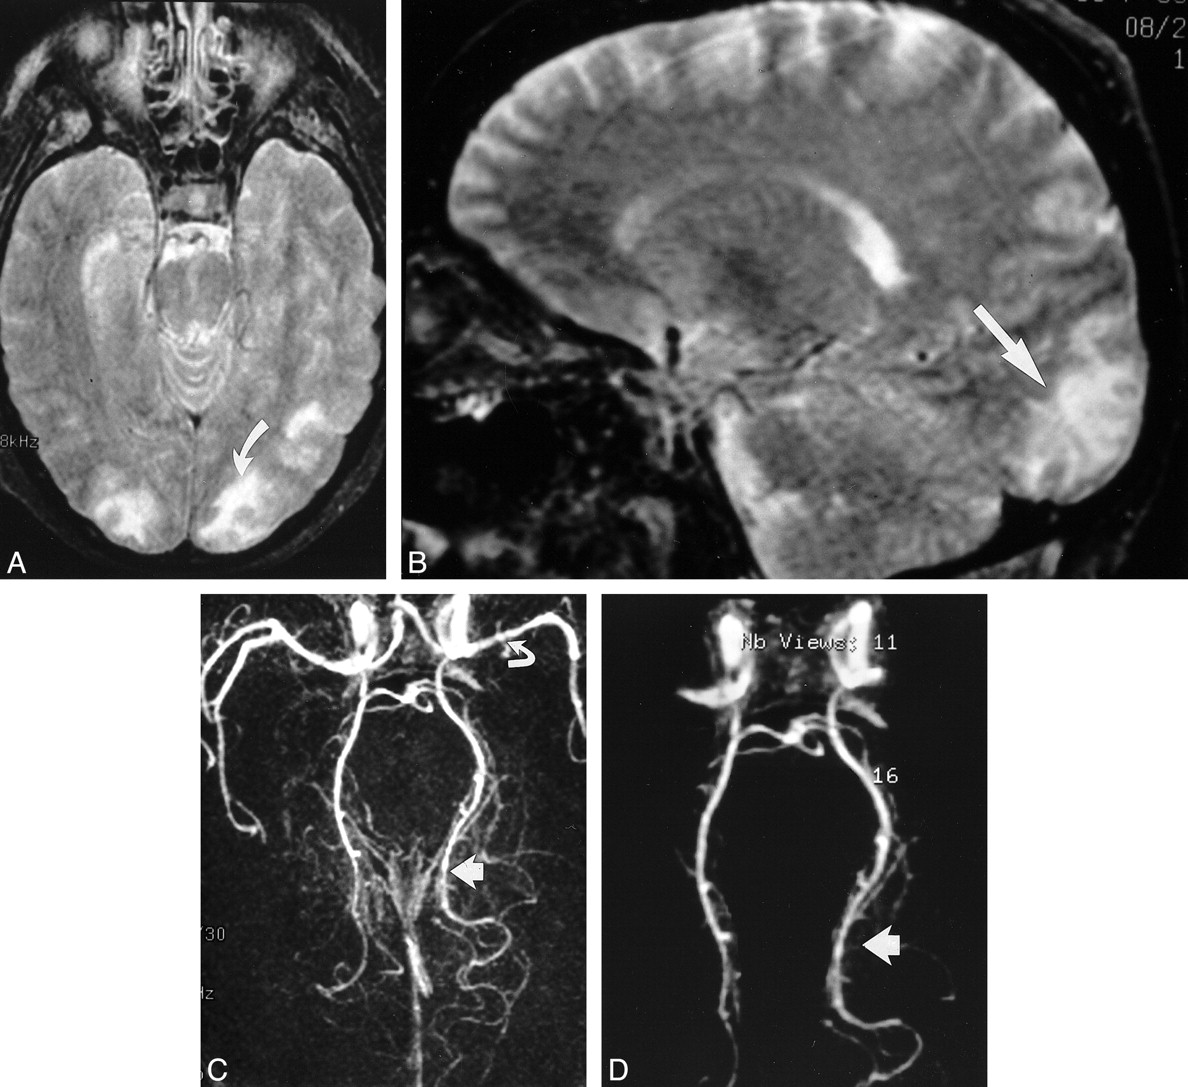
fig. 5. Images in a patient (case 18), who was conditioned for transplantation with cyclophosphamide, thiotepa, and busulfan and who presented with binocular cortical blindness 15 d after transplantation. At the time of toxic reaction, the patient had grade 3 BMT-related TM, and the CsA level was within the normal therapeutic range. Her baseline blood pressure was 150/88 mm Hg, which increased to 180/100 mm Hg at toxic reaction.
A, T2-weighted axial MR image (2500/84/2) shows areas of mixed cortical and white matter signal intensity abnormalities in the occipital pole region bilaterally. Abnormalities are greater on the left (arrow). At autopsy, vasogenic edema was present in the bilateral occipital lobes, with evidence of ischemic neuronal necrosis in the cortex at the occipital watershed region.
B, T2-weighted sagittal MR image (2500/84/2) clearly shows signal intensity abnormality in the calcarine region (arrow).
C, 3D TOF MR angiogram, collapsed view (46/6.9/1), shows vessel narrowing and irregularity in the left middle cerebral artery (curved arrow) and bilateral posterior cerebral arteries; these findings are more striking on the left (straight arrow).
D, Postprocessed 3D TOF MR angiogram with background noise elimination shows a string-of-beads appearance in the posterior cerebral arteries; the finding is more severe on the left (arrow). At autopsy, these vessels appeared normal, without evidence of vasculitis.


Tables


In this issue


Jump to section
Related Articles
Cited By...
- Posterior reversible encephalopathy syndrome resulting from repeat bortezomib usage
- Neurotoxicology: Five new things
- Reversible Encephalopathy after Cardiac Transplantation: Histologic Evidence of Endothelial Activation, T-Cell Specific Trafficking, and Vascular Endothelial Growth Factor Expression
- Non-infectious manifestations of stem cell transplantation
- Antibodies to Zic4 in paraneoplastic neurologic disorders and small-cell lung cancer
- Reversible diffusion MRI abnormalities and transient mutism after liver transplantation