Advertisement

Main menu

  • Home
  • Content
    • Current Issue
    • Accepted Manuscripts
    • Article Preview
    • Past Issue Archive
    • Video Articles
    • AJNR Case Collection
    • Case of the Week Archive
    • Case of the Month Archive
    • Classic Case Archive
  • Special Collections
    • AJNR Awards
    • Low-Field MRI
    • Alzheimer Disease
    • ASNR Foundation Special Collection
    • Photon-Counting CT
    • View All
  • Multimedia
    • AJNR Podcasts
    • AJNR SCANtastic
    • Trainee Corner
    • MRI Safety Corner
    • Imaging Protocols
  • For Authors
    • Submit a Manuscript
    • Submit a Video Article
    • Submit an eLetter to the Editor/Response
    • Manuscript Submission Guidelines
    • Statistical Tips
    • Fast Publishing of Accepted Manuscripts
    • Graphical Abstract Preparation
    • Imaging Protocol Submission
    • Author Policies
  • About Us
    • About AJNR
    • Editorial Board
    • Editorial Board Alumni
  • More
    • Become a Reviewer/Academy of Reviewers
    • Subscribers
    • Permissions
    • Alerts
    • Feedback
    • Advertisers
    • ASNR Home

User menu

  • Alerts
  • Log in

Search

  • Advanced search
American Journal of Neuroradiology

American Journal of Neuroradiology

ASHNR American Society of Functional Neuroradiology ASHNR American Society of Pediatric Neuroradiology ASSR
  • Alerts
  • Log in

Advanced Search

  • Home
  • Content
    • Current Issue
    • Accepted Manuscripts
    • Article Preview
    • Past Issue Archive
    • Video Articles
    • AJNR Case Collection
    • Case of the Week Archive
    • Case of the Month Archive
    • Classic Case Archive
  • Special Collections
    • AJNR Awards
    • Low-Field MRI
    • Alzheimer Disease
    • ASNR Foundation Special Collection
    • Photon-Counting CT
    • View All
  • Multimedia
    • AJNR Podcasts
    • AJNR SCANtastic
    • Trainee Corner
    • MRI Safety Corner
    • Imaging Protocols
  • For Authors
    • Submit a Manuscript
    • Submit a Video Article
    • Submit an eLetter to the Editor/Response
    • Manuscript Submission Guidelines
    • Statistical Tips
    • Fast Publishing of Accepted Manuscripts
    • Graphical Abstract Preparation
    • Imaging Protocol Submission
    • Author Policies
  • About Us
    • About AJNR
    • Editorial Board
    • Editorial Board Alumni
  • More
    • Become a Reviewer/Academy of Reviewers
    • Subscribers
    • Permissions
    • Alerts
    • Feedback
    • Advertisers
    • ASNR Home
  • Follow AJNR on Twitter
  • Visit AJNR on Facebook
  • Follow AJNR on Instagram
  • Join AJNR on LinkedIn
  • RSS Feeds

AJNR Awards, New Junior Editors, and more. Read the latest AJNR updates

Research ArticleBrain

A CT Method to Measure Hemodynamics in Brain Tumors: Validation and Application of Cerebral Blood Flow Maps

Aleksa Cenic, Darius G. Nabavi, Rosemary A. Craen, Adrian W. Gelb and Ting-Yim Lee
American Journal of Neuroradiology March 2000, 21 (3) 462-470;
Aleksa Cenic
aFrom the Imaging Research Laboratories (A.C., D.G.N., T-Y.L.), John P. Robarts Research Institute, London; Medical Biophysics Department (A.C., T-Y.L.), The University of Western Ontario, London; Imaging Division, Lawson Research Institute (A.C., T-Y.L.), St. Joseph's Health Centre, London; and Anesthesia Department (R.A.C., A.W.G.), London Health Sciences Centre, London, Ontario, Canada.
  • Find this author on Google Scholar
  • Find this author on PubMed
  • Search for this author on this site
Darius G. Nabavi
aFrom the Imaging Research Laboratories (A.C., D.G.N., T-Y.L.), John P. Robarts Research Institute, London; Medical Biophysics Department (A.C., T-Y.L.), The University of Western Ontario, London; Imaging Division, Lawson Research Institute (A.C., T-Y.L.), St. Joseph's Health Centre, London; and Anesthesia Department (R.A.C., A.W.G.), London Health Sciences Centre, London, Ontario, Canada.
  • Find this author on Google Scholar
  • Find this author on PubMed
  • Search for this author on this site
Rosemary A. Craen
aFrom the Imaging Research Laboratories (A.C., D.G.N., T-Y.L.), John P. Robarts Research Institute, London; Medical Biophysics Department (A.C., T-Y.L.), The University of Western Ontario, London; Imaging Division, Lawson Research Institute (A.C., T-Y.L.), St. Joseph's Health Centre, London; and Anesthesia Department (R.A.C., A.W.G.), London Health Sciences Centre, London, Ontario, Canada.
  • Find this author on Google Scholar
  • Find this author on PubMed
  • Search for this author on this site
Adrian W. Gelb
aFrom the Imaging Research Laboratories (A.C., D.G.N., T-Y.L.), John P. Robarts Research Institute, London; Medical Biophysics Department (A.C., T-Y.L.), The University of Western Ontario, London; Imaging Division, Lawson Research Institute (A.C., T-Y.L.), St. Joseph's Health Centre, London; and Anesthesia Department (R.A.C., A.W.G.), London Health Sciences Centre, London, Ontario, Canada.
  • Find this author on Google Scholar
  • Find this author on PubMed
  • Search for this author on this site
Ting-Yim Lee
aFrom the Imaging Research Laboratories (A.C., D.G.N., T-Y.L.), John P. Robarts Research Institute, London; Medical Biophysics Department (A.C., T-Y.L.), The University of Western Ontario, London; Imaging Division, Lawson Research Institute (A.C., T-Y.L.), St. Joseph's Health Centre, London; and Anesthesia Department (R.A.C., A.W.G.), London Health Sciences Centre, London, Ontario, Canada.
  • Find this author on Google Scholar
  • Find this author on PubMed
  • Search for this author on this site
  • Article
  • Figures & Data
  • Info & Metrics
  • Responses
  • References
  • PDF
Loading

Article Figures & Data

Figures

  • Tables
  • fig 1.
    • Download figure
    • Open in new tab
    • Download powerpoint
    fig 1.

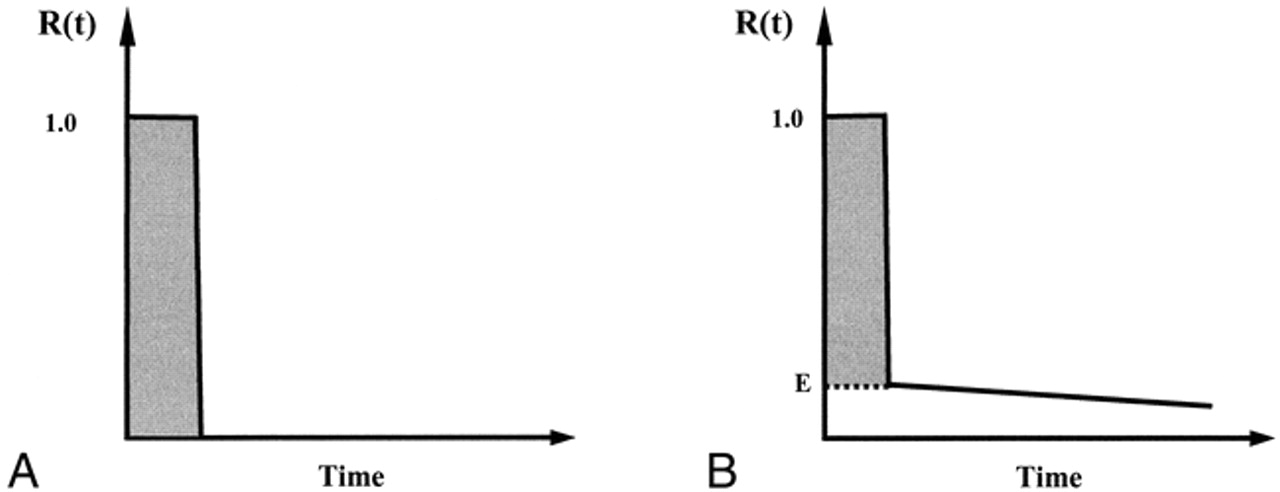
    A, Schematic representation of IRF in a tissue with an intact (ie, impermeable to contrast molecules) BBB.

    B, Schematic representation of an IRF, R(t), in tissue with a permeable BBB. The first plateau reflects the intravascular phase of the contrast material. The second (and much lower) plateau reflects the extravascular phase. The extraction fraction, E, is derived by dividing the second plateau height by the first plateau height.

  • fig 2.
    • Download figure
    • Open in new tab
    • Download powerpoint
    fig 2.

    Examples of dynamic CT-measured contrast-enhancement curves of an artery (line), normal tissue (squares), and tumor (circles) in a rabbit with brain tumor. For clarity, the tissue curves are displayed using a different scale of CT numbers (right axis). Thus, the arterial enhancement curve (left axis) is more than 10 times higher than that of the tumor curve, and 50 times higher than that of the normal tissue curve. Note the higher washout phase of the tumor curve relative to the normal tissue.fig 3. Contrast-enhanced CT image illustrating tumor, peritumor and contralateral normal ROIs found in a rabbit. The radial arteries (RA) are clearly displayed at the bottom of the figure (adjacent to the radial and ulna bones)

  • fig 4.
    • Download figure
    • Open in new tab
    • Download powerpoint
    fig 4.

    Dynamic CT measurements plotted against microsphere measurements of regional CBF (mL/min/100 g) for 54 ROIs (18 ROIs for each tumor, peritumor, and normal tissue) in nine rabbits with brain tumor. A strong correlation was found between these two sets of measurements (r = 0.847). The slope of the regression line (0.99 ± 0.03, P < .001) was not significantly different from unity

  • fig 5.
    • Download figure
    • Open in new tab
    • Download powerpoint
    fig 5.

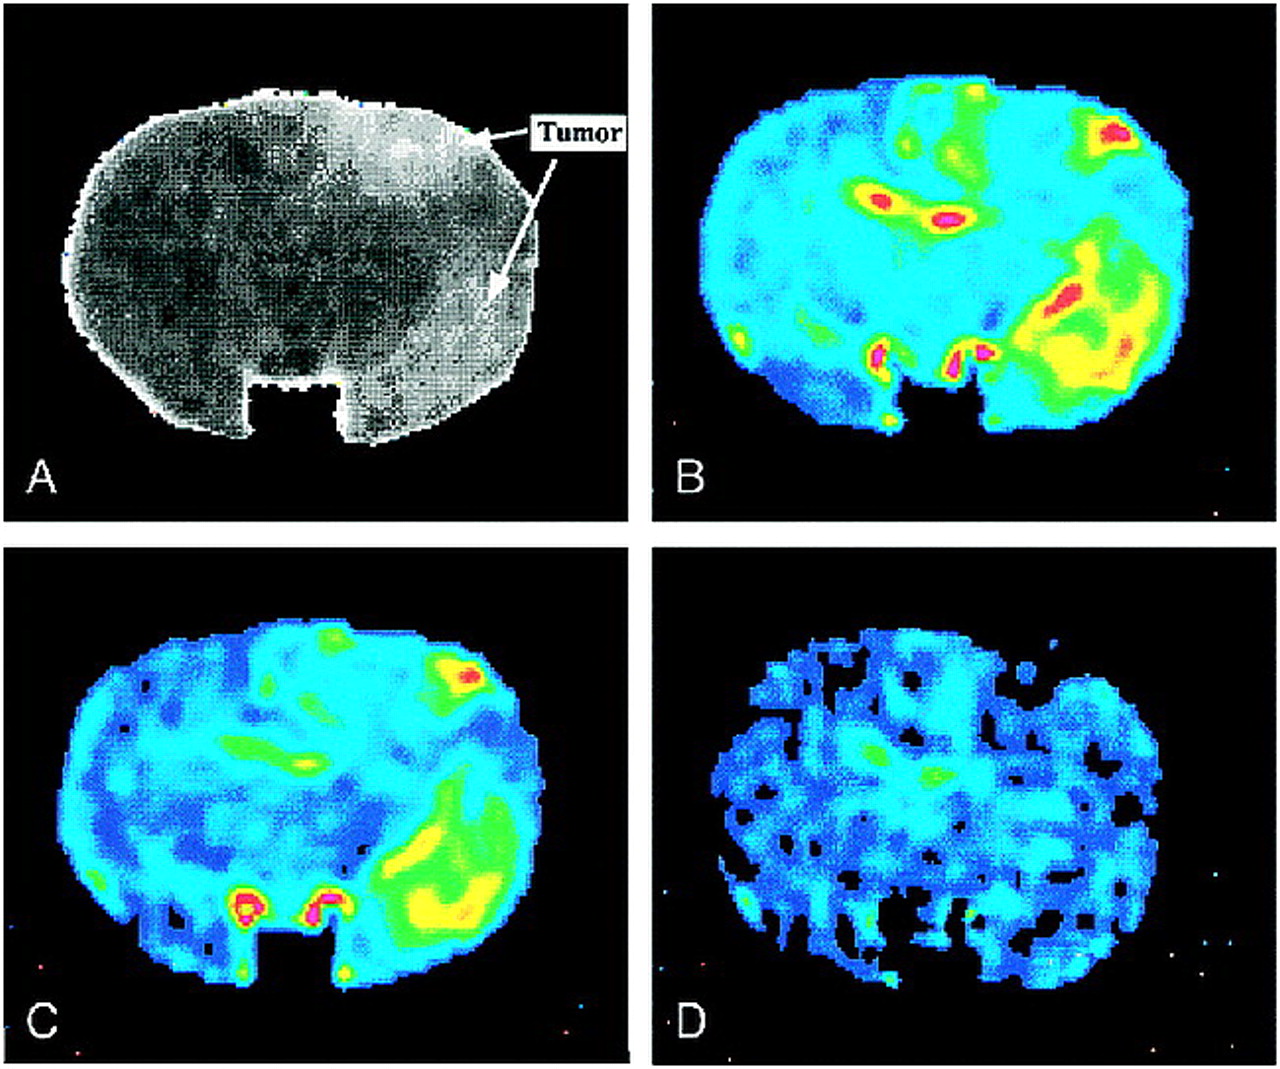
    CBF maps derived from a rabbit with brain tumor. The CBF values, ranging from low-to-high flow are color-coded from black (0 mL/min/100 g) to blue and green (100 mL/min/100 g) to yellow and red (200 mL/min/100 g). For both PaCO2 levels, the tumor is clearly delineated by the red and yellow colors.

    A, Plain (precontrast) CT Image. The following X-ray CT parameters were used to acquire the image: 80 kVp, 80 mA, 10-cm field of view, and 3-mm slice thickness. Hyperdense areas corresponding to the tumor were observed in the right parietal and temporal regions.

    B, Normocapnia CBF map. CBF in the tumor ranged from 66 to 208 mL/min/100 g, whereas CBF in the contralateral normal hemisphere ranged from 14 to 75 mL/min/100 g.

    C, Hypocapnia CBF map. The maximum and minimum CBF values in tumor were 56 and 170 mL/min/100 g, whereas the contralateral normal hemisphere showed CBF values ranging from 3 to 43 mL/min/100 g.

    D, Subtraction of the hypocapnia CBF map from the normocapnia map. The mean global CBF difference was 18.7 mL/min/100 g. Reduction in CBF upon hyperventilation is shown in both tumor and normal tissues. The green circular areas in the center of the brain are cerebral arteries.

Tables

  • Figures
  • TABLE 1:
    • View popup
    • Download powerpoint
    TABLE 1:

    Controlled and monitored physiologic parameters

  • TABLE 2:
    • View popup
    • Download powerpoint
    TABLE 2:

    Comparison of mean regional CBF changes (ΔCBF) to decreased CO2 levels using both the microsphere and the dynamic CT methods in six rabbits

  • TABLE 3:
    • View popup
    • Download powerpoint
    TABLE 3:

    Comparison of mean regional CBF, CBV, and PS values as determined by dynamic CT in 12 normocapnia rabbit studies

PreviousNext
Back to top

In this issue

American Journal of Neuroradiology
Vol. 21, Issue 3
1 Mar 2000
  • Table of Contents
  • Index by author
Advertisement
Print
Download PDF
Email Article

Thank you for your interest in spreading the word on American Journal of Neuroradiology.

NOTE: We only request your email address so that the person you are recommending the page to knows that you wanted them to see it, and that it is not junk mail. We do not capture any email address.

Enter multiple addresses on separate lines or separate them with commas.
A CT Method to Measure Hemodynamics in Brain Tumors: Validation and Application of Cerebral Blood Flow Maps
(Your Name) has sent you a message from American Journal of Neuroradiology
(Your Name) thought you would like to see the American Journal of Neuroradiology web site.
CAPTCHA
This question is for testing whether or not you are a human visitor and to prevent automated spam submissions.
Cite this article
Aleksa Cenic, Darius G. Nabavi, Rosemary A. Craen, Adrian W. Gelb, Ting-Yim Lee
A CT Method to Measure Hemodynamics in Brain Tumors: Validation and Application of Cerebral Blood Flow Maps
American Journal of Neuroradiology Mar 2000, 21 (3) 462-470;

Citation Manager Formats

  • BibTeX
  • Bookends
  • EasyBib
  • EndNote (tagged)
  • EndNote 8 (xml)
  • Medlars
  • Mendeley
  • Papers
  • RefWorks Tagged
  • Ref Manager
  • RIS
  • Zotero
0 Responses
Respond to this article
Share
Bookmark this article
A CT Method to Measure Hemodynamics in Brain Tumors: Validation and Application of Cerebral Blood Flow Maps
Aleksa Cenic, Darius G. Nabavi, Rosemary A. Craen, Adrian W. Gelb, Ting-Yim Lee
American Journal of Neuroradiology Mar 2000, 21 (3) 462-470;
del.icio.us logo Twitter logo Facebook logo Mendeley logo
  • Tweet Widget
  • Facebook Like
  • Google Plus One

Jump to section

  • Article
    • Abstract
    • Theory
    • Methods
    • Results
    • Discussion
    • Conclusion
    • Acknowledgments
    • Footnotes
    • References
  • Figures & Data
  • Info & Metrics
  • Responses
  • References
  • PDF

Related Articles

  • No related articles found.
  • PubMed
  • Google Scholar

Cited By...

  • Dynamic contrast-enhanced imaging techniques: CT and MRI
  • Increased Blood-Brain Barrier Permeability on Perfusion CT Might Predict Malignant Middle Cerebral Artery Infarction
  • First-pass perfusion imaging of solitary pulmonary nodules with 64-detector row CT: comparison of perfusion parameters of malignant and benign lesions
  • Recommendations for Imaging of Acute Ischemic Stroke: A Scientific Statement From the American Heart Association
  • Cortical Regional Hyperperfusion in Nonconvulsive Status Epilepticus Measured by Dynamic Brain Perfusion CT
  • Theoretic Basis and Technical Implementations of CT Perfusion in Acute Ischemic Stroke, Part 1: Theoretic Basis
  • Neuroimaging applications of multislice CT perfusion
  • Quantitative colorectal cancer perfusion measurement by multidetector-row CT: does greater tumour coverage improve measurement reproducibility?
  • CT Perfusion Imaging in Cerebral Ischemia
  • Perfusion CT for the assessment of tumour vascularity: which protocol?
  • Guidelines and Recommendations for Perfusion Imaging in Cerebral Ischemia: A Scientific Statement for Healthcare Professionals by the Writing Group on Perfusion Imaging, From the Council on Cardiovascular Radiology of the American Heart Association
  • Perfusion CT: a worthwhile enhancement?
  • Correlation of Cerebrovascular Reserve as Measured by Acetazolamide-challenged SPECT with Angiographic Flow Patterns and Intra- or Extracranial Arterial Stenosis
  • Crossref
  • Google Scholar

This article has not yet been cited by articles in journals that are participating in Crossref Cited-by Linking.

More in this TOC Section

  • Usefulness of Quantitative Susceptibility Mapping for the Diagnosis of Parkinson Disease
  • White Matter Alterations in the Brains of Patients with Active, Remitted, and Cured Cushing Syndrome: A DTI Study
  • Qualitative and Quantitative Analysis of MR Imaging Findings in Patients with Middle Cerebral Artery Stroke Implanted with Mesenchymal Stem Cells
Show more Brain

Similar Articles

Advertisement

Indexed Content

  • Current Issue
  • Accepted Manuscripts
  • Article Preview
  • Past Issues
  • Editorials
  • Editor's Choice
  • Fellows' Journal Club
  • Letters to the Editor
  • Video Articles

Cases

  • Case Collection
  • Archive - Case of the Week
  • Archive - Case of the Month
  • Archive - Classic Case

More from AJNR

  • Trainee Corner
  • Imaging Protocols
  • MRI Safety Corner
  • Book Reviews

Multimedia

  • AJNR Podcasts
  • AJNR Scantastics

Resources

  • Turnaround Time
  • Submit a Manuscript
  • Submit a Video Article
  • Submit an eLetter to the Editor/Response
  • Manuscript Submission Guidelines
  • Statistical Tips
  • Fast Publishing of Accepted Manuscripts
  • Graphical Abstract Preparation
  • Imaging Protocol Submission
  • Evidence-Based Medicine Level Guide
  • Publishing Checklists
  • Author Policies
  • Become a Reviewer/Academy of Reviewers
  • News and Updates

About Us

  • About AJNR
  • Editorial Board
  • Editorial Board Alumni
  • Alerts
  • Permissions
  • Not an AJNR Subscriber? Join Now
  • Advertise with Us
  • Librarian Resources
  • Feedback
  • Terms and Conditions
  • AJNR Editorial Board Alumni

American Society of Neuroradiology

  • Not an ASNR Member? Join Now

© 2025 by the American Society of Neuroradiology All rights, including for text and data mining, AI training, and similar technologies, are reserved.
Print ISSN: 0195-6108 Online ISSN: 1936-959X

Powered by HighWire