Article Figures & Data
Figures
Fig 1. Enhancement in the right and left insula after injection of 50 mL iodinated contrast agent before and after carotid revascularization.
A, Before revascularization there is considerable delayed and attenuated enhancement in the right insula compared with the left.
B, After treatment, this differerence is resolved and the contrast agent transit curves are symmetrical.
Fig 2. Enhancement in the right and left basal ganglia after injection of 50 mL iodinated contrast agent before and after carotid revasularization.
A, Before treatment, there is symmetric initial enhancement; however, the peak is later and higher and the washout is delayed on the right side compared with the left. This indicates loss in autoregulation and “pooling” of contrast agent.
B, The findings described in A are resolved 1 day after treatment, indicating reversal of vasodilation. A subtle stenotic effect on the right is indicated by a flatter curve and a lower contrast enhancement peak.
Fig 3. CT images before revascularization. Precontrast (A), postcontrast (B) (after 150 mL contrast agent administration), and calculated fBV maps (C) are shown. The vessels in the right MCA territory appear dilated (B, arrow), and there is an increased fBV in the same area (C, arrow)
Fig 4. CT images after revascularization. Precontrast (A), postcontrast (B) (after 150 mL contrast agent administration), and calculated fBV maps (C) are shown. Vascular dilatation and hyperintensity on maps is less obvious compared with that shown on pretreatment maps
Tables

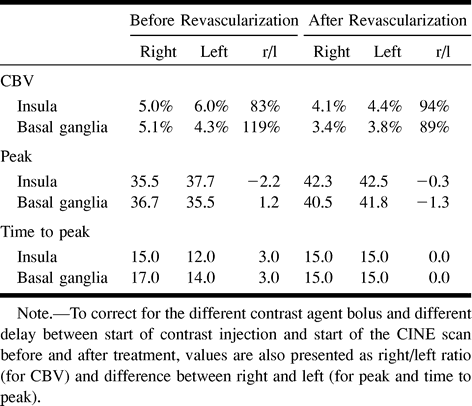
Cerebral blood volumes (CBV), peak and time to peak for different anatomical areas before and after revascularization, calculated from the dynamic CINE CT acquisition


