
Abstract
BACKGROUND AND PURPOSE: Cerebral small vessel disease (SVD) is a common cause of stroke and cognitive decline. SVD is characterized by white matter hyperintensities (WMH) and dilated perivascular spaces (PVS). While WMH can be associated with reduced CBF and glymphatic clearance, current clinical and radiologic assessments of these associations remain controversial and mostly qualitative. We aim to identify if arterial spin-labeling (ASL)-based CBF differences, particularly in the cortical surface at the GM/CSF interface, correlate with SVD severity.
MATERIALS AND METHODS: We performed a retrospective cohort study of healthy controls with normal cognition who underwent a brain MRI as part of our university’s Alzheimer Disease Research Center (ADRC) and an 15O-water PET study database. Our inclusion criteria included patients aged >50 years with no structural brain abnormalities besides SVD with ASL perfusion images. WMH grading was performed by using the Fazekas scale, WMH score, PVS grade, and manually segmented WMH volume. We identified patients with moderate-to-severe SVD and then selected age-matched samples of patients with minimal or no SVD. CBF of the whole brain (WB), GM, WM, and along the GM/CSF interface were calculated. Several perfusion metrics (WB, GM, and WM) as well as a novel perfusion metric, normalized GM/CSF interface (nGCI) perfusion metric, which indirectly reflects the relative ASL signal near the GM-CSF boundary, were evaluated by using receiver operating characteristic and correlation analyses.
RESULTS: Thirty-two patients met the inclusion criteria (n=11 moderate-to-severe SVD, mean age 72 ± 10 years, 6 women; n = 21 none-to-minimal SVD, mean age 70 ± 10 years, 12 women). Of the measured perfusion markers, nGCI had the strongest negative correlation with Fazekas score, total WMH volume, PVS grade, and average total SVD score (r = −0.68, −0.67, −0.54, −0.54, respectively; P < .001) as well as the highest area under the receiver operating characteristics curve (0.95, 95% CI: 0.87–1.0) as a predictor of WMH severity.
CONCLUSIONS: nGCI, a novel perfusion metric that may capture features of perfusion at the GM-CSF boundary, was strongly correlated with WMH and PVS severity. Further, longitudinal studies are required to determine the potential role of nGCI as a predictive marker of SVD progression.
ABBREVIATIONS:
- ADRC
- Alzheimer’s Disease Research Center
- ASL
- arterial spin-labeling
- nGCI
- normalized GM/CSF interface perfusion metric
- pcASL
- pseudocontinuous arterial spin-labeling
- PVS
- dilated perivascular space
- ROC
- receiver operating characteristics
- STRIVE
- Standards for Reporting Vascular Changes on Neuroimaging
- SVD
- small vessel disease
- WB
- whole brain
- WMH
- white matter hyperintensity
SUMMARY
PREVIOUS LITERATURE:
SVD, a disorder of cerebral microvessels, is a common cause of stroke and dementia. Its radiologic correlates, WMH and PVS, are almost ubiquitous in brain imaging as we age. Despite this, their underlying pathogenesis is poorly understood, and associations between imaging markers and the heterogeneous clinical expression of SVD remain weak. While WMH can be associated with reduced CBF and glymphatic clearance, current clinical and radiologic assessments of these associations remain controversial and mostly qualitative.
KEY FINDINGS:
A novel quantitative perfusion variable, nGCI, was found to have the strongest negative correlation with Fazekas score, total WMH volume, PVS grade, and average total SVD score (r= −0.68, −0.67, −0.54, −0.54, respectively; P < .001). nGCI had the highest area under the ROC curve (0.95, 95% CI: 0.87–1.0) as a predictor of WMH severity.
KNOWLEDGE ADVANCEMENT:
Decreased ASL signal localized to the GM-CSF boundary was strongly correlated with WMH and PVS severity in elderly subjects with normal cognition.
Cerebral small vessel disease (SVD) is a disorder of cerebral microvessels that is associated with stroke and dementia.1⇓-3 The STandards for ReportIng Vascular changes on nEuroimaging (STRIVE) criteria have standardized the nomenclature of SVD markers, which include white matter hyperintensity (WMH) of vascular origin, lacunar infarcts, prominent perivascular spaces (PVS), microbleeds, superficial siderosis, and brain atrophy.4 Multiple studies suggest that reduced CBF and glymphatic clearance due to disturbance of blood-to-CSF water flow at the BBB or in draining glymphatic pathways may play a critical role in the pathogenesis of SVD, particularly WMH and PVS.5⇓-7 However, the association between CBF reduction and SVD progression is poorly understood. While SVD markers, particularly WMH, are almost ubiquitous in brain imaging of older adults and common findings on conventional MRI, associations between imaging markers and the heterogeneous clinical expression of SVD remain weak.8,9 One possible explanation for this discrepancy is that conventional MRI primarily captures local changes, whereas SVD is now increasingly recognized as a global brain condition that is insufficiently characterized by conventional MRI alone.1,10,11 Furthermore, the severity and nature of clinical symptoms can be vastly different in patients with seemingly radiologically identical SVD lesions.12 Therefore, a global approach, such as perfusion imaging with arterial spin-labeling (ASL) MRI, may identify associations between CBF and SVD.
While advances in glymphatic imaging and reduced CBF on ASL have recently gained traction as potential biomarkers for SVD, associations between how SVD may occur and evolve in the setting of prolonged CBF reductions in WM and GM remain unclear and controversial.5⇓-7,10,13 This debate acknowledges the potential ASL-CBF sampling errors and limited spatial resolution when comparing perfusion between pure GM and WM.5,6,13⇓-15 Furthermore, prior studies have largely focused on assessing parenchymal ASL signal only, but it is possible to detect ASL signal in CSF spaces as well, though this can be difficult to separate from the adjacent GM.15,16 Measurement of ASL signal at the GM/CSF interface may enable interrogation of the blood–CSF barrier, which might predict SVD severity and progression.15 However, no imaging studies have investigated the potential association between the ASL signal at the GM-CSF interface and the severity of SVD. The cortical/superficial perforating arteries primarily provide the arterial supply to the GM, whereas the WM is mainly supplied by the long perforating arteries that originate from cortical arteries and penetrate the subcortical WM.17,18 While the pathogenesis of SVD is largely unknown, the pathologic processes leading to the arteriolar disease in SVD are mainly believed to result from occlusive disease in the cortical/superficial and deep perforating arteries, which in turn result in decreased and delayed blood flow in the upstream capillaries that supply the WM.2,11,17,18
We performed this study to determine if ASL-based CBF measurements, particularly at the GM/CSF interface, correlate with SVD severity. We hypothesized that dysfunction of the cortical/superficial perforating arteries along the GM/CSF interface in patients with high-grade SVD may result in abnormally delayed flow in the capillaries supplying the deep WM in patients with high-grade SVD. Therefore, a lower ASL signal along the GM/CSF interface due to delayed blood flow might be a potential new marker that correlates with a worse WMH and PVS burden. To this end, we isolated the ASL CBF signal from this region and compared it with other more standard perfusion metrics in cognitively intact elderly subjects with and without moderate-to-severe SVD.
MATERIALS AND METHODS
Study Design and Subjects
We performed a retrospective cohort study of consecutive elderly cognitively normal subjects who underwent brain MRI as part of 2 separate local studies: our university’s Alzheimer’s Disease Research Center (ADRC) and an 15O-water PET/MR cohort. We included subjects aged >50 years with no structural brain abnormalities besides SVD, who received a brain MR study with adequate quality ASL, T2-weighted, GRE, and T2 FLAIR imaging. Patients were asked to abstain from caffeine for 6 hours, but otherwise, there was no control for potentially confounding variables, such as hematocrit, blood pressure, serum albumin, or time of day. These subjects were analyzed for SVD as described below and further age-matched to create a balanced data set of subjects with and without at least moderate SVD. The study flowchart is shown in Fig 1.

Data flowchart.
Image Acquisition, SVD Grading, and ASL-CBF Quantification
All examinations were performed at 3T (Signa PET/MR; GE Healthcare). One neuroradiologist (with 14 years of experience) graded the severity of SVD by using the Fazekas score and the STRIVE criteria by using markers of chronic SVD (WMH, PVS, lacunae, and microbleeds) with a total possible SVD score between 0–4.1,4,19 WMH, PVS, and microbleeds were assessed on the FLAIR, T2-weighted, and GRE images, respectively (Table). Additionally, the total WMH volume was manually segmented by a neuroradiologist and another researcher with 14 and 3 years of experience, respectively. These assessments were performed blinded to the ASL CBF results. A high-resolution 3D gradient-echo T1-weighted structural image was acquired to facilitate image registration with ASL. Parameters for the structural images are reported in the Supplemental Data.
Patient demographics and imaging characteristics
Single-delay 3D segmented stack-of-spirals pseudocontinuous ASL (pcASL) with the following parameters was acquired: labeling duration = 1450 ms, postlabel delay = 2025 ms, TR = 4854 ms, TE = 10.7 ms, arms/points per arm = 8/512, field-of-view = 24 cm, slice thickness = 4 mm, in-plane resolution = 3 mm, number of averages = 3. CBF maps were automatically generated from the ASL difference images by the scanner software following white paper recommendations.20 These maps were generated at the time of acquisition from pcASL images by using the scanner’s reconstruction pipeline. Labeled and control images were reconstructed, and the magnetization difference between labeled and control images was calculated, reflecting the perfusion signal. Using the ASL signal equation,20 CBF is quantified in units of mL/100 g/min. The labeling duration, postlabel delay, T1 relaxation properties of blood, blood magnetization, and estimated labeling efficiency are accounted for in this equation to ensure accurate quantification. The resulting CBF maps provide quantitative measures of blood flow across brain tissue and were stored for subsequent analysis.
Image Processing and Quantitative Analysis
First, ASL-CBF images were registered to the T1-weighted anatomic examination by using FSL’s FLIRT (https://fsl.fmrib.ox.ac.uk/fsl/fslwiki/FLIRT) rigid body registration. T1-weighted images were then processed to create a binarized whole brain (WB) mask by using FSL’s brain extraction tool FSL 6.0.5 (Analysis Group, FMRIB). Next, WM and GM segmentation were performed by using FSL’s FAST algorithm (http://fsl.fmrib.ox.ac.uk/fsl/fslwiki/fast). GM masks were eroded twice to remove 2 voxel layers from the boundary of nonzero regions by using FSLMATH’s default erode function (fslmaths -ero). The resulting eroded GM masks were subtracted from the original GM masks to obtain GM/CSF interface masks. The WM masks were similarly eroded by using the default kernel to prevent overlap with GM voxels. These segmentation masks were overlayed on ASL-CBF images to extract mean WM, GM, and GM/CSF interface CBF, while the binarized brain mask was used to calculate WB CBF. All image analysis was performed in native space for best accuracy in segmenting mask regions, which were uniquely derived for each participant by using T1-structural images. Normalized WM and GM CBF values were also created by dividing the ROI value by the WB CBF. Visual representations of the preprocessing steps are given in Figs 2 and 3. In addition to the standard CBF metrics listed above, we normalized the GM/CSF interface ASL-CBF to the WB CBF and have named this parameter normalized GM/CSF interface perfusion metric (nGCI). [nGCI = ( )/
)/ ]
]

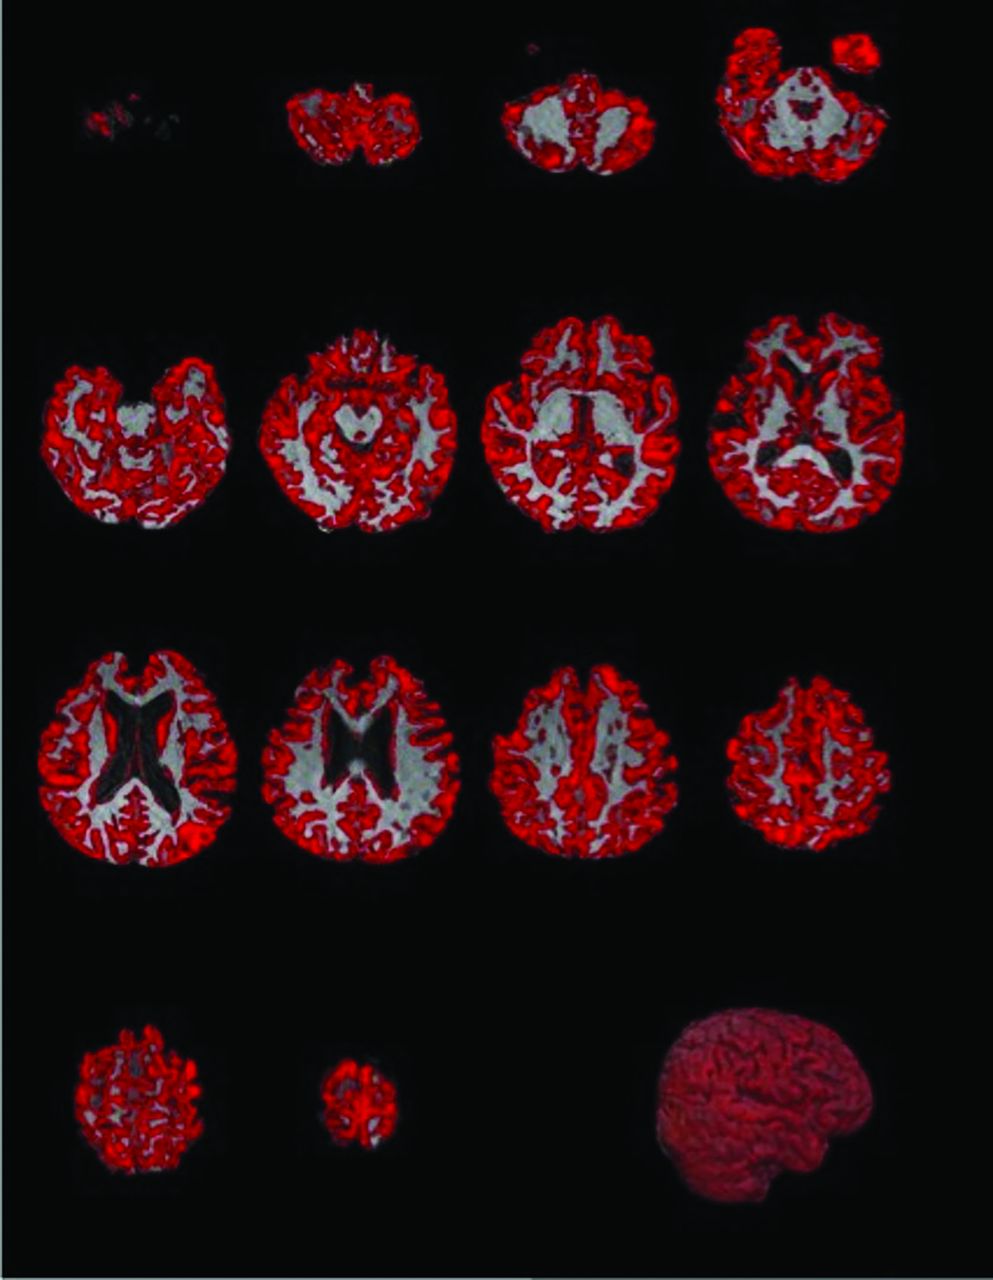
GM/CSF interface mask in native space for a representative participant.

Image processing pipeline for extracting CBF values for GM, WM, WB, and GM/CSF interface from ASL-CBF images. ASL-CBF images are registered to the native T1 structural images. After brain extraction, a binary mask is created from T1 structural images. Segmentation is used to create binary masks for GM and WM. GM/CSF interface masks were obtained through eroding GM masks and subtracting them from the original GM masks. The binary masks are multiplied with the ASL-CBF images in native space to extract the mean CBF value for each masked region.
Statistical Analysis
Continuous variables are presented as mean and standard deviation. Categoric variables are presented as frequencies. Patients were divided into those with none-to-minimal WMH (Fazekas 0–1) versus moderate-to-severe WMH (Fazekas 2–3). The Wilcoxon rank sum test was applied to study the relationship between continuous predictors and WM disease. Fisher exact test was used to evaluate the relationship between categoric predictors with WM disease. The significance threshold was set at a 2-sided P value < .017 with Benjamini and Hochberg correction for multiple comparisons. The area under the receiver operating characteristics (ROC) curve for separating the cohort into no-to-minimal versus moderate-to-severe SVD was calculated. Comparisons of ROCs for ASL CBF in the different regions were done by using the DeLong method. All statistical analyses were performed by using STATA software (Stata Statistical Software Release 18, StataCorp).
RESULTS
Subjects
A total of 207 healthy participants with brain MRI scans were identified from the Stanford ADRC (n=109) and the 15O-water PET study database (n=98). Eighty-seven and 34 subjects were excluded because of age <50 years and technically inadequate ASL-CBF or FLAIR images, respectively. Of the remaining 86 subjects, only 11 had moderate-to-severe WMH based on the Fazekas scale (Table). Then, of the remaining 75 subjects, 21 were selected by matching the sex and nearest age of each of the high SVD subjects. The study flowchart is shown in Fig 1. This resulted in 32 age-matched participants with the following demographics: none-to-minimal WMH (Fazekas 0–1): n=21, mean age, 69.9 ± 9.7 years, 12 women; moderate-to-severe WMH (Fazekas 2–3): n=11, mean age, 71.6 ± 9.7 years, 6 women. The Table highlights the demographic and SVD imaging characteristics within the 2 groups. An example of the imaging data is shown in Fig 4.

CBF maps of the WB, WM, GM, and GM/CSF interface by using ASL in 2 subjects with minimal versus moderate-to-severe WMH (Fazekas score: 0–1 versus 2–3).
ASL-CBF Quantification
WB, WM, GM, and GM/CSF interface CBF are shown in Fig 4 for the 2 groups. The mean ASL CBF in the WM and along the GM/CSF interface CBF were lower in the group of participants with moderate-to-severe WMH (P = .036 and .019, respectively; Table).
Relationships between CBF and SVD Metrics
nGCI had the strongest negative correlation with Fazekas score, total WMH volume, PVS grade, and average total SVD score (r= −0.68, −0.67, −0.54, −0.54, respectively; P < .001). While mean ASL measurements in WB, WM, GM, and GM/CSF interface were all lower in the group of participants with higher total SVD score, only WM and GM/CSF interface CBF measurements showed a statistically significant difference between the 2 groups (P = .036 and 0.019, respectively), but the highest CBF difference between the 2 groups was along the GM/CSF interface (Table). The mean nGCI was lower in the group of participants with worse SVD burden (Table). The nGCI measurement had the highest area under the ROC curve (0.95, 95% CI: 0.87–1.0) (Fig 5) to separate Fazekas 0–1 from Fazekas 2–3 patients. The total WM, GM, WB, and GM/CSF interface CBF had the following areas under the receiver operating characteristics curve (0.79 [95% CI: 0.62–0.95], 0.71 [95% CI: 0.52–0.91], 0.65 [95% CI: 0.44–0.86], and 0.77 [95% CI: 0.58–0.95], respectively).

ROC curves for multiple perfusion metrics (WM, GM, WB, GM/CSF interface, and nGCI-CBF) to predict WMH severity (Fazekas 0–1 versus 2–3). nGCI-CBF had the highest area under the ROC curve (0.95).
DISCUSSION
In this study, we evaluated ASL-based CBF measurements in different brain regions and correlated them with SVD markers in cognitively normal older individuals. We found that the normalized ASL signal along the GM/CSF interface (nGCI) was lower in those with higher Fazekas scores. We also found that subjects with lower CBF along GM/CSF interface had worse total WMH volume, PVS grade, and average total SVD score. These findings may advance our understanding of the quality of blood flow to the brain in patients with SVD. To our knowledge, no previous study has characterized ASL CBF of the GM/CSF interface. However, consistent with previous studies, reduced global WM CBF in patients with higher grade WMH has been previously demonstrated by using multiple modalities, such as xenon-CT, PET, SPECT, and MRI (including ASL).5,6,21 While multiple cross-sectional studies showed an association between more WMHs and reduced CBF, longitudinal associations varied and remain unclear.5,6 Our findings concord with Han et al,6 who found a decreasing trend of WM and GM CBF with higher WMH burden. Notably, in their study, the association with GM CBF was not significant after adjusting for age and sex.
The arterial supply to the GM and WM of the brain differs in attenuation and distribution due to the distinct metabolic demands of these tissues. While the arterial supply of the GM primarily comes from the cortical and superficial perforating arteries, the WM supply is mainly from the longer perforating arteries, which extend from cortical arteries and enter the subcortical WM.17,18 These arteries are long and often begin to coil and spiral as they enter the WM. It was suggested that WM CBF could depend on the proximity to the cortex, given that arteries perfusing the WM are branches originating from the cortical surface, making the WM more susceptible to ischemia due to fewer collateral pathways.17 Chronic ischemia is characterized by CBF decline and has been identified as a significant contributor to the development of SVD, specifically in the cortical and superficial perforating arteries near the blood-to-CSF barrier at the cortical surface, which are particularly vulnerable to CBF reductions.2,11,17 We speculate that these differences in ASL signal along the GM/CSF interface between patients with minimal versus high-grade SVD could be due to delayed blood flow and longer than average arrival times in the group with high-grade SVD, though this could not be proved by using a single-delay ASL sequence. This delayed blood flow, which is an index of cortical perfusion, may reflect dysfunction in the cortical/superficial perforating arteries, leading to abnormally delayed flow in the upstream capillaries supplying the deep WM. These disruptions could correspond to regions where WMH and PVS manifest, potentially indicating future sites responsible for SVD-related clinical complications, such as subcortical acute ischemic events and/or vascular cognitive impairment.
Our finding that nGCI correlated with the total SVD score may provide a more practical framework for better evaluating overall brain health. SVD is an increasingly large health burden that is associated with about 25% of ischemic strokes, most hemorrhagic strokes, and vascular dementia.11,22 Recently, the strict boundaries separating cognitive impairment, vascular dementia, stroke, and SVD have faded, with a greater emphasis on overall brain health, which can be assessed by using SVD MR markers.8,11,23,24 Although the STRIVE criteria have standardized the nomenclature of SVD markers, studies have shown that combining these MR SVD markers and using a more comprehensive approach to assess total SVD burden19 can offer a more pragmatic way of assessing overall brain health, which has been shown to be a prognostic indicator of cognitive impairment, gait and mood disorders, and recurrent stroke.19,25,26 However, in practice, distinguishing between the different individual neuroimaging markers of SVD can be challenging and time-consuming, as they are often closely interconnected. Therefore, our proposed nGCI may better inform on overall brain health.
Reduced CBF on ASL has recently gained traction as a potential biomarker for SVD that may play a key role in the development of SVD, though associations between SVD and reduced CBF in WM and GM remain controversial, likely secondary to perfusion measurement errors.5⇓-7,13⇓-15,21 For better quantification of perfusion with ASL, partial volume correction can be used to disentangle the signals from GM and WM within any voxel.15,16 Traditionally, the CSF contribution to the total ASL perfusion signal is assumed to be zero, and only GM and WM perfusion values are extracted. However, it was shown in a recent study that labeled water does, in fact, exchange into the CSF to create a measurable CSF-ASL signal, which can be visualized by using long TE ASL sequences. Such sequences are not used for standard clinical ASL,16 including in the current study. However, including such sequences in research studies of SVD may be helpful in better understanding the glymphatic waste clearance system and lead to a better understanding of SVD pathogenesis. Correlation of potential CSF-related ASL signal with measurements that could be made on clinical ASL sequences, such as nGCI, might enable more widespread evaluation of any possible glymphatic component to ASL.
While Petitclerc et al16 proposed a modified ASL MRI sequence by using ultra-long-TE ASL to extract and directly measure the CSF-ASL signal contribution at the blood–CSF barrier, doing so in our study is difficult since we used standard clinical ASL parameters only. However, our findings may support but cannot prove the CSF-ASL contribution as we demonstrated that CBF changes along the GM/CSF interface have the highest correlation with WMH and PVS severity in elderly subjects with normal cognition, which are best captured by the nGCI perfusion metric, a potential novel marker of SVD severity. Further, longitudinal studies are required to determine the potential role of nGCI as a predictive marker of future SVD progression.
Several limitations of this study should be noted. First, this is a small, retrospective, single-site, exploratory study. Since this was not the point of the original studies, only a few subjects had severe WMH, which limits the evaluation of a wide range of SVD. All subjects were scanned on the same scanner, which probably improved any variability due to vendor, but which may not translate to studies done on other scanner types. Further, the use of an eroded GM mask to probe the GM-CSF boundary may be limited but it was chosen as the best objective way to identify relevant voxels. Additionally, while multidelay ASL provides more accurate CBF quantification by accounting for variations in arterial transit times, particularly in the SVD populations, most of our subjects had only single-delay ASL. Also, the postlabel delay of 2025 ms, while recommended by prior white papers for clinical imaging, may be insufficiently long to capture flow if it is severely delayed; this is a fundamental challenge with ASL, balancing the sensitivity of the technique with sensitivity to very slow flow. Future studies should include multidelay ASL with long labeling and longer postlabel delays.27 While age and sex matching reduce confounding, certain vascular risk factors (eg, hypertension, diabetes, smoking) may result in exogenous variation of CBF measurements. However, all the participating subjects were healthy controls without a known medical history of vascular risk factors.
CONCLUSIONS
We have evaluated ASL-based perfusion in multiple brain regions in patients with and without moderate-to-severe SVD markers. We found a potential marker related to the GM-CSF junction that might be associated with worse SVD. Future, larger, prospective studies, including longitudinal follow-up, could test whether this metric is indeed related to the development of SVD.
Footnotes
Disclosure forms provided by the authors are available with the full text and PDF of this article at www.ajnr.org.
References
- Received November 12, 2024.
- Accepted after revision December 30, 2024.
- © 2025 by American Journal of Neuroradiology


Jump to section
Related Articles
Cited By...
- No citing articles found.