
Abstract
BACKGROUND AND PURPOSE: Measurement of the mean upper cervical cord area (MUCCA) is an important biomarker in the study of neurodegeneration. However, dedicated high-resolution (HR) scans of the cervical spinal cord are rare in standard-of-care imaging due to timing and clinical usability. Most clinical cervical spinal cord imaging is sagittally acquired in 2D with thick slices and anisotropic voxels. As a solution, previous work describes HR T1-weighted brain imaging for measuring the upper cord area, but this is still not common in clinical care.
MATERIALS AND METHODS: We propose using a zero-shot super-resolution technique, synthetic multi-orientation resolution enhancement (SMORE), already validated in the brain, to enhance the resolution of 2D-acquired scans for upper cord area calculations. To incorporate super-resolution in spinal cord analysis, we validate SMORE against HR research imaging and in a real-world longitudinal data analysis.
RESULTS: Super-resolved (SR) images reconstructed by using SMORE showed significantly greater similarity to the ground truth than low-resolution (LR) images across all tested resolutions (P < .001 for all resolutions in peak signal-to-noise ratio [PSNR] and mean structural similarity [MSSIM]). MUCCA results from SR scans demonstrate excellent correlation with HR scans (r > 0.973 for all resolutions) compared with LR scans. Additionally, SR scans are consistent between resolutions (r > 0.969), an essential factor in longitudinal analysis. Compared with clinical outcomes such as walking speed or disease severity, MUCCA values from LR scans have significantly lower correlations than those from HR scans. SR results have no significant difference. In a longitudinal real-world data set, we show that these SR volumes can be used in conjunction with T1-weighted brain scans to show a significant rate of atrophy (−0.790, P = .020 versus −0.438, P = .301 with LR).
CONCLUSIONS: Super-resolution is a valuable tool for enabling large-scale studies of cord atrophy, as LR images acquired in clinical practice are common and available.
ABBREVIATIONS:
- 9HPT
- 9-hole peg test
- CSC
- cervical spinal cord
- EDSS
- Expanded Disability Status Scale
- HR
- high-resolution
- LR
- low-resolution
- MSFC
- MS functional composite
- MSSIM
- mean structural similarity
- MUCCA
- mean upper cervical cord area
- PMJ
- pontomedullary junction
- PSNR
- peak signal-to-noise ratio
- SMORE
- synthetic multi-orientation resolution enhancement
- SR
- super-resolved
- T25FW
- timed 25-foot walk
SUMMARY
PREVIOUS LITERATURE:
The spinal cord is a critical target for investigation in MS. Previous works have described the calculation of spinal cord measurements from HR spinal cord and brain images but have not yet explored clinically acquired spinal cord scans, which differ in resolution and acquisition. In the brain, super-resolution techniques, such as SMORE, have been shown to improve the reliability and accuracy of automated algorithms on images with LR, isotropic voxels.
KEY FINDINGS:
Super-resolution enables quantitative analysis of spinal cord MRI, even in cases of anisotropic voxels and slice gaps. SR images produce results that are on par with HR results and can be used in analysis with HR images of the brain and spinal cord for atrophy analysis.
KNOWLEDGE ADVANCEMENT:
We have learned that super-resolution techniques can advance quantitative analysis for large-scale clinical studies. With this knowledge, previous limitations in image analysis can be questioned, and new, more extensive studies can be conducted with greater inclusivity and depth.
MRI is a commonly used imaging technique for diagnosis, monitoring, and prognostication in people living with neurodegenerative diseases such as MS.1⇓⇓⇓⇓⇓-7 While the bulk of imaging in clinical research has focused on the brain and its substructures, a growing community is investigating the spinal cord in the context of neurodegenerative diseases.8⇓⇓⇓-12 The mean upper cervical cord area (MUCCA) has been shown in the literature to be strongly correlated to disability, especially as related to motor and sensory tasks.13⇓-15 However, wide dissemination of this measurement remains limited because of the extreme rarity of dedicated high-resolution (HR) spinal cord imaging in practice, where low-resolution (LR) clinical imaging or brain imaging predominates.
The whole spinal cord can be clearly delineated from the surrounding CSF by using HR, isotropic T2-weighted imaging with long echo times to minimize intracord contrast.16,17 These scans are well-standardized but take 4–5 minutes to acquire and have limited clinical utility, reducing their feasibility in clinical settings. In research settings, dedicated spinal cord scanning is still uncommon, with multiple groups proposing to use specific HR T1-weighted brain scans already acquired in brain studies, including the upper part of the cervical spinal cord (CSC).18,19 These scans are common in research settings and are increasingly being adopted for clinical imaging. However, their implementation is still limited to research-centric clinical centers and needs widespread adoption.20 Additionally, the acquisition (T1-weighted versus T2-weighted) affects the results of automated spinal cord segmentation because of the different appearance of tissues like the CSF, dura mater, and white matter lesions, and differences in image generation like partial voluming.19,21 MUCCA measurements from T1-weighted and T2-weighted images are highly correlated, but adjustment would be required to use them interchangeably in longitudinal analyses.
Clinically, sagittal T2-weighted images of the CSC are more common. However, these images are 2D-acquired with thick slices and sometimes a gap between the slices. For example, some of the highest resolution clinical spinal cord images are 3‖0 (read “3-skip-0”), indicating a 3-mm slice thickness and no gap (0 mm), and are commonly acquired with the resolution 3‖1 (3-mm slice with 1-mm gap). This kind of imaging is unsuitable for quantitative evaluation due to the measurement variation across resolutions and subjects.
Synthetic multi-orientation resolution enhancement (SMORE) is a self-supervised zero-shot super-resolution technique designed to enhance the resolution of anisotropic acquisitions.22,23 SMORE has been extensively validated in the brain but has yet to be explored in the spinal cord. As SMORE is a zero-shot method, it requires no external training data. Instead, the training data are simulated from the target image, and training is performed on the simulation data (hence, self-supervised). This means that SMORE can be applied to a new image contrast or body part without collecting training data or worrying about training/testing bias. This differs from other super-resolution approaches (like SynthSR,24 TSCTNet,25 and others26) that utilize extensive training data sets and are currently focused on brain imaging.
This work aims to demonstrate super-resolution as a tool to enable MUCCA estimation on clinically available LR spinal cord images. We make 2 important contributions:
1) Demonstrate improved outcomes when using super-resolved (SR) images for MUCCA calculation compared with LR images using simulated data sets with HR ground truth.
2) Measure CSC atrophy in a real-world longitudinal data set with SR LR 2D spine and HR 3D brain images.
The results from this work set the stage for large-scale studies of CSC atrophy, which can be conducted at reduced cost and with increased availability by using existing clinically acquired imaging data sets.
MATERIALS AND METHODS
Imaging Data Sets
HR Research Data Set.
Paired LR and HR images are rarely acquired, especially in the CSC. To validate super-resolution techniques quantitatively, we simulate LR data from acquired HR data. To this end, we selected 200 participants who underwent a research MRI protocol on a single Prisma scanner (Siemens Healthineers) as a part of an existing Institutional Review Board-approved study of people with MS. Imaging included T1-weighted 3D MPRAGE of the brain (resolution: 1 mm isotropic, orientation: sagittal, FOV: 256 × 240 × 160 mm, TE: 2.98 ms, TR: 2300 ms, TI: 900 ms, flip angle: 9 deg, acceleration: 2, acquisition time: 5:12 minutes) and T2-weighted 3D turbo spin echo (T2-SPACE; Siemens) of the CSC (resolution: 0.8 mm isotropic, orientation: sagittal, FOV: 256 × 256 × 64 mm, TE: 120 ms, TR: 1500 ms, flip angle: 120 deg, averages: 1.4, acceleration: 3, acquisition time: 4:02 minutes). These images comprised our HR research data set and are HR isotropic volumes, which allow us to create simulated LR images and still provide a ground truth for quantitative assessment. Additionally, the paired brain and CSC images will enable us to quantitatively compare results from HR 3D T1-weighted brain and HR 3D T2-weighted CSC images.
Real-World Longitudinal Data Set.
Simulated LR data are insufficient to evaluate super-resolution’s effect in a real-world longitudinal study. To validate our methodology in a real-world example, we created a subcohort (n = 130) from people with MS in the Institutional Review Board–approved study that had multiple available clinical brain and/or spinal cord MRIs acquired between 2013 and 2023. Using the Johns Hopkins Precision Medicine Access Platform, we retrieved all brain and spinal cord scan sessions for each subcohort participant from the clinical imaging system collected over these 10 years. Each scan session contributed 1 volume to the analysis: a 3D T1-weighted MPRAGE brain image, a 3D T2-weighted CSC image, or a 2D LR T2-weighted CSC image. Each of these images was directly acquired on a clinical scanner. This real-world longitudinal data set consisted of 700 images with an average of 5.6 images per person and an average follow-up of 4.1 years. In terms of image acquisition, 315 (45%) images were LR 2D T2-weighted CSC, 180 (26%) images were HR 3D T2-weighted CSC, and 205 (29%) images were HR 3D T1-weighted brain. Representative images from the real-world longitudinal data set are shown in Fig 1.

A representative history of 1 subject from the real-world longitudinal data set. The 4 images (left to right): 2D LR T2-weighted CSC (3‖0.5), 3D T1-weighted brain, 3D T2-weighted CSC, and 2D LR T2-weighted CSC (3‖0).
Blinded Clinical Testing
All participants underwent the MS functional composite (MSFC), which is composed of 3 separate tasks: a timed 25-foot walk (T25FW), a 9-hole peg test (9HPT), and a paced auditory serial addition test.27 For this analysis, we focused on the motor-associated tasks T25FTW and 9HPT, hypothesized to be the most relevant to spinal cord atrophy. Additionally, each participant was scored using the Expanded Disability Status Scale (EDSS),28 which favors motor disability in scoring.
Cord Segmentation and MUCCA Calculation
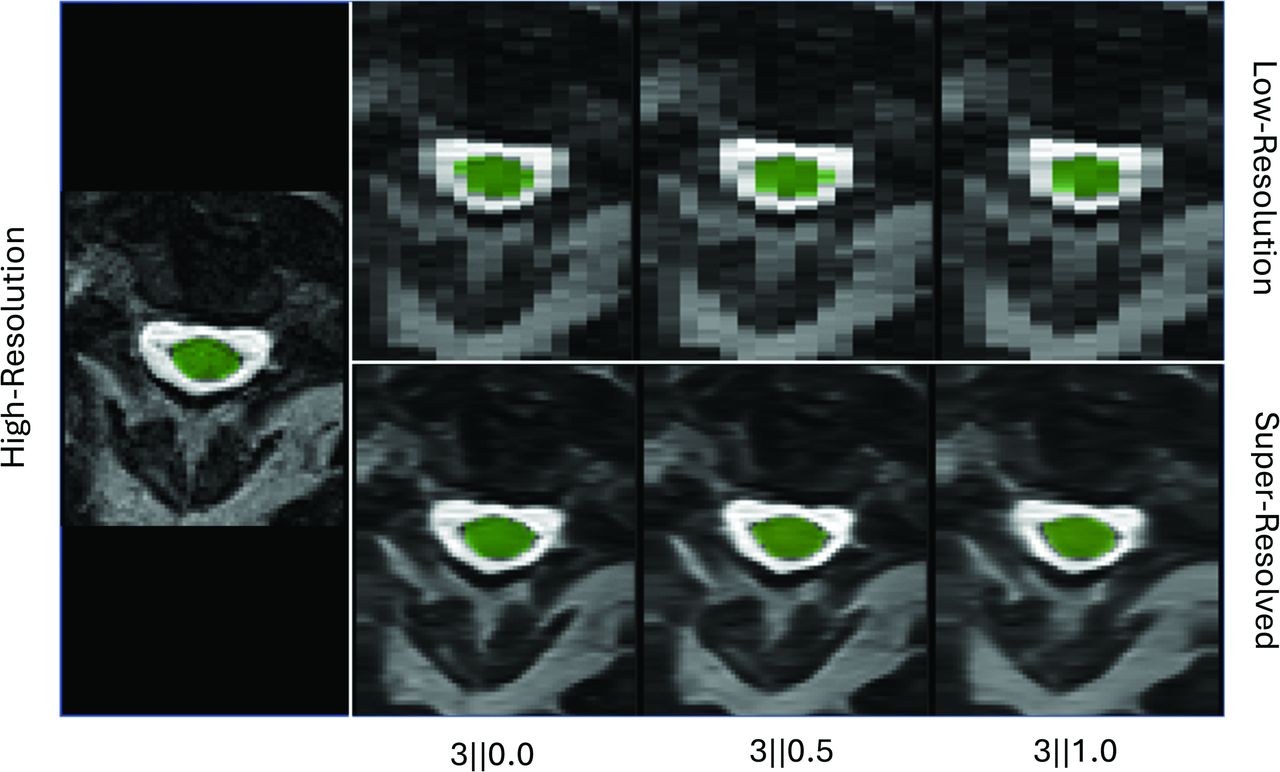
The Spinal Cord Toolbox29 (v6.0) was used for all spinal cord segmentations and analyses. The spinal cord was segmented by using SCT’s DeepSeg30 algorithm. Then, MUCCA was calculated by averaging the cross-sectional area over 3 cm beginning 6 cm below the pontomedullary junction (PMJ) as described by Bédard et al.31 This was empirically more stable than averaging over the C2-C3 levels, as it did not require segmentation of the vertebral levels, and vertebral segmentation often required manual intervention, especially in T1-weighted brain images. All volumes, including T1-weighted brain and LR T2-weighted CSC acquisitions, were segmented by using this method. Quality assurance was done manually by a single rater (B.E.D.) to ensure high-quality segmentation. In <5% of cases, the PMJ had to be manually delineated. We selected manual PMJ landmarks by using a graphical viewer in SCT, which took 1 rater (B.E.D.) less than 15 minutes for all missed cases. Example segmentations are shown in Fig 2.

Segmentation of representative HR, simulated LR, and SR volumes.
Super-Resolution
Super-resolution with SMORE has 2 main steps: training and inference. As SMORE is a zero-shot, internally trained method, it must be trained on each image. SMORE is designed for super-resolution on anisotropic images, meaning that the resolution of the 3D volumes has 2 HR “in-plane” directions and 1 LR “through-plane” (or slice) direction. Training in SMORE takes advantage of this fact by degrading the HR in-plane slices in 1 direction to simulate the appearance of a through-plane slice. Simulated LR patches are generated by using the “degrade” feature of the “radifox-utils” Python package (https://github.com/jh-mipc/radifox-utils) to apply a learned slice profile to the HR patches. This relative slice profile is predicted by estimating the slice profile for resolution enhancement of a single image only (ESPRESO),32 which uses adversarial learning to produce a slice profile that generates similar distributions of real and simulated through-plane patches. After degradation, these simulated LR and real HR pairs train a convolutional neural network to generate HR patches. Once the model is trained, real through-plane slices are passed through the network to generate the SR slices. SMORE was implemented by using v4.0.5 of the open-source software (https://gitlab.com/iacl/smore).
SMORE Validation
To generate validation data from the HR research data set, the HR T2-SPACE images were artificially degraded to match the 4 most common resolutions found in our clinical system for sagittal CSC images: 3‖0, 3‖0.3, 3‖0.5, 3‖1. Degradation was performed by using the “degrade” function of the “radifox-utils” package. This blurred the image by using a real-world slice profile constructed with the Shinnar–Le Roux algorithm33 according to the slice thickness, then downsampled the image according to the slice spacing. This is a more accurate simulation of a 2D-acquired image than downsampling alone because it more closely approximates the actual acquisition process of an MRI.
SR and LR images were compared with HR ground truth images by using mean structural similarity (MSSIM)34 and peak signal-to-noise ratio (PSNR).35 LR images were interpolated to the HR grid by using the “resize” function of “radifox-utils” and a third-order B-spline for these comparisons. Each SR, LR, and HR image was also segmented, and MUCCA was calculated. MUCCA measurements from SR and LR images were compared with the HR results. Pearson rho was used to determine the correlation between SR (or LR) and HR results at each simulated resolution. A paired Student t test was used to determine whether the differences between SR/LR and HR MUCCA values and between image metrics (PSNR and MSSIM) were statistically significant.
To determine the effect of super-resolution on outcomes in a clinical study, MUCCA values from LR, SR, and HR images were modeled as predictors of clinical outcomes by using linear regression models and partial correlation by using the Pearson method. The Williams test was used to determine the significance of correlation differences. Simulated real-world cohorts were created from the LR and SR data sets by randomly selecting a resolution (3‖0.0, 3‖0.3, 3‖0.5, or 3‖1.0) for each participant. This simulates a real-world data set that might contain acquisitions acquired at different resolutions. Models and correlations were adjusted for age and sex at birth. The size of our data set could result in significant results that might not hold up in smaller samples. To evaluate this, we created 100 bootstrapped samples of 50 subjects to evaluate the effect of sample size on the significance of the relationships.
Longitudinal Analysis
Correction for T1-Weighted Brain Results.
The HR T1-weighted brain scans in the HR research data set were segmented, and MUCCA was calculated for each image. A linear fit of MUCCA from T2-weighted spinal cord images versus MUCCA from T1-weighted brain images was used to determine an additive correction factor. This corrective factor was applied to all T1-weighted values in the longitudinal cohort.
Modeling Atrophy.
Each 2D T2-weighted cervical spinal cord image from the real-world longitudinal data set was SR by using SMORE. Then, all SR 2D and acquired 3D images (brain or spine) in that data set were segmented, and MUCCA was calculated for each image. A linear mixed-effects model of MUCCA versus time was fit, adjusting for age at first scan and sex.
RESULTS
Qualitative Evaluation
As shown in Fig 2, SMORE substantially recovers the anatomic structure of the spinal cord. This is reflected in the segmentation quality, as SCT is not only limited to the appearance of the spinal cord in the image (after interpolation within the algorithm) but also in the final resolution of the output. LR inputs produce blocky segmentations that match the image resolution. We found that interpolation before segmentation with SCT to avoid this difference made results substantially worse, likely because of the additional internal interpolation step within SCT. In the SCT segmentations, we noted 4 subjects where some LR images had poor-quality segmentation. In contrast, all SR and HR images were correctly segmented. As stated above, some images required manual delineation of the PMJ; this was mainly due to anatomic variation in the subjects and was the same in all images regardless of resolution or preparation. However, there were a few LR images at 3‖1 where the PMJ was not correctly delineated when it was correct on the HR image.
Quantitative Validation of SMORE
As previously shown in the brain, SR images are more similar to the ground truth than degraded images by MSSIM and PSNR (Fig 3). This difference is statistically significant across all tested resolutions. However, downstream analysis feasibility depends more on the quality of the segmentation results than image quality.

Boxplots of MSSIM and PSNR values calculated for interpolated LR and SR images at each resolution compared with HR ground truth.
Figure 4 shows that LR and SR results have an excellent correlation with HR results. The SR correlation results are nearly 1, even in the 3‖1 case, while the LR results drop to 0.92. The SR results also demonstrate an excellent correlation between SR images of different resolutions. While LR results maintain some areas of excellent correlation between resolutions, some pairings begin to dip below 0.9.

Heat maps showing the correlation between each simulated resolution and other simulated resolutions, as well as with ground truth HR for both SR and LR images.
In Fig 5, we directly plot the relationship between SR/LR results and the corresponding HR results, including an identity line. We can see that the SR values are tightly following and not significantly different from the identity line (3‖0.0: P = .12, R2 = 0.98; 3‖0.3: P = .21, R2= 0.95; 3‖0.5: P = .77, R2 = 0.96; 3‖1.0: P = .15, R2 = 0.96), with some increased variation around that as the slice gap increases to 1 mm. The LR results show over-segmentation of the cord compared with HR, which increases with cord area. This is evident across all resolutions and is most extreme in 3‖0.3 and 3‖1.0 cases. This deviation in slopes from identity is also statistically significant (P < .0001 for all resolutions, R2 = 0.91, 0.90, 0.86, 0.85 for each resolution, respectively).

Scatterplots of SR (left) and LR (right) versus HR MUCCA values. The line of fit and 95% CI are plotted in the corresponding color, and the identity line is plotted in gray.
Clinical Correlations
Figure 6 shows the correlations between MUCCA values derived from the HR, LR, and SR randomized resolution data sets and clinical outcomes. For each of these outcomes, correlations to MUCCA values are statistically significant (EDSS: LR r = −0.22/P = .010, SR r = −0.30/P = <.001, HR r = −0.30/P = <.001; T25FW: LR r = −0.22/P = .014, SR r = −0.26/P = .003, HR r = −0.27/P = .002; 9HPT: LR r = −0.29/P = <.001, SR r = −0.38/P = <.001, HR r = −0.38/P = <.001). Additionally, LR correlations were significantly less than the HR correlations (EDSS: P = .04; T25FW: P = .046; 9HPT: P < .001), while the SR correlations were not significantly different. In linear modeling, the slope of the effect from LR MUCCA values is underestimated compared with HR values (EDSS: LR = −0.033, HR = −0.052; T25FW: LR = −0.009, HR = −0.014; 9HPT: LR = −0.250, HR = −0.394). However, the effect slope for SR values is nearly identical to the effect of HR values (EDSS: SR = −0.051; T25FW: SR = −0.013; 9HPT: SR = −0.388). Additionally, the significance of the LR relationships did not hold up in smaller samples. For example, our bootstrapped samples yielded an average P value of .12 when comparing LR MUCCA values to T25FW. At the same time, the HR and SR MUCCA values retain a significant relationship with T25FW (average P = .005).

Scatterplots of MUCCA values versus clinical outcomes: EDSS (left), 9HPT (middle), and timed 25-ft walk (right). Each plot shows points, lines of fit, and 95% CI for HR (blue), SR (orange), and LR (green).
T1-Weighted Brain Comparison
Figure 7 shows the relationship between MUCCA results from T1-weighted brain images and T2-weighted CSC images from the HR research data set. These measures are strongly correlated ( ρ = 0.974). However, there is also a clear and substantial bias ( β = 9.184). We can adjust for this bias by adding a correction factor to all T1-weighted brain results. This allows the recovery of a near-identity relationship (slope not significantly different from 1, P = .100). This adjustment was used to correct the T1-weighted brain results in the longitudinal analysis.

Left, Scatterplot of HR brain versus HR spine MUCCA value. Right, Violin plot showing the distribution of MUCCA values from brain and spine data sets.
Longitudinal Analysis
Table 1 shows the fixed effects from the linear mixed-effects model fit on the LR and SR versions of the real-world longitudinal data set. The decline of MUCCA over time (the “Time (from first scan)” effect) is lower than expected and not significant in either the LR or SR models. After inspecting the data, it was clear that the difference in contrast between the 2D-acquired and 3D-acquired images created a bias in the results. After adjusting for this bias (Table 2), the SR model now has a much larger time effect that is statistically significant. The cohort using LR images also shows a slight increase in the time effect, but it is not significant. There is also a significant effect of age at first scan, sex, and age at first scan × time in the SR model.
Results from linear mixed-effects models of MUCCA over time
Results from linear mixed-effects models of MUCCA over time, including a correction for 2D spinal cord images
DISCUSSION
This paper demonstrates the ability of SMORE to super-resolve clinically available CSC MRIs, enabling reliable MUCCA calculation. This was validated directly in simulated experiments of the HR research data set and the real-world longitudinal data set.
In simulated experiments, SMORE was able to recover qualitative anatomic features and improve quantitative similarity to HR ground truth images, especially around the spinal cord. We see similar improvement quantitatively, although all values are lower than in previous work with SMORE in the brain,23 indicating a greater effect of differences in resolution on the degraded anatomy. The spinal cord is a small structure in a large cervical spine MRI, so structures outside the spinal canal can likely explain differences in qualitative and quantitative results.
Acquisition parameters in clinical cohorts are highly variable. For this reason, interoperability between contrasts and resolutions is critical to successful longitudinal analysis of clinically acquired images. In a real-world clinical environment, it is common for resolution to change over time as patients get imaging at other locations or protocols are updated. Correlation between different resolutions is vital to the feasibility of this method over longitudinal follow-up. Even the LR images produce MUCCA values with high to excellent correlations to the HR ground truth and each other. Yet, they still underestimate correlations when compared with clinical outcomes. In these simulated experiments, near-identity is required to maintain the clinical correlations with sufficient statistical power. In our exploration of clinical correlations, we also see the possibility of producing a statistically significant result that underestimates the true effect according to HR data. This large cohort (n = 200) produced significant results with very low P values; however, similar findings were not obtained in smaller random subsets.
In addition to SR clinical spine images, we include HR 3D T1-weighted brain images in our definition of “clinically available MRI.” While this is still uncommon in many clinical settings, using these images without contrast is becoming more popular, especially as reimbursement of quantitative image analysis is now possible for US payers.36 This also allows the frequent follow-up of MUCCA when brain MRIs are performed without spine imaging. In clinical data sets, different providers have different ordering preferences that can depend on the individual patient, so following patients with every scan possible enriches the available data pool.
Limitations
Analysis of our longitudinal cohort showed that SR images play an important role in reliably quantifying atrophy. However, this analysis has limitations. As demonstrated by the statistical bias between 2D and 3D T2-weighted images, there is a need to control for the differences in image contrasts. In this analysis, we performed statistical correction by adjusting for 2D image contrast in our mixed-effects model, but other methods should also be explored to control for these differences. We also have no well-controlled validation for the effect sizes presented here. We plan to conduct this validation by collecting longitudinal HR spinal cord scans of research participants and comparing the results to longitudinal follow-ups that include other scan types. Additionally, we have not studied the effect of spinal cord lesions on the analysis. Lesion evolution is essential to MS pathology, especially in the spinal cord. In this work, we focused on the effects of atrophy by using T2-weighted images where lesions are less apparent. However, these are inconsistent across acquisitions and may contribute to the differences in volumes in LR CSC images and the T1-weighted brain images, where lesions could be mistaken for CSF more frequently than in the heavily T2-weighted 3D CSC images.
Future Directions
We look forward to expanding this cohort in terms of size and follow-up duration to investigate these findings further. We also look to collect more detailed clinical data over the participants’ histories to correlate longitudinal patterns to clinical outcomes. In particular, we look to expand this analysis to include lesions to study the inflammatory pieces of the MS disease course. Ultimately, we aim to investigate MUCCA as a predictor and monitor of clinical progression.
CONCLUSIONS
We demonstrated the feasibility of MUCCA calculations after super-resolution from clinically available MRIs such as 2D-acquired T2-weighted spinal cord images and 3D T1-weighted brain images. We showed that SMORE produced SR image volumes from 2D-acquired spinal cord scans with MUCCA values nearly identical to HR ground truth images. We also demonstrated that these, along with corrected values from T1-weighted brain scans, can be used in a longitudinal analysis of spinal cord atrophy in people with MS. This opens the door to large, inclusive, clinically derived data sets for large-scale analysis of spinal cord atrophy.
Acknowledgments
We want to thank the participants in this study, along with their families and caregivers, for their time and effort.
Footnotes
This work is funded by the National MS Society (FG-2008-36966 PI: Dewey, TA-1805-31136 PI: Fitzgerald), the National Institutes of Health (R01NR018851 PI: Mowry, R01NS082347 PI: Calabresi, K01MH121582 PI: Fitzgerald), and the National Science Foundation (DGE-1746891 PI: Remedios). Peter A. Calabresi has received personal consulting fees from Biogen, is a PI on grants to JHU from Annexon and Biogen, and consults for Disarm Therapeutics. Ellen M. Mowry receives research funding from Genentech and Biogen, consults for BeCareLink LLC, and receives royalties for editorial duties from UpToDate. All other authors declare no conflicts of interest related to the content of this article.
Disclosure forms provided by the authors are available with the full text and PDF of this article at www.ajnr.org.
References
- Received June 11, 2024.
- Accepted after revision October 3, 2024.
- © 2025 by American Journal of Neuroradiology


Jump to section
Related Articles
Cited By...
- No citing articles found.