
Graphical Abstract

SUMMARY:
7T neuroimaging has known problems with B1+ strength, homogeneity and B0 susceptibility that make imaging in the inferior brain regions difficult. We investigated the utility of a decoupled 8 × 2 transceiver coil and shim insert to image the internal auditory canal (IAC) and inferior brain in comparison to the standard Nova 8/32 coil. B1+, B0, and the T2 sampling perfection with application-optimized contrasts by using flip angle evolution sequence (SPACE) were compared by using research and standard methods in n = 8 healthy adults by using a Terra system. A T2 TSE was also acquired, and 2 neuroradiologists evaluated structures in and around the IAC, blinded to the acquisition, by using a 5-point Likert scale. The Nova 8/32 coil gave lower B1+ inferiorly compared with the whole brain while the transceiver maintained similar B1+ throughout. SPACE images showed that the transceiver performed significantly better, e.g., the transceiver scored 4.0 ± 0.8 in the left IAC, compared with 2.5 ± 0.8 with the Nova 8/32. With T2-weighted imaging that places a premium on refocusing pulses, these results show that with improved B1+ performance inferiorly, good visualization of the structure of the IAC and inferior brain regions is possible at 7T.
ABBREVIATIONS:
- IAC
- internal auditory canal
- pTx
- parallel transmit
- RF
- radiofrequency
- SAR
- specific absorption rate
- SPACE
- sampling perfection with application-optimized contrasts by using flip angle evolution
- VHOS
- very high order B0 shim
With its higher SNR, increased spectral dispersion, and increasing clinical availability, 7T MRI has demonstrated capability to more frequently identify subtle lesions for patients with epilepsy and multiple sclerosis than at 3T.1⇓–3 However, for pathologies occurring in the posterior fossa, obtaining sufficient image quality is known to be challenging. With single transmit coil designs, the shortened electromagnetic wavelength4 at ultra-high field has been linked with loss of contrast and/or signal loss in the lateral temporal lobes and cerebellum, depending on the applied pulse sequence. For example, spin-echo images commonly show B1+ based shading problems while SWI does not. B0 inhomogeneity is also a well-known independent problem, with strong susceptibility gradients from anatomic interfaces (eg, air-bone-brain5) at the skull base. In these regions, the B1+ and B0 effects can combine to further degrade image quality, particularly for pulse sequences with limited radiofrequency (RF) bandwidth.
Multiple transmit coils provide better performance, with most ultra-high-field systems now available with 8-channel transmit capability. However, T2-weighted image quality with the commonly used parallel transmit (pTx) coil (Nova 8/32) is suboptimal inferiorly.6,7 The 8 × 2 inductively decoupled transceiver provides an alternative coil that can improve image quality in the inferior brain.7 The transceiver gives improved B1+ homogeneity by its increased number (16 channels) of transmit elements and limiting interelement interactions through its decoupled design. This performance can be augmented by a B0 shim insert,8,9 which improves whole brain B0 homogeneity by approximately 50% in comparison to vendor shimming. This report compares the image quality in the internal auditory canal (IAC) and inferior brain region between the standard (Nova 8/32, vendor shimming) and research (transceiver, shim insert) strategies as assessed by 2 neuroradiologists, blinded to the type of acquisition.
MATERIALS AND METHODS
This prospective study was conducted with University of Missouri institutional review board approval and followed the Strengthening the Reporting of Observational studies in Epidemiology guidelines (Supplemental Data). T2 sequences (particularly the sampling perfection with application-optimized contrasts by using flip angle evolution [SPACE; Siemens] sequence) were established given their dominant role in IAC imaging. Comparison images were acquired in n = 8 healthy adults (mean age 35.3 ± 18.0, range 21–63), evaluating vendor (by using the Nova 8/32, Nova Medical, RF B1+ shimming and standard B0 shimming) and research methods (by using the 8 × 2 decoupled transceiver, Resonance Research; RF B1+ shimming and research B0 shimming8,10). The transceiver has available safety monitoring data (virtual observation point files), however, has not gone through FDA review. With high contrast seen from TSE images,11 we also acquired T2-weighted 3D TSE images and T1 FLAIR 2D TSE images as the basic elements of the IAC protocol.
RF Coil Strategies
A 7T pTx Terra system (Siemens) with 8 pTx channels was used throughout. With the SPACE acquisition, each volunteer was imaged by using the 2 different RF coils and B0 shimming methods. For each strategy, the parameters were optimized by using the available individual methods.
The Nova 8/32 coil used the RF and B0 shimming with vendor supplied hardware and software. Minimal differences were observed in image quality when RF shim settings of patient versus volume specific over the target region were used (Supplemental Data). To provide a more consistent B1+ profile for whole-brain imaging that typically targets an RF amplitude of 11.7 μT (500 Hz), patient-specific RF shimming was used. For B0 shimming, first, second, and 4 third-order shims (Terra standard) were used.
For the research strategy, the transceiver was tuned and matched for each volunteer (required <1.5 minutes). RF shimming (phase and amplitude) was performed as described10 targeting 11.7 μT amplitude over the intracranial volume (ie, equivalent to patient-specific RF shimming). Because of a lack of clear superiority for regional (IACs and surrounding structures) versus whole-brain RF shimming, a whole-brain optimization was used (equivalent to the vendor patient-specific optimization). For B0 shimming, the transceiver’s compact size enables use within a very high order B0 shim (VHOS) insert, providing 7 third-order shims and 8 fourth-order shims.8 We were unable to do this with the Nova 8/32 because it did not fit within the VHOS.
For both coils, vendor-determined reference voltages were used.
Imaging Sequences
T2 SPACE12 images were evaluated by 2 board certified neuroradiologists, blinded to the acquisition. These images were acquired at 0.6 mm3 resolution, TR/TE of 2.8 s/140 ms covering a 160 × 160 × 50 mm FOV, acquisition time 7:02. For this group, n = 9 (5 women, 4 men) subjects were recruited; 1 male subject was unable to completely fit within the transceiver, leaving n = 8 subjects.
For the T2 TSE, we previously showed that the transceiver is superior in SNR in the inferior brain region to the Nova 8/32,7 thus to avoid duplicative work, the TSE was acquired only in the research strategy. A total of n = 8 subjects were studied at 0.6 mm3 resolution, TR/TE of 3 s/169 ms covering 172 × 172 × 25 mm FOV, acquisition time 7:15. To define a reasonable clinical protocol, we also acquired T1-weighted FLAIR 2D TSE images. The T1-weighted images were not evaluated for image quality, because the role of the T1-weighing is to provide contrast with gadolinium, which was not available for this study. For demonstration purposes with the T2 TSE, n = 3 subjects were each studied with vendor and research methods. For all studies, first level specific absorption rate (SAR) monitoring was used, with values typically ranging between 85%–99%.
Radiologic Evaluation
Tables 1 and 2 show the anatomic structures evaluated with the SPACE and TSE data and the 5-point Likert scale. The comparison between the 2 strategies was tested for significance by using unpaired 2-tailed t tests. To demonstrate the sensitivity to IAC pathology, images from n = 3 patients with known vestibular schwannomas are shown in the Supplemental Data. The imaging parameters are also shown in the Supplemental Data.
| Left IAC | Right IAC | Left Trigem | Right Trigem | CBL | Temporal | Brainstem | |
|---|---|---|---|---|---|---|---|
| T2 SPACE | |||||||
| Nova 8/32 | 2.5 ± 0.8 | 1.4 ± 0.9 | 3.7 ± 0.9 | 3.7 ± 0.9 | 3.1 ± 1.2 | 2.5 ± 0.8 | 3.2 ± 1.1 |
| 8 × 2 transceiver | 4.0 ± 0.8 | 3.8 ± 1.0 | 4.4 ± 0.6 | 4.4 ± 0.6 | 4.1 ± 0.6 | 3.4 ± 0.7 | 3.9 ± 0.9 |
| Ratio | 1.76 ± 0.72 | 1.65 ± 0.74 | 1.23 ± 0.30 | 1.25 ± 0.30 | 1.47 ± 0.48 | 1.44 ± 0.45 | 1.30 ± 0.33 |
| Two-tailed unpaired P values | < .001 | < .001 | < .05 | < .05 | < .005 | < .005 | < .05 |
Note:—CBL indicates cerebellum; IAC, internal auditory canal; SPACE, sampling perfection with application-optimized contrasts by using flip angle evolution; Trigem, Trigeminal.
Table 1: Ratings for T2 SPACE, comparing Nova 8/32 and transceiver coils
| T2 3D TSE | IAC | Trigem n | VC n | Facial n | Cochlea n | Nervus Intermed | Superior Vestib n | Inferior Vestib n | ||||
|---|---|---|---|---|---|---|---|---|---|---|---|---|
| Left | 4.6 ± 0.4 | 4.6 ± 0.5 | 4.6 ± 0.4 | 4.7 ± 0.5 | 4.5 ± 0.7 | 2.6 ± 0.6 | 4.0 ± 0.9 | 3.6 ± 0.9 | ||||
| Right | 4.6 ± 0.5 | 4.6 ± 0.5 | 4.4 ± 0.7 | 4.4 ± 0.5 | 4.3 ± 0.8 | 2.8 ± 0.8 | 3.9 ± 0.5 | 3.5 ± 0.7 | ||||
| Falciform crest+Bells | Cochlea (interscalar sep, modiolus) | Basal scala media | Superior semicirc canal (ant limb) | Lateral semicirc canal | Posterior semicirc canal | |||||||
| Left | 2.6 ± 0.6 | 4.3 ± 0.6 | 2.2 ± 1.3 | 4.3 ± 0.7 | 3.5 ± 1.2 | 3.9 ± 1.2 | ||||||
| Right | 2.5 ± 0.5 | 4.1 ± 0.6 | 2.0 ± 1.4 | 4.4 ± 0.7 | 3.7 ± 1.4 | 4.4 ± 0.8 | ||||||
For all ratings, the 5-point Likert scale is used: 1, not visible; 2, visible but with complete loss of detail; 3, visualization of some anatomic detail; 4, visualization of most anatomic detail; 5, perfect visualization of anatomic detail.
Note:—IAC indicates internal auditory canal; VC, Vestibulocochlear; Trigem, Trigeminal; Intermed, Intermedius; Vestib, Vestibular; n, Nerve.
Table 2: Ratings for T2 3D TSE, all acquired with transceiver
RESULTS
B1+ and B0 Comparison
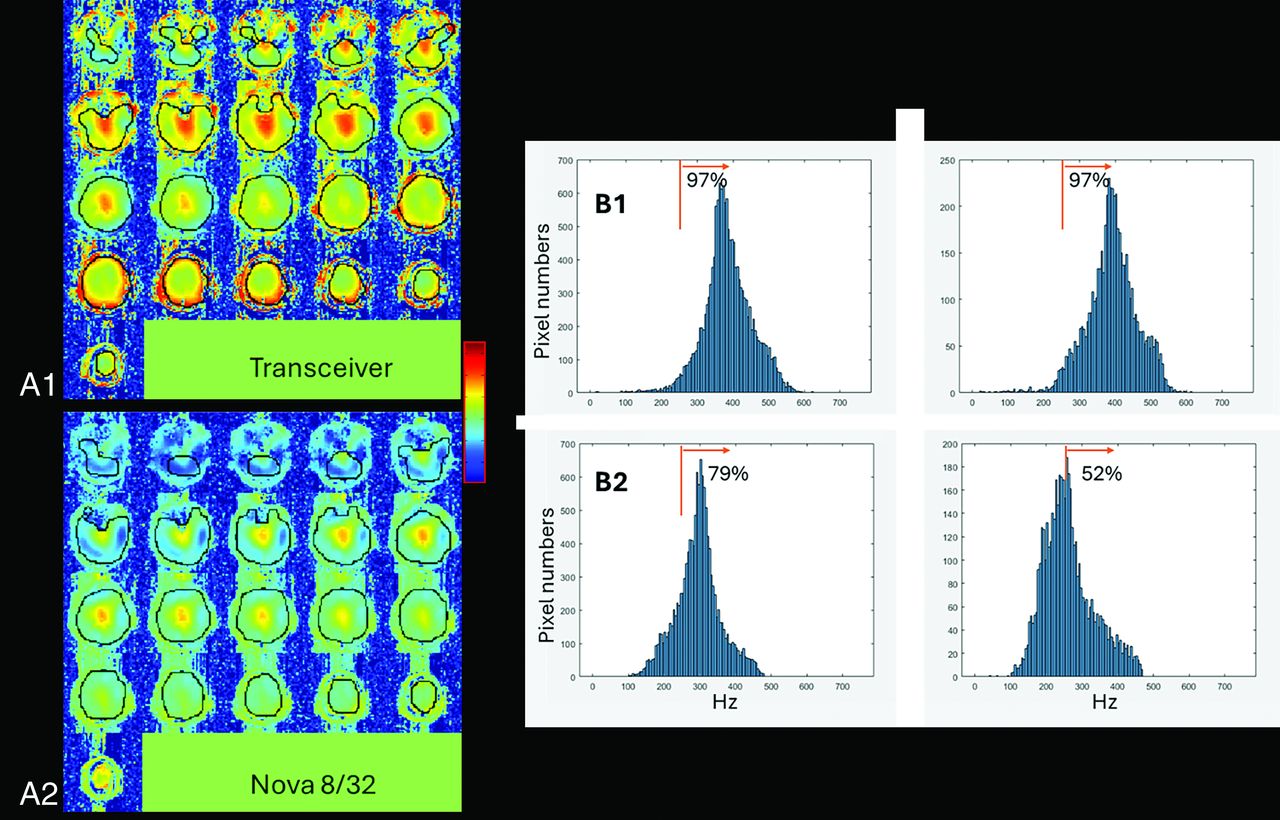
Figure 1A shows the B1+ maps from a volunteer acquired with the transceiver and Nova 8/32. For the transceiver, over the group of n = 8 subjects, whole-brain RF shimming achieved a mean whole-brain B1+ 9.1 ± 0.4uT (mean, SD across subjects). In the IAC itself there is little signal available to measure B1+ performance; however, the mean B1+ achieved across the group over the surrounding tissue in the inferior brain region (see Fig 1 for volumes) was 9.2 ± 0.3 μT, yielding a within-subject ratio of achieved B1+ whole brain/inferior brain of 0.98 ± 0.02. To characterize the variation in B1+ over the ROIs, we determined the fraction of pixels, F250, with B1+ greater than 250 Hz, ie, >5.8 μT (this is 50% of the typically targeted B1+ of 11.7 μT). F250 was determined with each ROI; for the subject shown in Fig 1, the number of pixels is approximately 14,000 for the whole brain; approximately 5000 for the inferior brain. For the transceiver, the F250 was 96.0% ± 1.1% for whole brain versus 95.4% ± 1.7% inferiorly (Fig 1B).

Comparison of B1+ from the 2 RF coils, (A) shows the simultaneous transmission B1+ maps and (B) shows histogram distributions. (A1, B1) are from the transceiver; (A2, B2) from the Nova 8/32 coil. In (A), the B1+ maps are scaled identically and show the ROIs (black outlines). In B, histograms of B1+ values, from either the whole brain (left) or the inferior brain (right). For the whole brain, all slices are included; for the inferior brain, pixels from the 9 most inferior slices were used. The orange line identifies the 250 Hz threshold with the indicated percentages (F250, fraction of pixels above 250 Hz). For A and B, patient specific RF shimming was performed over the whole head with Siemens standard reference voltages applied to generate the measured B1+. All data are shown from a single volunteer.
For the Nova 8/32 acquired with patient-specific RF shimming, the group averages and standard deviation for the B1+ means in the whole brain and inferior brain regions were 6.7 ± 0.1 μT and 6.2 ± 0.2 μT, respectively. The lower B1+ obtained with the Nova 8/32 is due vendor-based reference voltage optimization. The F250 was substantially smaller than the transceiver, achieving 76.6% ± 4.0% and 49.4% ± 7.2% over the whole brain and inferior brain regions, respectively. The histograms for F250 (Fig 1B) show a skewed B1+ distribution from the Nova 8/32 inferiorly while the distributions are similar between inferior and whole brain for the transceiver.
Figure 2 shows the whole brain B0 maps after shimming, comparing the vendor and research methods. From n = 8 subjects with the vendor shimming, the mean intracranial whole-brain SD σWB,B0 was 47 ± 9 Hz, which was substantially worse than the 30 ± 7 Hz achieved when using the research shimming routines. Inclusion of VHOS hardware further reduced the achieved σWB,B0 to 24 ± 5 Hz.

B0 maps acquired after shimming from a matched subject, (A) standard shimming; (B) research software shimming methods and vendor shim hardware; and (C) research shim software and hardware (VHOS). For this subject, the mean σB0 (Hz) over the intracranial regions were 51.8, 34.4, and 22.3, respectively. σB0 = standard deviation of B0 field.
T2 SPACE and TSE Images with Radiologic Evaluation
Figure 3A shows the T2 SPACE images comparing the transceiver and Nova 8/32. Although the Nova coil typically demonstrates excellent signal retention through the central brainstem region, there is a substantial shading in signal intensity laterally into the auditory canals, temporal lobes, and cerebellar hemispheres. In contrast, the transceiver exhibited superior signal retention laterally. Figure 3B shows matched T2 TSE images. The performance appears more comparable between the 2 coils but is consistent with previous data7 showing the high SNR with transceiver giving greater clarity for identification of the nerve roots.

T2-weighted images. A, T2 SPACE axial and coronal images are shown from the level of the IAC. B, T2 SPACE axial and coronal images are shown from the level of the rostral medulla. C, T2 TSE axial and sagittal images targeting the IAC. The images on the left were acquired with the transceiver RF coil and the VHOS. The images on the right were acquired with the Nova 8/32. All panels are scaled identically between the transceiver and Nova 8/32. No additional image filtering or denoising was applied.
Table 1 summarizes the radiologic image quality evaluation for the SPACE images comparing the 2 coil strategies. Two-tailed unpaired t tests showed significantly better visibility for all structures considered with the transceiver; P values ranged from < .001 to .05. Table 2 summarizes the radiologic image quality for the TSE images from the transceiver. The transceiver’s ability to detect pathology in patients with schwannoma is shown in the Supplemental Data with a listing of the imaging parameters.
DISCUSSION
B1 and B0 Performance
At 7T, the middle and posterior fossae are commonly difficult to image due to low amplitude and inhomogeneous B1+ as well as extensive B0 inhomogeneity. In the Nova 8/32, Fig 1 (histograms) shows that inferiorly, the B1+ is down-shifted compared with the whole brain. In comparison, the transceiver maintains similar B1+ performance whether targeting inferior or whole brain regions. Consistent with this and previous work,7,10 the SPACE data (Fig 3) with the transceiver demonstrates improved image contrast compared with the Nova 8/32 inferiorly. The source of this inferior B1+ improvement is due to the 2 rows with increased number of transmit loop elements13,14 (8 each row) and their decoupled design,15 which enables better control over the transmission B1+ (the 16 elements of the 8 × 2 transceiver are powered in the 8-channel Terra by using 8 splitters). The B1+ performance can likely be further improved by providing more flexible control per transmission element, eg, a 16-channel transmit system driving each element independently. Furthermore, this study was performed by using solely RF shimming (ie, the same RF waveform to each RF channel); more optimal performance might be further achieved through use of full parallel RF transmission.15,16
Due to the small size of the IACs and other nerves, it is difficult to obtain an accurate measurement of the B0 values across them. In these data, with standard workflow we did not see a significant change in IAC image quality with the research strategies for shimming, although it clearly affected the image quality of the inferior frontal lobe as shown in the SPACE images (Fig 4).

Matched subject T2 SPACE images acquired with the transceiver, showing the effect of insufficient B1+ and B0 shimming. A, Images acquired with 100% B1+, showing 2 axial planes at the midtemporal lobe and IAC-cerebellum. B, Matched images acquired with 70% B1+ showing the same 2 axial planes. With each axial slice, images acquired with standard and research shimming (comprising research shim optimization with VHOS hardware) are shown. All pairs are scaled identically between the transceiver and Nova 8/32. The yellow arrows highlight areas showing a B0 effect; the green identifiers highlight areas showing a B1+ and B0 interaction.
Image Quality Between the Two Strategies
With the number of different hardware and software methods implemented, it is useful to consider which components exhibit the greatest effect for image quality. At 7T, the choice of sequence has impact on image quality because of the sequence’s sensitivity to B1+ and B0 performance (eg, the SPACE sequence has sensitivity to both12), which will vary depending on target anatomy. Thus, Figs 1 and 2 show the B1+ and B0 performances; Fig 3 shows their integrated impact. For B1+, the transceiver was able to maintain a relatively consistent B1+ distribution throughout the whole and inferior brain regions. In comparison, the Nova 8/32 exhibited a downward shift of the B1+ amplitudes inferiorly, causing this coil’s limited z-coverage.
The impact of B0 on image quality is known to be a function of B1+ and target anatomy (ie, susceptibility). With insufficient B1+ amplitude, the bandwidth of the slab or slice selection is limited, which when combined with poor B0 inhomogeneity, will result in signal loss. Although without a detailed knowledge of the SPACE pulse sequence, it is difficult to quantify the impact of poor B0 shimming, we can empirically consider this question. Figure 4A shows that with the transceiver operating at normal B1+, the SPACE sequence generates reasonable signal intensity at the level of the temporal lobe and IAC-cerebellum. There is some signal loss over the inferior frontal lobe which improves with research B0 shimming, while at the IAC-cerebellum level, the images appear appropriate with minimal sensitivity to research shimming. To examine the interaction between B1+ and B0, Fig 4B shows the matched images but acquired with 33% lower B1+. As expected under low B1+, there is an overall decrease in SNR compared with the normal B1+ acquisition. However, the standard shimmed images now show shading artifacts through the cerebellum and temporal lobe, while the matched research shimmed images in the IAC-cerebellum region show improved image consistency (a similar but smaller effect is seen in the temporal lobe). This is consistent with the limited bandwidth of the SPACE sequence: if the B1+ is adequate, requirement for B0 homogeneity is small; however in conditions with low B1+, substantial B0 inhomogeneity will cause signal shading and loss.
Limitations
The Z-longitudinal coverage of the transceiver was a limitation, as subjects with large heads did not fit well within the coil. This is demonstrated by our data (not all volunteers could be studied due to size). With this experience, we have implemented guidance (in addition to exclusions for claustrophobia) for body mass index restriction (<30, not clinically obese) for the transceiver.
Another limitation was the lengthy acquisition durations due to SAR limitations applied when using RF shimming with the Terra. Improvements in acquisition time/coverage could be expected with more optimal SAR management and/or running with a fixed circularly polarized configuration. However, with the Nova 8/32, the B1+ differences between whole versus inferior brain would persist.
CONCLUSIONS
Overall, these methods give considerable improvement over standard strategies with more consistent imaging through the IAC, cerebellar hemispheres, and temporal lobes. The improvement is due to the transceiver’s larger number of elements, their geometry, and decoupled design, providing better control over RF propagation, local SAR, and higher B1+ amplitudes inferiorly. Together with better B0 homogeneity, these strategies allow limited bandwidth sequences such as the T2 SPACE sequence to more reliably image the IAC and inferior brain region. It is recognized however, for greater routine clinical utility, these methods are limited based on subject head size. Expanding the cohort size, patient diversity and comparison with 3T at appropriate resolutions will be necessary to evaluate the broader applicability of the transceiver. Finally, it should be stated that with any coil strategy, deep learning methods may help to correct transmission and receptivity problems, although in this difficult location, demonstration with patient data will be needed.
Footnotes
This research has been supported by the U.S. Department of Health and Human Services, National Institutes of Health, Office of Strategic Coordination, Common Fund, NIH NIBIB EB024408.
Disclosure forms provided by the authors are available with the full text and PDF of this article at www.ajnr.org.
References
- Received June 26, 2024.
- Accepted after revision October 7, 2024.
- © 2025 by American Journal of Neuroradiology


Jump to section
Related Articles
Cited By...
- No citing articles found.