
Graphical Abstract

Abstract
BACKGROUND AND PURPOSE: Single large-scale mitochondrial deletion syndrome (SLSMD) comprises devastating mitochondrial diseases often classified into 3 major clinical syndromes: Kearns-Sayre syndrome (KSS), chronic progressive external ophthalmoplegia (CPEO), and Pearson syndrome (PS). Nevertheless, there remains large clinical variability and overlap among these SLSMD groups. Therefore, further stratification is required for more precise prognostication and clinical management. Through detailed description and analysis of longitudinal neuroimaging changes, we sought to determine the neuroradiologic hallmarks of SLSMDs and define their expected imaging progression to further delineate their natural history.
MATERIALS AND METHODS: A retrospective, longitudinal study of 40 children with SLSMDs at 3 mitochondrial disease centers was performed. MRI review assessed the prevalence and progression of brain lesions in different regions with statistical significance testing and Kaplan-Meier analysis. Hierarchical cluster analysis was performed for involved brain regions to stratify findings into imaging phenotype groups.
RESULTS: Among 40 patients with SLSMD (median age 9.26 years; interquartile range: 5.16–13.1), 67.5% had KSS, 15% had KSS with a prior history of PS (PS→KSS), and 10% had PS only. A well-delineated phenotype could not be specified for 1 (2.5%) and 2 (5%) individuals who had CPEO-plus (CPEO + extraocular symptoms). Regardless of presentation, initial MRI of patients with KSS revealed lesions within selective areas of the upper brainstem tegmentum. Follow-up MRIs in 26 patients showed well-defined progression along other select brainstem and white matter regions. Log-rank tests demonstrated varying onset times by lesion type. Cluster analysis revealed 2 distinct neuroimaging groups: 1) KSS, CPEO-plus, and PS→KSS versus 2) PS and not otherwise specified individuals. KSS, CPEO-plus, and PS→KSS showed indistinguishable neuroimaging features regardless of the initial clinical presentation.
CONCLUSIONS: We describe the first comprehensive longitudinal neuroimaging pattern analysis in a multicenter, international SLSMDs disease pediatric cohort, delineating a predictable progression of brain lesions, regardless of clinical phenotype.
ABBREVIATIONS:
- CPEO
- chronic progressive external ophthalmoplegia
- GP
- globus pallidus
- IQR
- interquartile range
- KSS
- Kearns-Sayre syndrome
- NOS
- not otherwise specified
- mtDNA
- mitrochondrial DNA
- PS
- Pearson syndrome
- PS→KSS
- individuals with initial presentation of PS converting to KSS during the progression of the disease
- SLSMD
- single large-scale mitochondrial deletion syndrome
SUMMARY
PREVIOUS LITERATURE:
Previous studies have insufficiently characterized the neuroimaging features, variations, and longitudinal changes in children affected by single large-scale mitochondrial deletions (SLSMD), mostly including only small neuroimaging cohorts or mere cross-sectional studies of patients with Kearns-Sayre syndrome.
KEY FINDINGS:
Diagnostic neuroimaging reveals predictable progression of the lesions in most patients with SLSMD, with lesions distributed as:
1. Involvement of upper brainstem nuclei and tegmental tracts.
2. Basal ganglia lesions, particularly discrete involvement of the globus pallidus.
3. Supratentorial white matter changes exhibiting selective involvement of subcortical regions progressing centripetally.
4. Almost 2/3 of patients with SLSMD have lesions involving the spinal cord.
KNOWLEDGE ADVANCEMENT:
Our study contributes to the existing literature by demonstrating that SLSMD neuroimaging similarities can help in better stratification of these patients and indicates a predictable evolution of lesions. Early findings typically involve the brainstem and basal ganglia, while subcortical white matter changes progress as the disease advances.Additionally, the imaging profiles of some Pearson syndrome patients who evolve into Kearns-Sayre syndrome are indistinguishable from those of other Kearns-Sayre patients. Although reduced diffusivity can occasionally be observed, diffusion-weighted imaging (DWI) in most of SLSMD pediatric patients is primarily influenced by T2 shine-through effects. Subcortical white matter changes in these disorders show associated linear stripes, resembling the appearance of a coral reef snake.
Single large-scale mitochondrial DNA (mtDNA) deletion syndromes (SLSMDs) are rare, progressive disorders. They typically present as 1 of 3 major syndromes: Kearns-Sayre syndrome (KSS), Pearson syndrome (PS), or chronic progressive external ophthalmoplegia (CPEO). These syndromes vary in severity and age of onset, with symptoms often following a spectrum.1⇓–3 Leigh syndrome may also occur in patients with SLSMD due to overlapping brain lesions, although the neuroimaging features are usually distinct.3⇓⇓–6 Common symptoms include pigmentary retinopathy, ophthalmoplegia and ptosis, as well as cardiac abnormalities, ataxia, and hearing loss.1⇓⇓–4
Syndromic distinctions are often based on age of onset and predominant symptoms. PS usually appears in late infancy or early childhood, with hematologic abnormalities, exocrine pancreatic insufficiency, failure to thrive, and lactic acidosis. KSS typically develops in childhood, causing short stature, hearing loss, eye muscle paralysis, and heart block. Some patients with PS who survive early complications may later develop KSS symptoms, though not all patients with KSS have a history of PS.3,7 It is not clear which patients will transition to KSS. A small subset of patients with SLSMD may not fit well into any described syndrome3,8 and are classified as not otherwise specified (NOS). CPEO commonly presents in various mitochondrial myopathies with bilateral ptosis and limited eye movement. When combined with other symptoms like muscle weakness, optic atrophy, neuropathy, and endocrine issues, it is referred to as CPEO-plus.
Some intrinsic clinical variation of SLSMDs may relate to the location and size of the deletion within the mtDNA genome and the level of heteroplasmy.9 However, knowledge gaps exist in the literature. Some early investigations of SLSMDs have reported only a weak association among the deleted genes within the SLSMD, biochemical pathway defects, and clinical phenotypes.10⇓–12 Overall, studies have been largely contradictory in their attempt to discretely stratify clinical features of SLSMDs, failing to fully explain their pathophysiology and progression and preventing the pursuit of clinical trials to evaluate the relative impact of targeted interventions effectively.3,8,9
Neuroimaging, particularly brain MRI, offers a valuable tool for enhancing syndrome delineation.6,13⇓⇓–16 Indeed, MRI analyses may contribute to the finer delineation of the natural history of SLSMDs, which commonly involve progressive neurologic features, thereby enabling improved prognosis guidance and clinical management. Here, we perform a thorough analysis of baseline and longitudinal brain neuroimaging changes in patients with SLSMDs seen at 3 large mitochondrial disease centers. This work aims to identify the neuroimaging hallmarks of patients with SLSMDs relative to clinical syndrome diagnoses and to establish an imaging pattern of disease progression. This information can be used in conjunction with clinical and genetic data for better delineation of these syndromes and their natural history.
MATERIALS AND METHODS
Study Design, Participants, and Data Collection
A retrospective and longitudinal multicenter study was performed according to the Strengthening the Reporting of Observational studies in Epidemiology statement17 and included 40 individuals, all with pediatric clinical onset (0–17 years old), diagnosed with SLSMDs from January 2000 to 2022. Patients were selected from 3 large mitochondrial clinical centers: Children’s Hospital of Philadelphia, Bambino Gesu Children’s Hospital; and Seattle Children’s Hospital with the study conducted under research protocols approved by their respective institutional review boards. All patients were genetically confirmed to have a mitochondrial disorder, with a definitive diagnosis of SLSMD. Additional genetic data, including levels of heteroplasmy, location, and size of the deletion were also collected. At least 1 brain MRI study available was required for study inclusion. Among the 40 children included, 24 had MRI studies of the spine. A transversal analysis of 11 of these spine studies had been previously published.18 Data for this study were collected from medical records and imaging databases of the respective participating centers. The clinical syndromes were divided based on current classification3 after a final decision defined by each senior pediatric neurologist involved in this study. All the senior neurologists, who had extensive experience in mitochondrial disease, reviewed the medical records to provide diagnosis, verify the accuracy of the collected clinical data, and participated in multiple interinstitutional consensus meetings for further decision and agreement of the patient’s classification, including KSS, PS, (individuals with initial presentation of PS converting to KSS during the progression of the disease [PS→KSS]), CPEO, CPEO-plus, and SLSMD-NOS.
Imaging Analysis
In this multicenter retrospective study, MR imaging was performed clinically on a variety of 1.5T and 3T scanners (Siemens Healthineers, GE Healthcare, Philips Healthcare). MR imaging examinations were qualitatively reviewed at each center and data were collected by using a standardized imaging evaluation.6 Brain MRI studies, previously obtained for clinical indications, were independently reviewed by the neuroradiologists with focused clinical and imaging research expertise in mitochondrial disorders at each center, with a second review and final agreement performed during consensus meetings among the neuroradiologists from different centers. The reviewers had between 8 and 17 years of pediatric neuroradiology experience at referral children’s hospitals. Imaging reviewers were blinded to patients’ detailed genetic and clinical features, including levels of heteroplasmy and size of the deletions, as well as syndromic classification, but not to the primary genetic diagnosis of SLSMD. MR imaging findings were evaluated according to signal-intensity characteristics (minimum of T2WI, FLAIR, T1WI, DWI, and SWI) and detailed locations in the brain and spine when available. Detailed analysis was performed by using a location roadmap including cortex, superficial, deep, and periventricular white matter, basal ganglia (caudate, putamen, and globus pallidus), thalami, hypothalamus, selective regions of the brainstem including superior, middle, and inferior cerebellar peduncles, along with selective brainstem white matter tracts and gray matter nuclei, as well as cerebellar lesions involving the dentate nuclei, cerebellar white matter, and cerebellar cortex. Although each scan was scored independently, the reviewers did have access to prior imaging. Each scan timepoint data sheet was filled out independent of the prior imaging data.
Statistical Analysis
Descriptive statistics were used to summarize the demographic and clinical characteristics of the participants. Comparing the continuous variables was done by using Mann-Whitney U test. The prevalence of brain lesions, along with their corresponding anatomic locations, are presented as frequencies and percentages. To compare the frequency of brain lesions between the initial and last MRIs in patients who had at least 1 follow-up, the McNemar test was used. The regions of interest were considered independent. Additional imaging data were collected to compare the frequency of brain lesions and their changes over time for all patients who had at least 1 additional study. Follow-up MR scans were analyzed with the same standard approach done for the baseline MRI. Detailed descriptions were recorded for all follow-up MRIs performed with at least 6-month intervals, including the last available brain MRI scan. To demonstrate and compare lesion development trends over time, Kaplan-Meier curves and the log-rank test were used. To perform an unbiased phenotypical grouping of brain MRI findings among the various clinical phenotypes, an unsupervised hierarchical clustering analysis by using the Ward method was used. Fisher exact test and Mann-Whitney U test were done to compare the variables between these 2 clusters. All analyses were performed by using SPSS Statistics (Version 26.0; IBM) and the Scipy library (Version 1.9.1) in Python (Version 3.9.13). A P value of less than .05 was used to indicate statistical significance.
RESULTS
A total of 40 patients with pediatric-onset SLSMDs were evaluated in the study based on inclusion and exclusion criteria (Supplemental Data). Twenty-one individuals (52.5%) were girls. Within the cohort, 27 individuals (67.5%) had KSS, 4 (10%) had PS, and a well-delineated phenotype could not be specified for 1 (2.5%) individual. The remaining cases exhibited progressive disease and overlapping syndromes, with 6 (15%) individuals having had PS that evolved to KSS phenotypes and 2 (5%) individuals with CPEO-plus. One patient had both KSS syndrome and neurofibromatosis type 1.
The patients’ median age at the time of their first MRI was 9.26 years old (interquartile range [IQR]: 5.16–13.1). The median duration between the onset of neurologic symptoms and the first MRI was 3 years (IQR: 0–6). Consistent with previous reports, significant differences in age of onset were noted between PS and KSS cohorts, with patients with KSS being significantly older at a median of 12 years (IQR: 8.3–13.5) versus individuals with PS who had a median of 3.1 years (IQR: 1–4.9), P < .001). However, there was no significant difference between the age of the first MRI between the patients with PS and the patients with PS→KSS (median = 2.47 [IQR: 0.5–4.42] versus 4.99 [IQR: 3.8–7.82], P = .09).
Qualitative analysis of lesion distribution on initial MRI revealed that the most prevalent involvement occurred in the upper segments of the brainstem tegmentum. They included the periaqueductal gray matter (85%), superior cerebellar peduncle (82.5%), medial lemniscus (80%), and substantia nigra (80%). A spider radar plot shown in Fig 1 and summarized in the Supplemental Data displays the relative frequency of lesion locations on MRI. Of note, olivary bodies were not affected in any of the patients with SLSMDs.

Spider (radar) plot demonstrating the prevalence of various imaging abnormalities on all available brain MRI studies in the entire cohort of patients.
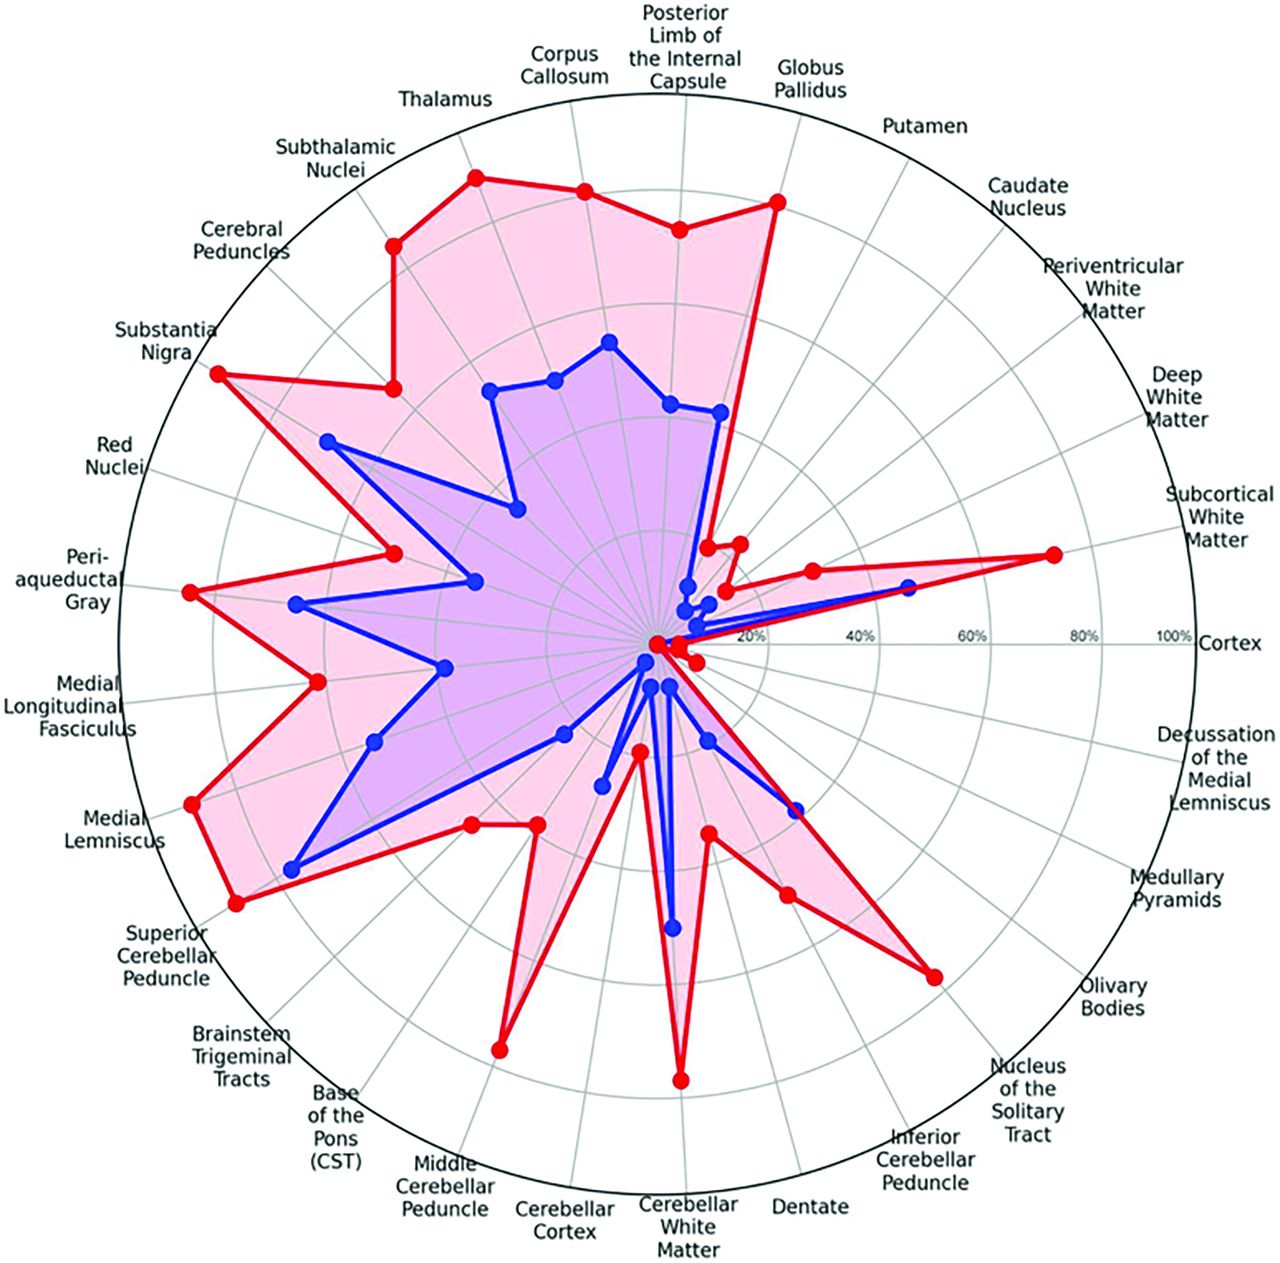
Twenty-six of the 40 individuals (65%) had at least 1 available follow-up brain MRI performed with a greater than 6-month interval from the initial imaging study. Among these 26 patients, 9 had only 1 follow-up MRI, 6 had 2 follow-up MRIs, and 11 had 3 or more follow-up MRIs performed. The change in the prevalence of lesions on the first versus the last available MRI per patient is demonstrated on the second spider radar plot (Figs 2 and 3) and easily visualized with the illustration (Fig 4, Supplemental Data). Progression of the areas of brain involvement was most evident in the brainstem, including the middle cerebellar peduncle (P < .001), medial longitudinal fasciculus (P = .031), medial lemniscus (P = .004), diencephalon including thalamus (P = .002), subthalamic nuclei (P = .008), and white matter including the superficial white matter (P = .016), deep white matter (P = .031), posterior limb of the internal capsule (P = .008), and cerebellar white matter (P = .039). Superficial white matter lesions in patients with KSS, regardless of whether they initially presented with PS or not, most often (82.5%) spared the perivenular regions, with a “coral-reef snake” appearance and had a predominant frontoparietal involvement including, when present, the perirolandic regions at baseline (Fig 5). A comparison of the progression of different lesions over time according to patient age was demonstrated by using Kaplan-Meier analysis as shown in the Supplemental Data.

Spider (radar) plot showing the change in areas of involvement of the brain from baseline MRI (blue) to the last brain MRI (red).

Delineating neuroimaging progression of SLSMD syndromes. Longitudinal MRI changes (axial T2WI) of 2 different patients at 3 time points (A–C). Patient 1 onset at 8 years old and patient 2 onset at 11 years old (A). Follow-up studies after 2 years of onset (B), and 7 and 9 years of onset (C).

Illustration of disease progression through different areas of the brain. SCP = superior cerebellar peduncle; MLF = medial longitudinal fasciculus.

Detailed neuroimaging findings of Kearns-Sayre. Typical neuroimaging features of Kearns-Sayre syndrome including detailed involvement of midbrain (A), basal ganglia and thalamus (B), typical DWI (top) and ADC maps (bottom) shinethrough of the globus pallidus (C), sparing leaflets of the corpus callosum (D), and selective superficial involvement of the white matter with linear perivenular dark stripes, sparing deep white matter regions (E). PAG = periaqueductal gray matter.
Evaluation of DWI demonstrated a small number of baseline and/or follow-up studies (baseline + follow-up MRIs) with lesions showing reduced diffusivity in 10 of 83 (12%). Most of the hyperintense lesions on DWI did not demonstrate low signal on ADC maps (68/83; 78.3%), thus being classified as lesions with “T2-shinethrough.” Five studies showed lesions with facilitated diffusion in the basal ganglia (5/83; 8.5%) (Fig 5).
Hierarchical cluster analysis by using all the neuroimaging variables led to the delineation of 2 broad groups based on imaging features. The dendrogram with the corresponding heatmap of brain lesions for each patient is shown in Fig 6. The first group (cluster) was smaller (n=5), including patients with PS only and NOS patients. The second cluster (n=35) included all patients with KSS regardless of their initial syndromic presentation (ie, PS→KSS) and CPEO-plus. The heatmap demonstrated that while the first imaging cluster had normal brain MRIs or a pure leukodystrophy pattern, the second cluster had lesions in the same selective areas of the brain. Age of onset and the interval between the symptoms and the first MRI were significantly different in these 2 clusters as well. However, there were no significant differences between the size of deletion, heteroplasmy levels, or mortality (Supplemental Data).

Dendrograms and heatmaps of the results of hierarchical cluster analysis of the imaging phenotype based on the areas of involvement on brain MRI for all patients. This cluster analysis delineated 2 broad categories.
Additional spinal involvement was studied in 24 individuals (24/40; 60%). Consistent with prior descriptions, a significant proportion of individuals with SLSMDs (15/24; 63%) had cord involvement, and different patterns of cord lesions were observed. One-third of the children demonstrated selective involvement of the posterior columns (8/24; 33%), followed by anterior horn involvement (3/24; 11%), diffuse abnormal signal alteration (2/24; 8%), central spinal cord involvement (1/24; 4%), and posterior and lateral columns involvement (1/24; 4%). A predominance of cervical cord involvement was seen, with isolated cervical involvement (7/24; 29%) as compared with the thoracic spinal cord (2/24; 8%), or involvement of both (6/24; 25%). In the remaining patients, no spinal cord abnormality was seen. In patients with SLSMDs for whom follow-up studies were available (6/24), spinal cord involvement was observed to show worsening with the appearance of new spinal cord lesions or longitudinal extension (4/6), stable findings (1/6), or resolution of spinal cord involvement (1/6).
DISCUSSION
Here, we describe the results of a multicenter study of 40 pediatric-onset individuals with SLSMDs to provide novel insights into the occurrence and longitudinal progression of neuroimaging features of specific SLSMD disorders. While the largest proportion of patients had clinically defined KSS, several individuals exhibited variable clinical features of different SLSMDs, including CPEO-plus and PS, as well as patients with progressive clinical transition from PS→KSS, and 1 NOS patient. Interestingly, 1 individual manifested both KSS and genetically confirmed Neurofibromatosis type 1 (NF-1), which is consistent with approximately 5% of patients with suspected monogenic disease having more than 1 etiology.19 As distinct brain areas were commonly affected in patients with KSS, neuroimaging is recommended as part of diagnostic criteria for this disorder in addition to clinical, genetic, and laboratory analyses. Specifically, based on our results, diagnostic neuroimaging should assess for involvement of 1) upper brainstem nuclei and tegmental tracts; 2) basal ganglia lesions with discrete involvement of the globus pallidus, and 3) supratentorial white matter changes displaying selective involvement of the subcortical regions.
When comparing the neuroimaging features of patients with KSS with those with KSS who had a preceding history of PS or those with CPEO-plus, no significant differences of the brain MRI lesions were found, suggesting that the neuroimaging phenotype is relatively stable among these SLSMD phenotypes regardless of clinical features and initial syndromic classification. However, neuroimaging features of individuals with PS who had not transitioned to KSS were notably different, characterized by either normal brain MRI studies or with nonspecific diffuse leukodystrophy patterns without significant brainstem involvement. This finding suggests that this neuroimaging feature may be used for differentiating those who will from those who will not progress to KSS. Further investigation, including prospective neuroimaging follow-up over time, is needed to further differentiate PS from PS→KSS in the early stages. Overall, the detection of characteristic early imaging abnormalities of KSS in patients with PS (brainstem involvement) suggests that these individuals are at high risk of transitioning later into KSS. This result highlights the importance of correlating clinical subtypes with neuroimaging features to delineate their expected progression and neurodevelopmental outcomes accurately.
Novel imaging characteristics of brain lesions were observed in patients with KSS, including selective preservation of the affected subcortical white matter in the perivenular regions, giving a coral-reef snake appearance of these changes. This feature has not previously been considered in the differential diagnosis of leukodystrophies with selective subcortical white matter involvement. It is similar to a so-called tigroid skin pattern described for other neurometabolic leukodystrophies (lysosomal disorders), though those disorders involve the deep rather than superficial white matter, such as in metachromatic leukodystrophy and Krabbe disease.20 This finding may provide some degree of specificity for KSS diagnosis, helping to differentiate it from some leukodystrophies that present with predominant subcortical white matter involvement, such as L2-hydroxyglutaric aciduria21 and other recently described rare mitochondrial disorders.22
In contrast to many mitochondrial lesions, most of our SLSMD cases did not show lesions with reduced diffusivity but rather manifested mostly with T2-shinethrough (78%). This distinction may have important clinical implications not only in evaluating disease activity in natural history and treatment response but also in investigating the pathophysiology of different cellular insults. The exact reason for this difference when compared with other mitochondrial syndromes is not known. However, a speculation based on this imaging phenotype, which may reflect a different lesional mechanism/and degree of cellular injury compared with other mitochondrial disorders, should be considered, and factors including the specific characteristics of the cellular components along the selective structures frequently affected may have an important role on this. One of the common characteristics of mitochondrial disorders with restricted diffusion is direct involvement and deficiencies of cellular respiratory chain structural and functional components often resulting in areas of necrosis. Lesions in SLSMD frequently do not follow this pattern (cystic areas or areas of necrosis by imaging) but tend to be more homogeneous and without cavitations. It has been proposed that DWI restriction in patients with KSS could be related to postmortem findings of vacuolization in the neuritic processes finally leading to the postmortem finding of spongiform degeneration.23,24 It is possible that diffusion pseudorestriction (T2 shinethrough-ADC maps demonstrating persistent iso- or subtle hyperintense signal) could indeed reflect variable degree of progressive spongiform degeneration of the white matter following vacuolization without necessary association with large necrotic areas. Of course, this hypothesis should be supported by longitudinal quantitative analysis of diffusion imaging over time and postmortem pathologic correlations.
Selective involvement of midbrain structures and the tegmentum of the pons were shown to be a common feature in individuals with KSS, CPEO-plus, and PS→KSS, regardless of the timeframe in the disease (early versus late). Differences between the baseline and follow-up MRIs were more striking with an evaluation of white matter changes. The olivary bodies were curiously preserved in patients with SLSMDs even though olivary involvement can be seen in a variety of other mitochondrial or metabolic disorders. Again, the cause of this selective preservation is not clear and further investigation is recommended. Superficial white matter changes were noted to be either absent in a significant portion of patients with KSS on baseline MRI or only present concurrently with the brainstem changes. Interestingly, isolated supratentorial subcortical white matter changes without brainstem findings were not found. Thus, the distinct pattern of lesion distribution in the brainstem appears to be a landmark for the imaging diagnosis in the early stage of KSS, facilitating the earlier recognition of this disorder. White matter changes tend to become more evident upon clinical disease progression. Early white matter changes, when present, were selectively noted along the perirolandic region, with follow-up studies showing progressive extension in a centripetal fashion into the deeper white matter areas. Of note, the periventricular white matter was relatively spared in these subsets of patients, even in advanced stages. Understanding the unique pattern of lesion locations in SLSMDs provides insights into the underlying pathology of the disease, where we observe disease progression in KSS to follow an ascending trend of lesion distribution, starting from the brainstem region, particularly in the upper tegmentum of the brainstem and basal ganglia, before more extensively affecting the superficial white matter.
Spinal MRI lesions showed variable findings, including most frequently the involvement of the posterior columns of the cervical spine. These findings further underscore the importance of including spinal cord examinations as part of the imaging protocol of patients with mitochondrial disorder. Spinal cord involvement in KSS correlates with higher levels of disability, as previously reported.18,25
Comprehending the natural history of a disease is critical to facilitate early diagnosis and design clinical trials that evaluate therapeutic interventions on disease initiation and progression. However, studying the natural history of mitochondrial disorders is a complex task due to the numerous variables that can influence disease presentation and progression. These variables include the specific SLSMD site, size, heteroplasmy level,9 and multiple additional genetic and environmental factors affecting presentation that are difficult to control. Additionally, the same SLSMD may cause different disease phenotypes depending on the age and organ affected.1,9 This fact may partly explain the limitations of implementing effective drugs to treat mitochondrial disorders and the paucity of high-level scientific evidence in this field.26 To help mitigate these challenges, neuroimaging has emerged as a valuable noninvasive adjunctive tool to classify mitochondrial disorders objectively. Brain MRI can provide detailed information on lesion distribution, spatial extent, and degree of severity based on signal change by using standard and advanced sequences.16,27⇓–29 Furthermore, it can be used to exclude many other acute insults from different causes28 and aid in the assessment of disease progression.
Clinical implications of this study include the ability to facilitate early detection and diagnosis of SLSMDs, which can potentially lead to better management and ultimately improved outcomes for patients. Although this study is indeed a large imaging study of very rare disorders, a limitation is its retrospective nature. This prevented the performance or analysis of MR follow-up studies at standardized regular intervals throughout the disease course for all patients. Another limitation is the presence of ascertainment bias in our cohort because only patients with childhood disease onset were included. Additionally, medical devices including cochlear implants or pacemakers prevented acquisition of follow-up MR studies for some of our patients.
CONCLUSIONS
This study provides a detailed imaging analysis of SLSMDs, highlighting distinctive imaging features and a predictable imaging progression in patients with KSS, which are overall indistinguishable from individuals with CPEO-plus and individuals with PS→KSS.
Acknowledgment
The authors wish to thank Elizabeth Reynolds, PhD and The CHAMP Foundation Registry participants for support of this project. The Champ Foundation is a non-profit organization dedicated to supporting research to find treatment and a cure for SLSMDs. The Champ Foundation was founded in 2015 by Jeff and Elizabeth Reynolds.
Footnotes
Indicates article with online supplemental data.
Cesar A.P.F. Alves and Maria Camilla Rossi-Espagnet are co-first authors of this manuscript.
Amy Goldstein and Arastoo Vossough are co-last senior authors of this manuscript.
Disclosure forms provided by the authors are available with the full text and PDF of this article at www.ajnr.org.
References
- Received September 20, 2024.
- Accepted after revision December 11, 2024.
- © 2025 by American Journal of Neuroradiology


Jump to section
Related Articles
Cited By...
- No citing articles found.