
Abstract
BACKGROUND AND PURPOSE: The diagnostic performance of deep learning model that simultaneously detecting and quantifying nigrosome-1 abnormality by using susceptibility map-weighted imaging (SMwI) remains unexplored. This study aimed to develop and validate a deep learning-based automatic quantification for nigral hyperintensity and a classification algorithm for neurodegenerative parkinsonism.
MATERIALS AND METHODS: We retrospectively collected 450 participants (210 with idiopathic Parkinson disease [IPD] and 240 individuals in the control group) for training data between November 2022 and May 2023, and 237 participants (168 with IPD, 58 with essential tremor, and 11 with drug-induced parkinsonism) for validation data between July 2021 and January 2022. SMwI data were reconstructed from multiecho gradient echo. Diagnostic performance for diagnosing IPD was assessed by using deep learning–based automatic quantification (Heuron NI) and classification (Heuron IPD) models. Reference standard for IPD was based on N-3-fluoropropyl-2-β-carbomethoxy-3-β-(4-iodophenyl) nortropane PET finding. Additionally, the correlation between the Hoehn and Yahr (H&Y) stage and volume of nigral hyperintensity in patients with IPD was assessed.
RESULTS: Quantification of nigral hyperintensity by using Heuron NI showed an area under the curve (AUC) of 0.915 (95% CI, 0.872–0.947) and 0.928 (95% CI, 0.887–0.957) on the left and right, respectively. Classification of nigral hyperintensity abnormality by using Heuron IPD showed area under the curve of 0.967 (95% CI, 0.936–0.986) and 0.976 (95% CI, 0.948–0.992) on the left and right, respectively. H&Y score ≥3 showed smaller nigral hyperintensity volume (1.43 ± 1.19 mm3) compared with H&Y score 1–2.5 (1.98 ± 1.63 mm3; P = .008).
CONCLUSIONS: Our deep learning–based model proves rapid, accurate automatic quantification of nigral hyperintensity, facilitating IPD diagnosis, symptom severity prediction, and patient stratification for personalized therapy. Further study is warranted to validate the findings across various clinical settings.
ABBREVIATIONS:
- AUC
- area under the curve
- CNN
- convolutional neural network
- DIP
- drug-induced parkinsonism
- ET
- essential tremor
- H&Y
- Hoehn and Yahr
- ICV
- intracranial volume
- IPD
- idiopathic Parkinson disease
- 18F-FP-CIT
- N-3-fluoropropyl-2-β-carbomethoxy-3-β-(4-iodophenyl) nortropane
- SMwI
- susceptibility map–weighted imaging
- SN
- substantia nigra
- QSM
- quantitative susceptibility mapping
SUMMARY
PREVIOUS LITERATURE:
Loss of nigrosome-1 in IPD serves as an early diagnostic imaging biomarker. Although several deep learning models have been proposed for diagnosing IPD and segmenting the substantia nigra or nigrosome-1 region, these models have not simultaneously segmented nigrosome-1 and diagnosed IPD. Moreover, previous studies have demonstrated relatively low diagnostic performance and lacked external validation. Therefore, we propose a fully automated deep learning model by using susceptibility map–weighted imaging to identify and determine abnormalities in the nigrosome-1 region (Heuron IPD), along with quantifying volume of nigral hyperintensity (Heuron NI).
KEY FINDINGS:
Quantification of nigral hyperintensity by using Heuron NI showed an AUC of 0.915 and 0.928 on the left and right, respectively. Classification of nigral abnormalities by using Heuron IPD showed AUC of 0.967 and 0.976. H&Y score ≥3 showed significant smaller nigral hyperintensity volume (1.43 ± 1.19 mm3) compared with H&Y score 1–2.5 (1.98 ± 1.63 mm3; P = .008).
KNOWLEDGE ADVANCEMENT:
Our deep learning–based model enables rapid and accurate automated quantification and classification of nigral hyperintensity, facilitating the diagnosis of IPD and predicting symptom severity.
Idiopathic Parkinson’s disease (IPD) is a chronic and progressive neurodegenerative disease causing parkinsonian symptoms, including tremors, bradykinesia, rigidity, and postural instability.1 The principal pathophysiologic change associated with this disease is dopaminergic neuron degeneration in the substantia nigra (SN) pars compacta.2 The nigrosome-1 is located in the dorsolateral portion of the SN. It is the initial site of dopaminergic neuron degeneration as the disease progresses.3 The nigrosome-1 typically contains high neuromelanin and low iron concentrations. Therefore, this region usually identified by the hyperintense area at the dorsolateral aspect of the SN on susceptibility-weighted imaging (SWI), also known as the “swallow tail sign.”4
Hyperintensity loss in nigrosome-1 occurs in IPD,5⇓-7 serving as an early imaging biomarker of IPD.8 A recent meta-analysis demonstrated that detecting loss of nigrosome-1 yields excellent diagnostic accuracy, with pooled sensitivity and specificity of 0.96 and 0.95, respectively.9 However, visualizing nigrosome-1 varies subjectively across imaging sequences, including T2*-weighted imaging, SWI, and quantitative susceptibility mapping (QSM).10 Among these imaging sequences, susceptibility map–weighted imaging (SMwI), which is similar to SWI but generated by combining the gradient echo magnitude image and a QSM-derived quantitative susceptibility mask, enhances susceptibility contrast of nigrosome-1.11⇓⇓-14 Enhanced contrast in nigrosome-1 allows for better visualization of nigral hyperintensity structural information and improves diagnostic performance.
Recently, many deep learning models have been proposed for neurodegenerative diseases.15⇓-17 In the case of IPD, deep learning models have been developed not only for diagnosis but also for segmenting the SN and nigrosome-1 regions. Chen et al18 developed a hybrid model for predicting early-stage IPD that combines deep learning features and radiomics features, using YOLO-v5 for initial brainstem detection and integrating both features for enhanced predictive accuracy. Shin et al19 used a convolutional neural network (CNN)-based diagnostic algorithm on SMwI, exhibiting comparable performance to that of an experienced neuroradiologist. Ariz et al20 introduced an automatic segmentation model utilizing a 3D atlas-based pipeline on SWI, revealing that relative neuromelanin and iron quantification improved diagnostic performance. Wang et al21 used a CNN architecture on true SWI, demonstrating its capability to detect nigrosome-1 abnormalities and localize them. However, these deep learning models have not been used to segment nigrosome-1 and diagnose Parkinson disease at the same time. Also, previous studies have demonstrated relatively low diagnostic performance for nigrosome-1 (area under the curve [AUC], 0.87–0.95), and no external validation was conducted except the model by Shin et al,19 whose data we incorporated into our training data set. To our knowledge, the diagnostic performance of a fully automated deep learning–based model for simultaneously detecting and quantifying nigrosome-1 abnormality by using SMwI and its external validation remains unexplored. Therefore, we propose a fully automated deep learning model by using SMwI to identify and determine abnormalities in the nigrosome-1 region, along with quantifying volume of nigral hyperintensity. This study aimed to develop and validate a deep learning–based automatic quantification for nigral hyperintensity and a classification algorithm for neurodegenerative parkinsonism by using SMwI.
MATERIALS AND METHODS
This study follows the guidelines of Checklist for Artificial Intelligence in Medical Imaging22 (Supplemental Data). For data privacy, data were anonymized before entering the model, and the data entered were not used elsewhere.
Participants
Patients with parkinsonism symptoms who underwent brain MRI, including SMwI, as well as N-3-fluoropropyl-2-β-carbomethoxy-3-β-(4-iodophenyl) nortropane (18F-FP-CIT) PET imaging were included in the training and external validation data sets.
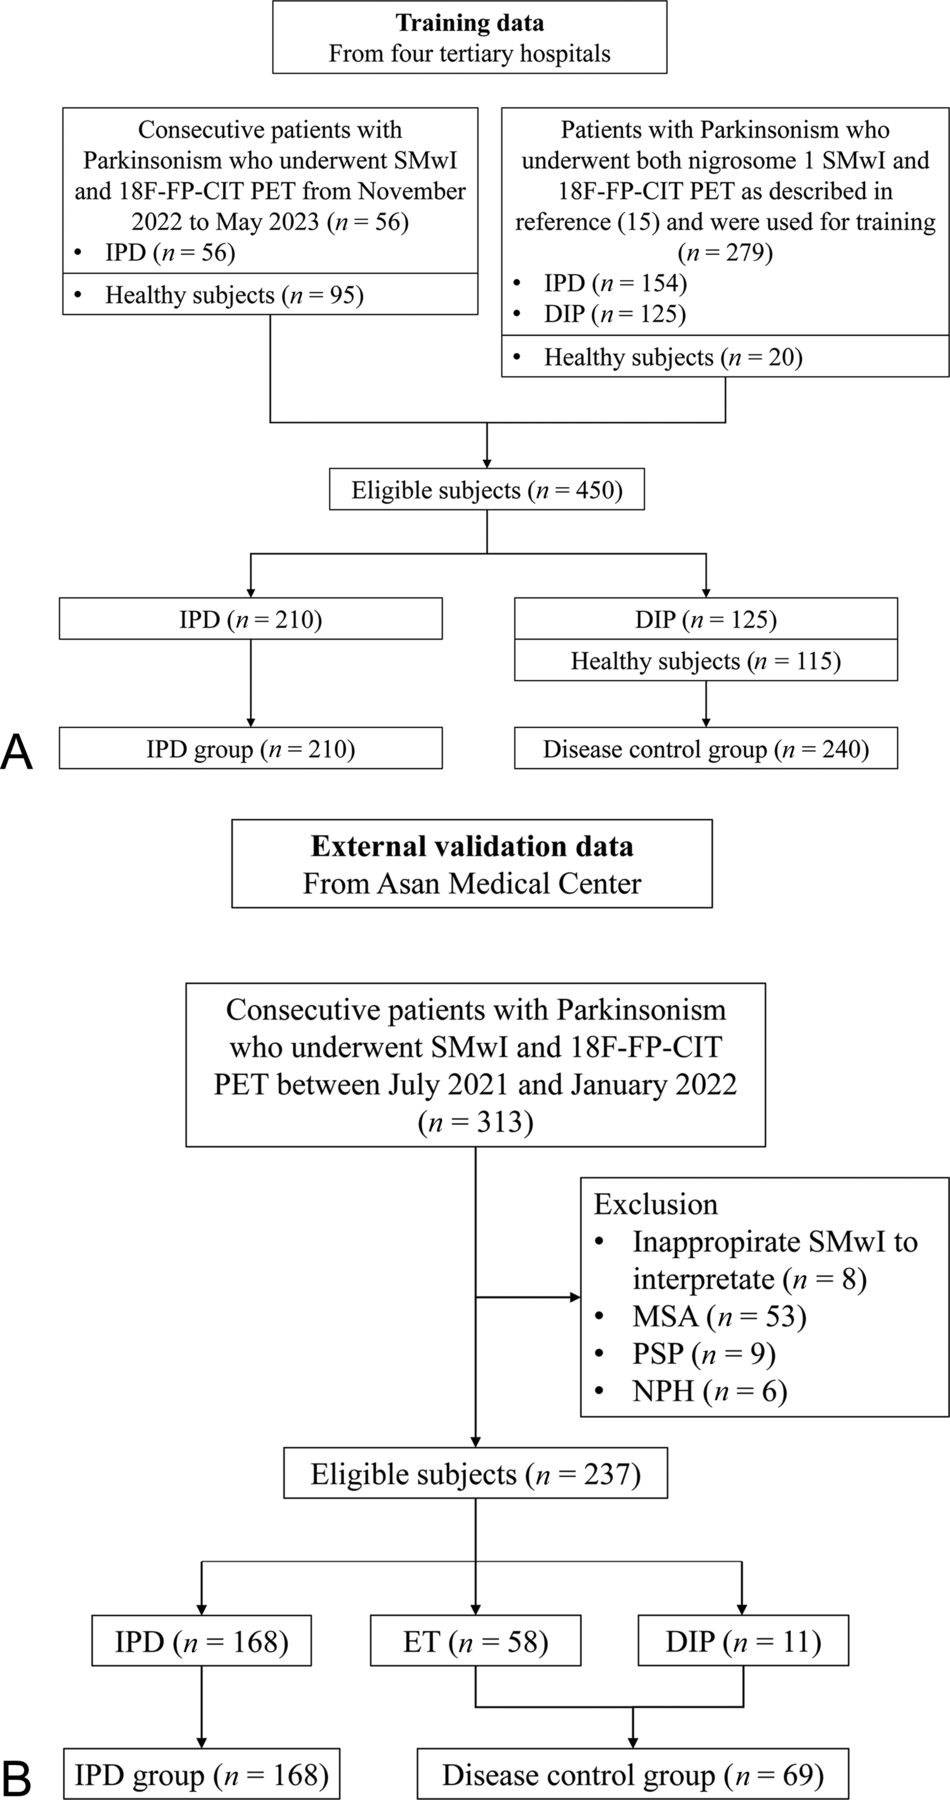
The training data comprised: 1) 151 subjects (56 patients with IPD and 95 healthy subjects in the control group) collected prospectively from 3 hospitals between November 2022 and May 2023, and 2) 299 subjects (154 patients with IPD, as well as a control group consisting of 125 patients with drug-induced parkinsonism [DIP] and 20 healthy subjects) from the training data set of the previous study by Shin et al.19 Overall, 450 participants (210 with IPD and 240 individuals in the control group) from 4 hospitals were used for training the detection and segmentation models.
For external validation, data were retrospectively collected from 1 hospital between July 2021 and January 2022. We excluded healthy subjects from the validation process and included only individuals with symptoms of parkinsonism, which is crucial for differential diagnosis in identifying IPD. Of 313 patients presenting with symptoms of parkinsonism and suspected IPD at clinics, 8 were excluded due to inappropriate SMwI to interpret due to image quality, artifact, and scan range. Patients with multiple system atrophy (n = 53), progressive supranuclear palsy (n = 9), and normal pressure hydrocephalus (n = 6) were also excluded. We enrolled 168 patients with IPD as a disease group with abnormality on PET imaging. As a disease control group, we enrolled 69 patients with DIP or essential tremor (ET) who had normal PET imaging. Figure 1 shows the flow charts detailing training and external validation data set collection.

Flowcharts illustrating patient selection for (A) training and (B) validation data.
MR Imaging Protocol
Oblique coronal imaging was employed owing to the location of the nigrosome-1 region below the inferior pole of the red nucleus.23 All participants underwent MR imaging on a 3T MRI scanner with a 32-channel coil (Ingenia CX and Ingenia Elition X, Philips Medical Systems; Skyra, Siemens Healthineers). The imaging parameters of the 3T scanners are presented in the Supplemental Data.
SMwI Data Reconstruction and Reslicing
To visualize the nigrosome-1 region, a special sequence and image processing technique was used, called SMwI, derived from QSM.24 This approach enhances the swallow-tail sign visualization in the SN region by amplifying the susceptibility contrast resulting from iron.25 Images were acquired by using a 3D gradient echo 3-echo sequence. QSM, generated by using the iterative least-square method, was further processed to create a QSM mask for susceptibility contrast weighting, based on a paramagnetic threshold value.24,26 The threshold was determined for an optimal contrast-to-noise ratio. The mask was generated by calculating the quantitative susceptibility values of QSM by using an equation that utilizes this threshold. SMwI was subsequently created by multiplying the multiecho combined magnitude images with the QSM mask. The reconstructed SMwI data were resliced in 0.5 mm increments by using the Antspy open-source medical imaging library (Version 0.3.8, https://antspy.readthedocs.io/).
Development of Deep Learning–Based Automatic Quantification for Nigral Hyperintensity
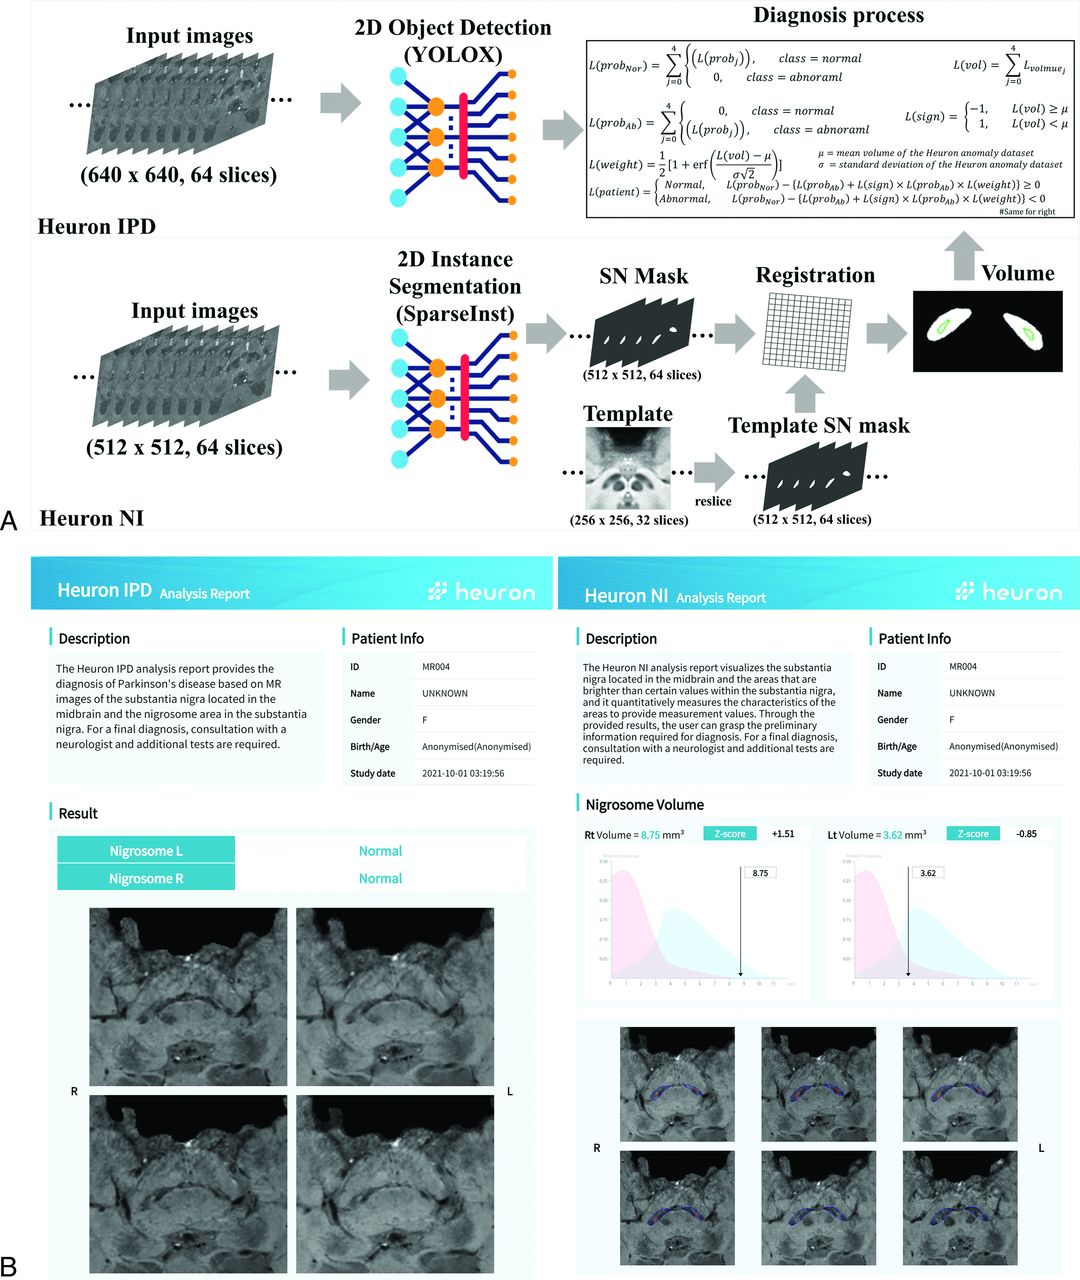
For SN segmentation and nigral hyperintensity quantification, we used Heuron NI (Version 1.0.0.19, Heuron), which was commercially launched in the Republic of Korea in June 2021. This system is designed as a nigral hyperintensity segmentation model to evaluate quantitative information. It utilizes SMwI data as input and provides the measured volume of nigral hyperintensity as output (Fig 2).

Automatic nigrostriatal degeneration classification and nigral hyperintensity volume measurement by using deep learning models. A, Classification progress of nigrostriatal degeneration and measurement of nigral hyperintensity volume. B, Output from the Heuron IPD and Heuron NI systems. Heuron IPD shows the analysis results for nigrostriatal degeneration, while Heuron NI depicts nigral hyperintensity volume measurement results. The classification of the Heuron data set graph is depicted in normal (blue) and abnormal (red) categories.
Initially, the input images underwent preprocessing, consisting of reslicing and resizing to produce 64 slices of 512 × 512 2D SMwI. These preprocessed images were then used as input for the 2D instance segmentation model, SparseInst,27 to segment the SN region. We used SN mask-based image registration for nigral hyperintensity quantification. The SN segmentation model generates predicted SN mask information for each slice and binarizes it by excluding background or extraneous data from the image to extract the hyperintensity region. In this process, input and target data for registration were generated. Input data were defined by binarized SN mask. Target data were defined by the SMwI template8 SN mask. An experienced neurologist delineated the SN and nigral hyperintensity in the SMwI template and annotated hyperintensity region as processed nigrosome-1. After registering the input data (binarized SN mask) and the target data (template SN mask), the overlapping area between the hyperintensity region in the binarized SN mask and processed nigrosome-1 region in the template SN mask was designated as nigrosome-1. To account for interindividual variation, normalization was conducted by using the intracranial volume (ICV), calculated by using SynthSeg.28 The details of development and progress of our deep learning model is demonstrated in the Supplemental Data.
Development of Deep Learning–Based Automatic Classification for Nigral Hyperintensity
Heuron IPD, a deep learning-based system (Version 1.0.1.10, Heuron), has been commercially available in Korea since April 2021. This system is designed to detect nigrostriatal degeneration and includes a CNN-based model for object detection and segmentation model, integrating outputs of each model to classify nigrostriatal degeneration (Fig 2).
Initially, the input images underwent preprocessing to produce 64 slices of 640 × 640 2D SMwI. Heuron IPD first performed object detection by using the YOLOX model,29 utilizing the preprocessed images to predict the nigrosome-1 region and classify abnormalities. The model was trained on a data set annotated with nigrosome-1 location by an experienced neurologist, with 18F-FP-CIT PET imaging serving as the ground truth for the presence of nigrostriatal degeneration.
For the classification of nigrostriatal degeneration, 5 slices from the scanned MR images containing SN and nigral hyperintensity structures were utilized for analysis.19,25 The object detection model returned a probability value indicating the likelihood of a specific object based on its training. The quantification information of nigral hyperintensity volume, measured by Heuron NI, informed the object detection model and acted as a weight for the class probability value. These weighted class probability values were employed to determine the abnormalities in the nigral hyperintensity region. The details of development and progress of our deep learning model is demonstrated in the Supplemental Data. The diagnostic performance of Heuron IPD was evaluated and compared with the model by using only the CNN, without volume weight, to determine the effectiveness of volume weighting.
Evaluation of Diagnostic Performance
18F-FP-CIT PET (Biograph TruePoint; Siemens) was performed in all subjects and served as the reference standard to determine whether the patient had IPD, with findings assessed by experienced nuclear medicine physicians. The performance of both Heuron IPD and Heuron NI was evaluated per SN and participants. The performance of Heuron IPD was assessed by classifying IPD based on the reference standard. Although Heuron NI was used to quantify the nigral hyperintensity and provide volume measurement for the left and right sides, its diagnostic performance for diagnosing IPD was also evaluated by using the cutoff value as a threshold. The cutoff value was calculated based on the highest AUC from the ROC curve of the volume and reference standard. For the per participant analysis, a participant was considered to exhibit an abnormality if abnormalities were on either side of the SN.
Statistical Analysis
Determining diagnostic accuracy involved calculating several metrics, including AUC, sensitivity, specificity, F1-score, and accuracy for each result set. Furthermore, 95% CIs were determined by using Clopper-Pearson intervals. Correlations with Hoehn and Yahr (H&Y) Scale were analyzed by using Kruskal-Wallis, Mann-Whitney U, and Hanley and McNeil tests. P < .05 was considered statistically significant. All statistical analyses were conducted by using MedCalc Version 22.007 (MedCalc Software).
RESULTS
Participant Enrollment
Overall, 237 participants were enrolled for external validation of the performance of the model. The external validation data included 168 patients with IPD, as well as a control group consisting of 58 with essential tremor and 11 with DIP. Demographics of external validation data are shown in the Table and training data in the Supplemental Data.
Demographic findings and clinical characteristics of external validation data
Diagnostic Performance of Heuron NI and Heuron IPD per SN and Participant
The diagnostic performance of Heuron NI was assessed by comparing the volume measured through Heuron NI and the reference standard for all participants by using the AUC. The AUCs were 0.915 (95% CI, 0.872–0.947) and 0.928 (95% CI, 0.887–0.957) on the left and right, respectively (Fig 3). No significant difference in diagnostic performance was observed between the left (sensitivity 87.8%, specificity 83.6%) and right (sensitivity 89.2%, specificity 85.9%) directions (P = .65). The diagnostic performance per participant exhibited 96.4% sensitivity, 73.9% specificity, and 93.1% F1-score. The same analysis was repeated by dividing the measured volume by the ICV (Supplemental Data), yielding nearly identical diagnostic performance as before dividing the volume by ICV.

ROC curves for each nigrosome volume and Heuron IPD for PET visual assessment. ROC curves for the volume of nigrosome and PET for the right (A) and left (B) SN. ROC curves for the classification results of Heuron IPD and PET for the right (C) and left (D) SN.
When using only the CNN model in Heuron IPD without incorporating volume weight from quantification information, the AUC was 0.942 (95% CI 0.904–0.968) and 0.933 (95% CI 0.893–0.961) on the left on right, respectively (Supplemental Data). Using Heuron IPD, applying weighted class probability values from quantification information, the AUC increased to 0.967 (95% CI, 0.936–0.986) and 0.976 (95% CI, 0.948–0.992) on the left and right, respectively (Fig 3). Consistent with the volume-reference standard analysis, no significant difference was observed in the diagnostic performance between the left (sensitivity 95.1%, specificity 95.9%) and right (sensitivity 94.6%, specificity 95.8%) directions (P = .60). The per-participant diagnostic performance was as follows: sensitivity 97.0%, specificity 95.7%, and F1-score 97.6% (Supplemental Data). The representative cases of Heuron NI and Heuron IPD for both normal and IPD patient are shown in Fig 4 and Fig 5, respectively.

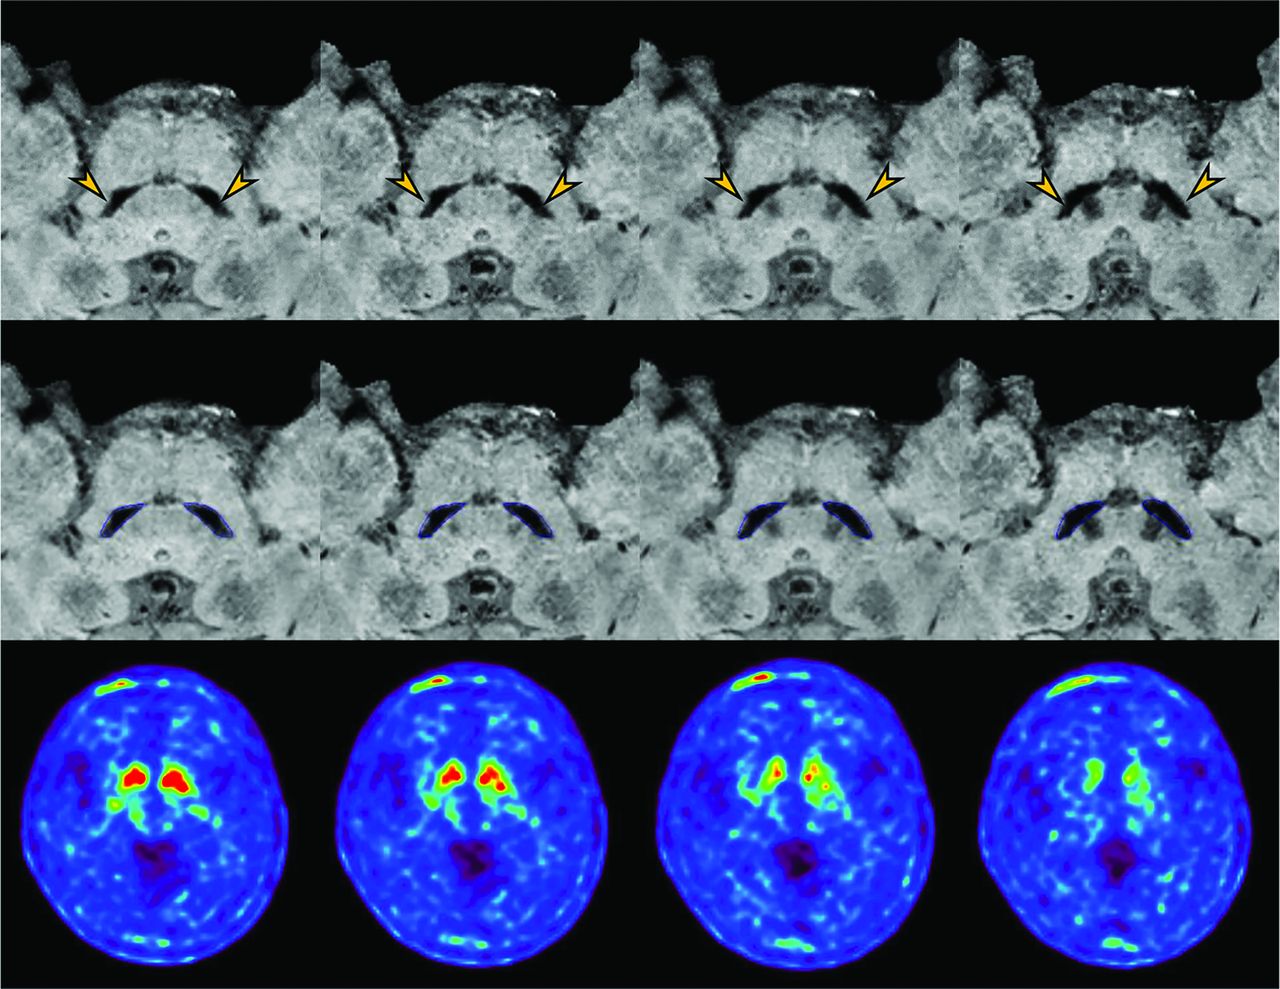
A 69-year-old female patient with essential tremor, showing nigral hyperintensity within the substantia nigra (arrow). The analysis results (middle row) display the segmentation of the substantia nigra (blue) and nigral hyperintensity (red). The nigral hyperintensity volume is 10.13 mm3 on the left and 9 mm3 on the right.18F-FP-CIT imaging (lower row) shows normal dopamine transporter binding in the bilateral basal ganglia.

A 63-year-old female patient with idiopathic Parkinson disease was found to have abnormal nigrosome-1 regions (arrow) on both sides. The analysis results (middle row) display the segmentation of the substantia nigra (blue) and nigral hyperintensity (red). The nigral hyperintensity volume is 0 mm3 on the left and 0.13 mm3 on the right. 18F-FP-CIT imaging (lower row) shows decreased dopamine transporter binding in the bilateral basal ganglia.
Heuron IPD also demonstrated significant performance in differentiating IPD from ET (AUC, 0.965–0.980) and DIP (AUC, 0.959–0.968) (Online Supplemental Data). Additionally, there was no significant performance difference by patient sex (Supplemental Data).
Diagnostic Performance of Heuron IPD across H&Y Score Groups
We compared diagnostic performance in different groups of H&Y score in patients with IPD. H&Y scores were categorized into 2 distinct groups. Group 1 comprised 4 categories: 1 (1–1.5), 2 (2–2.5), 3 (3–3.5), and 4 (4–5), while group 2 consisted of 2 categories: 1 (1–2.5) and 2 (3–5). Both group 1 and 2 showed higher AUC in lower H&Y stage group. The AUC was 1.000 in H&Y score 1 to 1.5 in group 1, and 0.957 in H&Y score 1 to 2.5 in group 2 (Supplemental Data). However, the diagnostic performance within each group revealed no significant statistical difference (group 1: category 1 versus category 2, P = .11; category 1 versus category 3, P = .29; category 2 versus category 3, P = .61; group 2: category 1 versus category 2, P = .55).
Volume-H&Y Score Correlation Using Heuron NI
We assessed the correlation between the H&Y stage and volume in patients with IPD. We evaluated the relationship between the quantitative information of the nigral hyperintensity volume measured by Heuron NI and disease progression. In the analysis (Supplemental Data), group 1 showed no statistical correlation between H&Y stages and volume (P = .06). However, group 2 exhibited a significant correlation (P = .008). This pattern remained consistent even after adjusting the volume for ICV (group 1, P = .07; group 2, P = .01).
DISCUSSION
We developed and validated a deep learning–based model for the automatic quantification of nigral hyperintensity (Heuron NI) and diagnosis of IPD (Heuron IPD). Both Heuron IPD and Heuron NI demonstrated successful diagnosis of IPD in patients with clinical suspicion of parkinsonism, achieving an AUC of 0.915–0.976 per SN and accuracy of 89.9%–96.6% per patient. Quantifying nigral hyperintensity, H&Y stage 3–5 showed significantly lower nigral hyperintensity volume compared with H&Y stage 1–2.5, suggesting more severe motor symptoms.
Nigrosome-1 is affected in early-stage IPD, and its loss serves as an imaging biomarker for early IPD diagnosis.8,30,31 Previous studies predominantly used manual drawing of ROI for nigrosome-1 and performed voxelwise or quantitative analyses.8,30,32 Ariz et al20 recently introduced the first fully automated segmentation model for quantifying nigrosome-1. Their segmentation model relied on a 3D atlas-based pipeline,33 generating 2 atlases from neuromelanin MRI and SWI. However, their model requires atlas reconstruction and it is difficult to utilize SMwI. Creating an atlas from SMwI poses challenges owing to inconsistent imaging slabs. Consequently, our model initially segmented the SN and created an SN mask from the input images, then it quantified nigral hyperintensity within the segmented SN area by using the SMwI template. Shin et al19 introduced an automated nigrosome-1 identification method, but it did not provide quantification. Our model had advancements in simultaneously detecting and quantifying nigrosome-1 abnormality. In addition, our approach differs from previous studies because we evaluated diagnostic performance in patients with clinical suspicion of parkinsonism rather than comparing it with a normal control group. Our model exhibited an AUC ranging from 0.915–0.928 for diagnosing IPD based on nigral hyperintensity volume, suggesting significant diagnostic utility in clinical practice. However, a small number of false-positives and false-negatives could lead to misinterpretation. Therefore, deep learning models should play a supportive role and be used in conjunction with comprehensive clinical and radiologic evaluations when diagnosing IPD.
Loss of nigral hyperintensity, resulting from dopaminergic cell degeneration and iron deposition,34,35 suggests a potential association between nigrosome-1 and IPD symptom severity. A negative correlation has been observed between the Unified Parkinson’s Disease Rating Scale (UPDRS) Part III score and signal-to-noise ratio of neuromelanin in the posterolateral SN36 or nigrosome-1 volume.37 Hence, we evaluated the correlation between nigral hyperintensity volume and H&Y stage, revealing that the H&Y stage 1–2.5 group showed significantly higher nigral hyperintensity volume than the H&Y stage 3–5 group. In advanced-stage IPD, characterized by an H&Y stage of ≥3, patients typically exhibit a lower quality of life,38 an increased risk of medication-refractory disease progression,39 and a shorter overall survival time.40 Therefore, accurately quantifying nigral hyperintensity holds clinical value in assessing patient outcomes. Furthermore, automated quantification can possibly be utilized as an imaging biomarker for monitoring the efficacy of disease-modifying drugs, and further studies are warranted.
We developed a model (Heuron IPD) by using a deep learning–based algorithm called YOLOX for classifying nigral hyperintensity, as normal or abnormal. The YOLOX model has been improved with a decoupled-head approach, optimizing layer arrangement to enhance classification and localization.19 Moreover, YOLOX uses an anchor-free design facilitated by the multipositive approach, enhancing its flexibility and performance through structural modifications. This modification eliminates the need for heuristic tuning associated with anchor optimization while concurrently diminishing computational requirements. Consequently, our model (AUC, 0.967–0.976, per SN) outperformed the diagnostic performance of the previous model based on YOLOv3 (AUC, 0.921–0.937) and even visual interpretation by a neuroradiologist (AUC, 0.937–0.945).19 It also showed higher performance than other pre-existing deep learning models such as Pvtv241 and Detectors42 (Supplemental Data). Our study demonstrated the advancement of the YOLO series and its practical utility in clinical practice. Additionally, Heuron IPD showed enhanced diagnostic performance after volume-weighting application to the class probability value. In patients with IPD, the volume of the nigral hyperintensity is notably small or even absent. Therefore, comprehensively analyzing SN and nigral hyperintensity volume is essential for improving diagnostic accuracy.
This study has some limitations. First, we opted for 18F-FP-CIT PET imaging as the reference standard for diagnosing IPD. Consequently, atypical parkinsonism, including multiple system atrophy and progressive supranuclear palsy, which can also exhibit decreased dopamine transporter binding similar to IPD, were excluded. Therefore, when interpreting the quantification and classification of nigral hyperintensity in a clinical context by using our model, caution is advised, and a comprehensive assessment of other clinical features is essential. Second, we assessed nigral hyperintensity, which was considered as nigrosome-1 region. However, these hyperintensity areas were not pathologically confirmed and may not be definitely correlated with nigrosome-1. Third, we did not evaluate the use of SWI or neuromelanin imaging as input for our model. There is also a limitation in by using SMwI reconstructed from QSM, because it is not yet a widely generalized method. However, SMwI is probably more suitable for diagnosing IPD due to its higher signal-to-noise ratio and contrast-to-noise ratio compared with SWI, and its more distinct margins than neuromelanin imaging.7,14 Last, this is a retrospective study and external validation was limited to data from a single hospital, which may not represent demographic diversity. Furthermore, the use of a limited number of MRI scanners—Ingenia CX, Ingenia Elition X, and Skyra—along with the need for high-resolution images to visualize the swallow-tail sign may limit the generalizability of our model, necessitating a real-world validation study.
CONCLUSIONS
Our deep learning–based model proves valuable for rapid and accurate automatic quantification of nigral hyperintensity, facilitating IPD diagnosis and symptom severity prediction.
Footnotes
Pae Sun Suh and Hwan Heo contributed equally to this article.
This work was supported by the National Research Foundation of Korea (NRF-2021R1C1C1014413) and a grant of the Korea Health Technology R&D Project through the Korea Health Industry Development Institute (KHIDI), funded by the Ministry of Health & Welfare, Republic of Korea (grant number: RS-2023-00266948).
Disclosure forms provided by the authors are available with the full text and PDF of this article at www.ajnr.org.
References
- Received April 4, 2024.
- Accepted after revision October 30, 2024.
- © 2025 by American Journal of Neuroradiology


Jump to section
Related Articles
Cited By...
- No citing articles found.