
Abstract
BACKGROUND AND PURPOSE: The amount and distribution of cerebral microbleeds (CMB) are important risk factors for cognitive impairment. Our objective was to train and validate a deep learning (DL)-based segmentation model for cerebral microbleeds (CMBs) on SWI and to find associations among CMB, cognitive impairment, and vascular risk factors.
MATERIALS AND METHODS: Participants in this single-institution retrospective study underwent brain MRI to evaluate cognitive impairment between January and September 2023. For training the DL model, the nnU-Net framework was used without modifications. The performance of the DL model was evaluated on independent internal and external validation data sets. Linear regression analysis was used to find associations among log-transformed CMB numbers, cognitive function (Mini-Mental Status Examination [MMSE]), white matter hyperintensity (WMH) burden, and clinical vascular risk factors (age, sex, hypertension, diabetes, lipid profiles, and body mass index).
RESULTS: Training of the DL model (n = 287) resulted in a robust segmentation performance with an average Dice score of 0.73 (95% CI, 0.67–0.79) in an internal validation set (n = 67) and modest performance in an external validation set (Dice score = 0.46; 95% CI, 0.33–0.59; n = 68). In a temporally independent clinical data set (n = 448), older age, hypertension, and WMH burden were significantly associated with CMB numbers in all distributions (total, lobar, deep, and cerebellar; all P < . 01). The MMSE was significantly associated with hyperlipidemia (β = 1.88; 95% CI, 0.96–2.81; P < . 001), WMH burden (β = −0.17 per 1% WMH burden, 95% CI, −0.27–0.08; P < . 001), and total CMB number (β = −0.01 per 1 CMB, 95% CI, −0.02–0.001; P = .04) after adjusting for age and sex.
CONCLUSIONS: The DL model showed a robust segmentation performance for CMB. In all distributions, CMB had significant positive associations with WMH burden. Increased WMH burden and CMB numbers were associated with decreased cognitive function.
ABBREVIATIONS:
- CMB
- cerebral microbleed
- DL
- deep learning
- DSC
- Dice similarity coefficient
- HDL
- high-density lipoprotein
- LDL
- low-density lipoprotein
- MMSE
- Mini-Mental Status Examination
- nnU-Net
- no-new-Net
- SVD
- small-vessel disease
- WMH
- white matter hyperintensity
SUMMARY
PREVIOUS LITERATURE:
Previous studies have focused on the segmentation of CMB by the DL model, but no studies have investigated the association between automated CMB segmentations and clinical variables.
KEY FINDINGS:
The DL model demonstrated robust segmentation performance with an average DSC of 0.73 in the internal validation set. WMH burden had a significant association with the CMB number in all distributions. The MMSE had a significant negative association with WMH burden and total CMB number after adjusting for age and sex.
KNOWLEDGE ADVANCEMENT:
These findings highlight the potential of automated CMB segmentation using DL models to further understand its clinical implications.
Cerebral microbleeds (CMBs) are small areas of microhemorrhages visible as dark signal intensity on SWI or T2* gradient-echo sequences of brain MRI. Typically ranging from 5 to 10 mm, they are regarded as silent indicators preceding potential future intracranial hemorrhages.1 CMB is characterized by localized clusters of macrophages containing paramagnetic hemosiderin,2 leading to signal attenuation on SWI or T2* gradient-echo sequences owing to susceptibility effects. SWI is the preferred sequence for detecting CMBs (over T2* gradient-echo sequences) due to its higher detection rate.3 It has become increasingly available for brain MRI, leading to increased incidental detection of CMBs, with a true-positive detection rate of 48%–89%.1
CMB is a common imaging finding in patients with small-vessel diseases (SVDs), with up to 36% of adults 80–90 years of age demonstrating evidence of CMBs.4 Because CMB is an imaging marker of SVD, we hypothesized that the degree of CMB may be associated with an established vascular risk factor such as obesity, hypertension, diabetes, and hyperlipidemia.1,5⇓⇓-8 These risk factors are also associated with the development of Alzheimer dementia,9 and CMB may, therefore, be associated with both. A previous study demonstrated that cognitive impairment reflected in low Mini-Mental Status Examination (MMSE) scores is associated with an increased number of CMBs.10 Moreover, cerebral white matter hyperintensity (WMH)—a common imaging finding in the elderly—has a significant positive association with CMB.5
Accurate quantification of CMB is needed to examine the relationship between CMBs and clinical factors. In many previous studies, CMB was quantified through visual assessment.1,5,6,10,11 However, common imaging findings that mimic CMB included dilated cortical veins, iron accumulation in the basal ganglia, and calcifications.12 Previous studies have reported a wide range of interrater reliability for CMB quantification with κ values of 0.33–0.88.13 Moreover, manual counting of CMBs is laborious and may be superseded by automated deep learning (DL)-based CMB quantification.
The recent advancement of DL-based models has shown great promise in various medical image-segmentation challenges.14 Particularly, no-new-Net (nnU-Net), a self-configuring DL-based framework, has been found to outperform most other DL-based models in various segmentation tasks.15 Unlike the excellent segmentation performances in glioblastoma16 or intracranial hemorrhage,17 relatively few segmentation tasks have been studied in CMBs.12,18
However, the simultaneous automated quantification of CMBs and validation of their clinical significance is not well-established in the literature. Therefore, this study aimed to evaluate the performance of a DL-based segmentation model in quantifying CMB on SWI and to investigate the relationship among the CMB amount, various vascular risk factors, WMH burden, and cognitive function in participants suspected of being in cognitive decline.
MATERIALS AND METHODS
The institutional review board of Asan Medical Center approved this single-center retrospective cohort study with a waiver of informed consent forms (IRB No. S2023-1027–0001). This study adhered to the methodology proposed in the CLAIM checklist (https://pubs.rsna.org/page/ai/claim) (Supplemental Data).
Study Participants
The participants were patients who were clinically suspected of being cognitively impaired and who had undergone a brain MRI between January and August 2023 at our tertiary referral hospital. The brain MRIs of these participants were used for training and validating a DL-based segmentation model. Those with CMBs were randomly divided into a 7:3 ratio, with 30% of the participants allocated to the internal validation data set and the remaining 70%, along with the CMB absent group, allocated to the training data set. Participants assessed between April and August 2023 were included for clinical analysis. The inclusion criteria were the following: older than 18 years of age and an available brain MRI with SWI and filtered phase images. Baseline clinical information, including diabetes, hypertension, hyperlipidemia, lipid profiles (total cholesterol, triglyceride, and high- and low-density lipoproteins), and body mass index, was retrieved from the electronic medical record, and MMSE-based cognitive scores were collected. The MMSE had multiple components, including temporospatial orientation, memory registration, attention and calculation, memory recall, language, and space-time configuration. The maximum score was 30. Participants were excluded if any of the clinical information (ie, diabetes, hypertension, total cholesterol level, MMSE scores) was missing within 1 year of the MRI scan (Fig 1).

A flow chart for selecting eligible study participants.
Moreover, an independent external validation data set was collected for the performance evaluation of the DL segmentation model. The eligibility criteria for the external validation data set were the following: adult participants who had undergone a brain MRI with available SWI and filtered phase images from outside hospitals during January to December 2023 and had visited our tertiary referral hospital. The selection process for eligible participants is depicted in Fig 1.
MR Acquisition Parameters
All MRIs were acquired using a 3T scanner (Ingenia CX; Philips Healthcare) with a 32-channel head coil. The dedicated brain MRI protocol included a 3D 1-mm isovoxel T1-weighted sequence (TR/TE/TI [ms], 6.3/2.9/0), 2D axial FLAIR images (9000/95/2500), T2-weighted images (3000/80/0), and SWI/filtered phase images, which were postprocessed from multiecho gradient images (31/19.6; 4 echoes, with echo spacing of 6.2 ms) according to the standard settings of the scanner (Supplemental Data).
MRI Preprocessing and Manual CMB Segmentation Labeling
Initially, SWI and the filtered phase images were stored in DICOM formats, which were converted into NIfTI file formats.19 The images then underwent DL-based automated brain extraction using HD-BET (https://biogrids.org/software/titles/hdbet).20 Subsequently, all images underwent N4 bias field correction for intensity normalization.21 For ground truth segmentation masks, all visible CMBs on SWI and phase images were manually segmented by a neuroradiologist (J.S.K. with 5 years of experience in diagnostic neuroradiology) using 3D Slicer (Version 5.6.1; http://www.slicer.org). A supervising neuroradiologist then reviewed the segmentations and made modifications when necessary (Y.C. with 10 years of experience in diagnostic neuroradiology). Finally, a pretrained DL-based model was used for whole-brain segmentation (SynthSeg; https://github.com/BBillot/SynthSeg).22 Briefly, SynthSeg is a whole-brain segmentation tool that is robust against a wide range of contrasts and resolutions, thus providing SWI-based reliable anatomic maps. Because SynthSeg outputs were generated from native SWI, coregistration or transformation of the images was not performed. The segmentation outputs included cerebral white matter, the hippocampus, amygdala, cerebellum, brainstem, thalamus, caudate, putamen, pallidum, and nucleus accumbens.
Training and Inference of the DL Segmentation Model
The DL segmentation model was trained solely on the basis of nnU-Net without any modification.15 The nnU-Net architecture provides self-configured preprocessing steps, including automatic cropping of the image peripheries, resampling to resolutions equal to the ground truth segmentation masks, and z-transform normalization. The 2-channel 3D input images were SWI and filtered phase images. For each training incident, the data set was randomly divided into 5 folds for cross-validation, with each fold completing 1000 epochs of training. The best-performing model with the highest average Dice similarity coefficient (DSC) values in the validation set was chosen.
The CMB outputs were coregistered with corresponding SynthSeg-generated brain MRI outputs. The CMBs were then categorized on the basis of their location: 1) lobar: cerebral white matter and cortex; 2) deep (brainstem, thalamus, caudate, putamen, pallidum, and nucleus accumbens); and 3) cerebellar. Figure 2 shows the summarized workflow for image preprocessing and training a DL segmentation model. The codes used for preprocessing and model inference are provided on a GitHub page (https://github.com/olnsnlyy/CMB_segment).

Schematic workflow of image-preprocessing and CMB segmentation output inference.
Automated WMH Burden Quantification
WMH, visible on 2D axial FLAIR images, was automatically quantified via commercial software (LesionQuant module of the NeuroQuant; CorTechs Labs). The 2D FLAIR images of all participants were spatially aligned and reconstructed on the basis of 3D T1-weighted images. The WMH burden was calculated as WMH volumes divided by the total intracranial volumes. Both radiologists reviewed all WMH segmentations without making any further modifications.
Statistical Analysis
Continuous variables between participants according to CMB presence were compared using a 2-sided independent t test. Categoric variables were compared using a Pearson χ2 test. DSC was used to evaluate the performance of the CMB segmentation model in independent internal and external validation data sets. DSC measures the volumetric overlap between the predicted and ground truth CMB contours.23 Moreover, the sensitivity, specificity, and accuracy of the CMB prediction in an external validation data set were calculated and compared with the ground truth by the radiologist. Linear regression analysis was performed to find associations between clinical variables and log-transformed CMB numbers. Post hoc subgroup linear regression analyses were performed to find associations between log-transformed CMB numbers by their distribution (ie, deep, lobar, and cerebellar) and clinical variables. Additionally, linear regression investigated the association among clinical variables, WMH burden, log-transformed CMB numbers by their distribution, and MMSE scores. A multivariable linear regression analysis, including age, sex, diabetes, hyperlipidemia, total cholesterol, WMH burden, and total CMB number, was performed with the MMSE score as the dependent variable. Furthermore, participants were stratified on the basis of CMB numbers (none, 1–10, and >10) and their location. MMSE scores were then compared using the Kruskal-Wallis test with post hoc comparisons. Finally, additional linear regression analyses were performed to examine the association between MMSE scores and CMB numbers (none, 1–10, and >10), separately for each CMB distribution (total, lobar, deep, and cerebellar). The adjusted coefficient of determination (R2) was calculated for each model. Statistical significance was set at a P value of <.05. R statistical software (Version 4.2.1; http://www.r-project.org/) was used for all statistical analyses.
RESULTS
Baseline Characteristics of the Study Participants
Table 1 summarizes the baseline characteristics of all participants. Among 1183 consecutive participants with suspected cognitive decline, 354 were included in the training data set (n = 287; mean age, 68 [SD, 14] years; 116 [40.4%] men and 171 [59.6%] women) and the internal validation data set (n = 67; mean age, 72 [SD, 10] years; 27 [40.3%] men and 40 [59.7%] women) for a DL segmentation model. Among 829 participants with clinical information, 381 were excluded for missing information on either hypertension or diabetes (n = 35), total cholesterol levels (n = 104), WMH burden data (n = 60), and MMSE (n = 182), leaving 448 eligible participants (mean age, 72 [SD, 9] years; 171 [38.2%] men and 277 [61.8%] women).
Baseline characteristics of participantsa
Between January and December 2023, two hundred sixty-three brain MRI studies were referred to our center, of which 195 were excluded for missing SWI (n = 173) and segmentation processing errors (n = 22). Sixty-eight participants from 49 different sites were involved (mean age, 53 [SD, 17] years; 32 [47%] men and 36 [53%] women). Seventeen unique MR scanner models (four 1T and thirteen 3T) were included from 3 major manufacturers (GE Healthcare, Philips Healthcare, and Siemens). The slice thicknesses ranged between 0.8 and 5 mm, and the in-plane spatial resolutions ranged between 0.24 × 0.24 and 0.9 × 0.9 mm2 (Supplemental Data).
CMB Segmentation Evaluation
The internal and external validation data set mean DSCs were 0.73 (SD, 0.25) (95% CI, 0.67–0.79) and 0.46 (SD, 0.32) (95% CI, 0.33–0.59), respectively. In the internal validation data set, the DL segmentation model demonstrated an F1 score and sensitivity of 61.8% (range, 43.8%–79.8%) and 85.7% (range, 70.6%–93.7%), respectively. In the external validation data set, the DL segmentation model performed modestly, with an accuracy, sensitivity, and specificity of 75.0 (range, 63.6%–83.8%), 70.0 (range, 48.1%–85.5%), and 77.1% (range, 63.5%–86.7%), respectively (Supplemental Data). Representative images of CMB segmentations are shown in Fig 3. Moreover, sample images of false-positive and false-negative segmentations in the external validation data set are provided in the Supplemental Data.

Representative images of SWI, CMB (red), and WMH (purple; periventricular white matter, yellow; deep white matter) segmentations overlaid on SWI and FLAIR in 3 participants. A, A 74-year-old woman with normal cognition and mild WMH burden, with lobar and cerebellar CMBs. B, A 78-year-old woman with impaired cognition and large WMH burden, with increased CMB numbers in all 3 locations. C, A 79-year-old woman with impaired cognition and minimal WMH burden, with only a few cerebellar CMBs. HTN indicates Hypertension.
Comparison among Participants according to CMBs
Participants with CMBs were significantly older than those without CMBs (mean age, 73 [SD, 9] years versus 69 [SD, 10] years, respectively; P < . 001). The difference in the MMSE between the 2 groups was marginally significant (CMB present: mean, 23.8 [SD, 5.5]; CMB absent: mean, 24.8 [SD, 4.8]; P = .053). Participants with CMBs had a significantly higher WMH burden (mean, 4.8 [SD, 5.6%]) than those without CMBs (mean, 2.4 [SD, 3.2%]; P < . 001). All other clinical variables were not significantly different between the 2 groups (CMB present versus absent) (Table 2).
Comparison of clinical variables among participants with CMBsa
Relationship between the CMB Number and Clinical Variables
In the training data set, no significant differences were observed between the ground truth–based and inference-based CMB counts, with both showing a negative association with total cholesterol, high-density lipoprotein (HDL), and low-density lipoprotein (LDL) and a positive association with WMH burden. In the clinical data set, WMH burden had significant positive associations with log-transformed CMB in all areas (total: β = 0.08; 95% CI, 0.06–0.1; P < . 001; lobar: β = 0.07; 95% CI, 0.05–0.09; P < . 001; deep: β = 0.04; 95% CI, 0.03–0.05; P < . 001; and cerebellar: β = 0.02; 95% CI, 0.01–0.03; P < . 001) (Fig 4 and the Supplemental Data). Older age and hypertension were also significantly associated with log-transformed CMBs in all areas. Total cholesterol level revealed a negative association with log-transformed total, lobar, and deep CMB numbers (total CMB: β = −0.003; 95% CI, −0.006–0.001; P = .007; lobar CMB: β = −0.003; 95% CI = −0.005–0.001; P = .005; and deep CMB: β = −0.002; 95% CI, −0.003–0.001; P = .002). HDL and LDL levels showed a negative association with log-transformed CMBs in all areas, with statistically significant associations observed between HDL and deep CMBs (β = −0.003; 95% CI, −0.007–0.002; P = .04), and LDL and lobar CMBs (β = −0.003; 95% CI, −0.006–0.005; P = .02) (Supplemental Data).

The relationship between CMB number and WMH burden. These scatterplots illustrate associations between the log-transformed CMB number by their distribution and WMH burden. Among these, lobar CMB numbers show the highest β coefficient with WMH burden (β = 0.09, P < . 001). Solid blue lines indicate the lines of best fit of linear regression, and the shaded areas indicate the 95% CIs. The R2 values are coefficients of determination of linear regression. y indicates ‘dependent variable’ in this case log-transformed CMB number while x indicates WMH burden (%).
Relationship between the MMSE and Clinical Variables
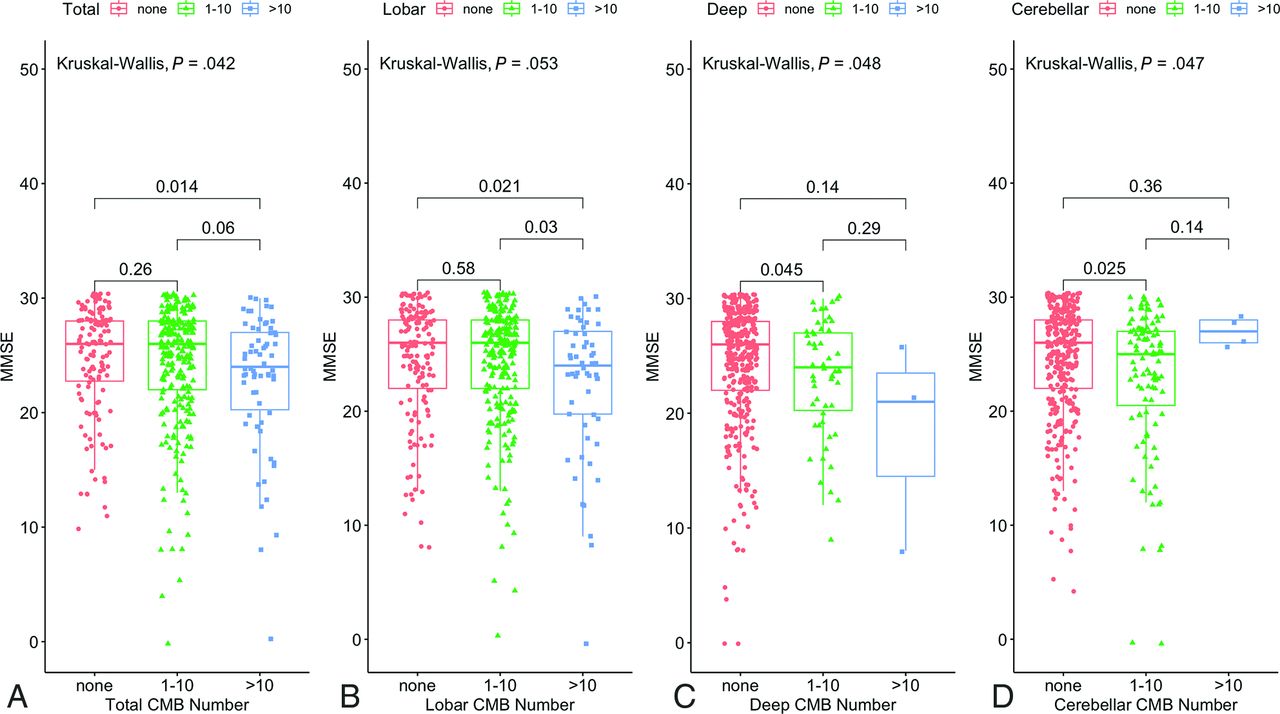
In univariable linear regression, age, diabetes, hyperlipidemia, total cholesterol, WMH burden, and total CMB numbers demonstrated significant associations with MMSE scores (age: β = −0.19; 95% CI, −0.24–0.14; P < . 001; diabetes: β = −1.15; 95% CI, −2.26–0.04; P = .043; hyperlipidemia: β = 1.51; 95% CI =0.52–2.51; P = .003; total cholesterol: β = 0.02; 95% CI, 0.003–0.03; P = .014; WMH burden: β = −0.29; 95% CI, −0.38–0.19, P < . 001; total CMB number: β = −0.014; 95% CI, −0.03–0.006; P = .006). Univariable linear regression analyses between log-transformed CMB numbers in each area and MMSE scores showed that total, deep, and lobar CMB numbers had strong negative associations with MMSE (total: β = −0.66, P = .001; deep: β = −1.2, P = .033; lobar: β = −0.61, P = .004) (Supplemental Data). In multivariable linear regression, all variables except total cholesterol and diabetes showed significant associations with MMSE scores (Table 3). Additionally, the group with >10 lobar CMBs had significantly lower MMSE scores than those with fewer lobar CMBs (P = .03) and no lobar CMBs (P = .021) (Fig 5).

Boxplots showing the group comparisons of MMSE scores with respect to CMB numbers (none, 1–10, and >10). Significant group differences in MMSE scores are observed among the 3 groups of CMB numbers (total [A], deep [C], and cerebellar [D]). The group with >10 lobar CMBs (B) has significantly lower MMSE scores than those with fewer lobar CMBs (P = . 03) and no lobar CMBs (P = . 021).
Relationship between cognition (MMSE) and vascular risk factors
DISCUSSION
Our aims were to train and validate a DL segmentation model for accurate CMB quantification and to evaluate associations among CMB numbers, WMH burden, vascular risk factors, and cognitive function. The segmentation performance was robust in the internal validation data set (DSC = 0.73) but only modest in the external validation data set (DSC = 0.46). In all locations, CMB numbers had significant positive associations with WMH burden, older age, and hypertension. Particularly, lobar and deep CMB numbers were significantly associated with lower total cholesterol levels. In multivariable linear regression analysis, older age, male sex, hyperlipidemia, a higher total CMB number, and WMH burden were associated with decreased cognitive function.
In the internal validation data set, the robust segmentation performance was like the results observed in a previous study investigating DL-based CMB segmentation (DSC = 0.72).24 Nonetheless, the DSC of the external validation data set was noticeably lower than that of the internal validation data set. This discrepancy is probably attributable to the highly variable MR acquisition settings within the external validation data set, differing in MR manufacturers, magnetic fields, in-plane resolutions, and slice thicknesses. Moreover, the mean age of patients in the external data set was significantly lower than that in the internal data set, which may have also affected the segmentation performance. Despite the lower DSC in the external validation data set, the CMB detection rate of the DL model was acceptable; this outcome is promising, considering that true-positive CMB detection is clinically more relevant than accurate volumetric segmentation. More important, the generalizability of the DL model has been proved by the robust external validation data set.
In recent years, several automated approaches for CMB detection have been proposed. One notable method used a 2-stage framework based on a 3D fast radial symmetry transform and deep residual neural networks, achieving a sensitivity of 95.8% with a precision of 70.9%, and 1.6 false-positives per case.12 However, this study lacked external validation and used a relatively small data set. Another approach used a region-based You Look Once (YOLO) for candidate detection followed by a 3D-Convolutional Neural Network (CNN) for false-positive reduction, demonstrating sensitivities of 93.62% and 78.85% for high- and low-resolution data, respectively.25 Despite its efficacy, the complex DL structures of these 2 studies have been limited in their adaptability compared with simpler models like nnU-net, which our study uses. Last, a study focusing on cases of traumatic brain injury compared classification and segmentation approaches, finding the U-Net model to be the most effective with a 90% detection rate at false-positive counts of 17.1 in patients with traumatic brain injury.18 However, its limited scope in relation to traumatic brain injury cases and the small data set size raise questions about the generalizability of the results. Our approach, using the nnU-net model, offers a simpler-yet-efficient alternative, providing a modest performance while maintaining a straightforward architecture that facilitates potential modifications and adaptability.
Older age and hypertension are well-established risk factors for CMB.1 However, an interesting finding was that the total, deep, and lobar CMB numbers were negatively associated with total cholesterol levels. Several studies have also found a negative association between lipid profiles and CMB prevalence.6,7,26 A large cross-sectional study of neurologically healthy individuals in Japan revealed an inverse correlation between total cholesterol levels and the prevalence of deep CMBs.7 In other studies, the serum LDL level was negatively correlated with deep CMBs,6 while the Framingham Heart Study showed a negative association between total cholesterol and lobar CMB.26 Reduced levels of total cholesterol have been associated with smooth-muscle deterioration and endothelial cell weakness, making the arterial walls more fragile and prone to microaneurysm development, potentially causing leakage and rupture.8
CMB and WMH are the most common radiologic manifestations of SVD; they frequently coexist in patients with SVD and share an identical pathologic basis.27,28 However, visual assessments of WMH, such as the Fazekas scale, have limited value for the accurate volumetric quantification of WMH. Balestrieri et al5 measured WMH volume using a semiautomated method, finding a significant positive correlation between CMB and WMH volume. Herein, the lobar CMB number had the highest positive association with WMH burden, suggesting a potential link between lobar CMB and WMH stemming from cerebral amyloid angiopathy.29⇓-31
Several studies have investigated the association between cognitive function and SVD imaging findings, including CMB and WMH. Zamboni et al32 demonstrated that in patients with TIAs, reduced cognitive function was linked to an increased probability of WMH in the frontal periventricular white matter. Poels et al10 discovered that the links between deep or cerebellar CMBs and cognitive function were weaker compared with strictly lobar CMBs and were influenced by other factors such as brain atrophy and SVD indicators. In contrast, the association between lobar CMB and cognition was found to be highly significant. Likewise, the lobar CMB number exhibited the strongest negative association with cognition among the CMB distribution patterns, suggesting that strictly lobar CMBs may indicate pathologies related to cerebral amyloid angiopathy, such as the vascular accumulation of β-amyloid, which may directly affect cognition.10,33 Another hypothesis suggests that strictly lobar CMBs may have a more pronounced impact on surrounding brain tissue compared with deep or cerebellar CMBs due to their potential to disrupt functionally significant cortical and subcortical structures.34 Moreover, the MMSE scores were lower in the CMB-lobar group compared with the CMB-mixed group, indicating that lobar CMB related to cerebral amyloid angiopathy may contribute significantly to the pathologic process of cognitive decline.35
This study has a few limitations. First, there is the inherent bias associated with the retrospective nature of this study. Second, a few participants were excluded due to missing information on body mass index and detailed lipid profiles (ie, triglyceride and HDLs and LDLs). Third, only the MMSE was used to assess cognitive function. Using this may have limited our comprehension of the impact of CMBs in various cognitive domains. Fourth, the DL segmentation model was trained in a single center; subsequently, the segmentation performance in the external validation data set was only modest. However, such underperformance was anticipated because DL models trained with medical images have consistently shown lower performances in external validation data sets.36 Further research is needed to improve the technical aspects of the DL segmentation model for CMB. Fifth, when we compared the demographics among the training data set, internal validation data set, and clinical data set, a significant difference was observed in age, suggesting that there might be discrepancies among the groups. However, no significant differences were found in other clinical variables or the CMB count. Sixth, we did not exclude patients with medication histories that may have acted as confounding factors. However, because each data set involves a relatively similar cohort group that visited the hospital for mild cognitive impairment or dementia, the impact is expected to be minimal. Finally, reports suggest that vessel wall thickening, enlarged perivascular spaces, decreased vascular density, cerebral blood flow, and increased vessel tortuosity are associated with SVD. However, in our study, we did not analyze the association between these factors and CMBs.37,38 Finally, our study population included only participants suspected of having clinical impairment, and our results cannot, therefore, be generalized.
CONCLUSIONS
The DL segmentation model accurately quantified CMBs in all locations. After adjusting for age and sex, multivariable linear regression revealed that hyperlipidemia, a higher total cerebral microbleed number, and WMH burden were associated with decreased cognitive function. Our study efficiently analyzed CMB and WMH burdens and explored their clinical relevance regarding cognitive function.
Footnotes
This work was supported by a grant (2024IP0026-1) from the Asan Institute for Life Sciences, Asan Medical Center, Seoul, Korea.
Disclosure forms provided by the authors are available with the full text and PDF of this article at www.ajnr.org.
References
- Received June 26, 2024.
- Accepted after revision October 18, 2024.
- © 2025 by American Journal of Neuroradiology


Jump to section
Related Articles
Cited By...
- No citing articles found.