
Abstract
BACKGROUND AND PURPOSE: The glymphatic (glia-lymphatic) system is a paravascular pathway for the clearance of waste metabolites including amyloid β from the brain. Serial T1 relaxation time measurements after the intrathecal injection of gadolinium-based contrast agents facilitate the analysis of the temporal dynamics that may be different in patients with spontaneous intracranial hypotension (SIH) and those without SIH.
MATERIALS AND METHODS: 3D T1-weighted magnetization-prepared 2 rapid gradient echo sequences were acquired in 4 patients with SIH with proved CSF leaks and 12 patients without SIH before, 2–4, 6–8, and 24–48 hours after intrathecal gadobutrol injection. MR scans were warped to the Montreal Neurological Institute space and serial scans were coregistered. T1 relaxation times were measured in predefined ROIs including the subarachnoid space, cortex, white matter, and cervical lymph nodes.
RESULTS: In the subarachnoid space and cortex, T1 relaxation times decreased after 2–4 and 6–8 hours before they increased again. In contrast, in the white matter of the temporal lobe T1 relaxation time still decreased after 24–48 hours. There was a striking difference in patients with SIH who did not show a clear contrast distribution within the brain parenchyma.
CONCLUSIONS: T1 relaxation time curves are compatible with a convective flow driven by arterial pulsations via paravascular spaces surrounding penetrating arteries into the brain’s interstitial fluid in the deep white matter. Different curves in patients with SIH and those without SIH indicate that the CSF pressure also impacts the temporal kinetics of the glymphatic system.
ABBREVIATIONS:
- AQP4
- aquaporin-4
- GBCA
- gadolinium-based contrast agents
- ISF
- interstitial fluid
- MP2RAGE
- magnetization-prepared 2 rapid gradient echo
- SIH
- spontaneous intracranial hypotension
SUMMARY
PREVIOUS LITERATURE:
The glymphatic transport is a convective bulk flow driven by arterial pulsations around the main arterial trunks at the base of the skull.
KEY FINDINGS:
Serial T1 relaxation time measurements demonstrate a lower transport from the CSF, in the cortex, and deep white matter in patients with spontaneous intracranial hypotension (SIH) compared with patients without SIH.
KNOWLEDGE ADVANCEMENT:
The CSF pressure also impacts the glymphatic transport, which contributes to the fact that glymphatic transport is larger during sleep.
In the early 2010s, Illif et al1,2 and Nedergaard3 introduced the glymphatic system consisting of 3 serial elements: a para-arterial CSF influx route, a paravenous interstitial fluid (ISF) clearance route, and an intracellular transastrocytic path that couples the 2 extracellular paravascular routes.1⇓-3 The exact route of glymphatic transport is still not clear and the terms para- and perivascular spaces are often mixed.4 Anatomically, the perforating arteries at the base of the brain are enveloped by 2 leptomeningeal membranes with the outer membrane connected to the pia mater and the inner membrane in close proximity to the arterial wall. Thus, the paravascular space at the base of the lenticulostriate arteries is in direct contact with the subarachnoid space. Next to the paravascular space, a perivascular space is located within the arterial tunica media itself.4 The perforating arteries penetrating the cortex from its convexity are different. Enveloped by only 1 leptomeningeal membrane closely applied to the vessel wall and no outer layer, the paravascular space is considered to communicate with the subpial rather than the subarachnoid space. Again, next to the paravascular space a perivascular space within the arterial tunica media exists.4 At the capillary level, the leptomeningeal basement membrane and the glia limitans merge, so that only a perivascular space remains. It is filled with an extracellular matrix and not connected to the subarachnoid space.5 From the capillary level, ISF flows toward perivenous spaces, enters the perivenous spaces, and flows along with veins toward brain meninges where it is collected in meningeal lymphatic vessels located next to major venous sinuses or nasal lymphatic vessels.6,7 At present, it remains unclear whether paravascular and perivascular compartments in humans are anatomically and functionally contiguous and whether interstitial clearance of solutes, neurotoxins and waste proteins including amyloid β occurs via a periarterial route, a paravenous route, or a combination of both.4
The glymphatic transport is considered to be mediated by arterial pulsations resulting in a convective bulk flow that is prominent in areas of the cerebral cortex adjacent to large artery trunks.6⇓-8 CSF-ISF exchange is highly dependent on aquaporin-4 (AQP4) water channels in perivascular astrocytic end-feet.2,9 The glymphatic transport has a circadian rhythm with a higher “flow” during sleep and nonrapid eye movement sleep.10 It decreases with poor sleep11 and age, the latter has been suggested to be caused by reduced CSF interstitial influx secondary to decreased pulsatility of hardened arteries,12 reduced CSF production and pressures,13,14 and reduced AQP4 polarization of astrocytes.15 Age-related glymphatic function reduction may also be caused by a poorer meningeal lymphatic drainage to the deep cervical lymph nodes.16
Among several imaging modalities that have been evaluated to depict the glymphatic transport in humans, serial MR imaging cisternography remains the standard.6,8,17⇓-19 Gadolinium-based contrast agents (GBCA) are injected into the intrathecal space at a lumbar level and serial MR imaging scans depict the temporal dynamics of how the contrast agent “flows” from the subarachnoid space into the cortex, into the white matter, cerebral veins, and possibly into cervical lymph nodes.17⇓-19 Signal differences in the brain parenchyma however are subtle and quantitative sequences are needed to elaborate differences between patient groups. Here we applied T1 relaxation time measurements derived from magnetization-prepared 2 rapid gradient echo (MP2RAGE) sequences and compared patients with spontaneous intracranial hypotension (SIH) to patients who underwent MR imaging cisternography due to proven or suspected cranial CSF leaks (non-SIH group). We hypothesized that the T1 relaxation time curves differ in patients with SIH and those without SIH.
MATERIALS AND METHODS
Patients
We prospectively enrolled 16 consecutive patients who underwent MR imaging cisternography as a part of their diagnostic work-up at the University of Freiburg Medical Center between February 2021 and October 2023 (mean age 55.6 ± 12 years; 9 women, 7 men) (Table 1). Indications for MR imaging cisternography were symptoms suggestive for SIH to localize a spinal CSF leak or suspected or proved CSF rhinorrhea.
Patient characteristics
MR Imaging Protocol
All patients received the simultaneous intrathecal application of 0.5 mL gadobutrol (Gadovist, Bayer) and 15 mL iopamidol (Solutrast 250 mol/L, Bracco) at a lumbar level. Patients were studied before, between 2–4, 6–8, and after 24–48 hours on a 3T scanner (Magnetom Prisma, Siemens) by using a 64-channel head and neck coil. To depict a cranial CSF leak, a highly resolved sagittal compressed sensing T1-weighted black-blood sampling perfection with application optimized contrast using different flip angle evolution (SPACE) sequence was acquired.20 Sequence parameters resulting in an almost isotropic resolution of 0.5 × 0.5 × 0.6 mm3 were TR/TE, 800/5.1 ms; field of view, 210 × 210 mm2; 256 slices; section thickness, 0.60 mm; matrix, 384 × 384; fat saturation; pixel bandwidth, 450 Hz/px; turbo factor, 50; total scan time, 6:50 min. To analyze the temporal dynamics of the GBCA distribution, a sagittal, isotropic 1 mm³ MP2RAGE sequence TR/TE, 5000/2.88 ms; TI1, 700, TI2, 2500 ms; field of view, 256 × 256 mm2; 160 slices; section thickness, 1 mm; matrix, 256 × 256; pixel bandwidth, 240 Hz/px turbo factor, 160; total scan time, 8:52 min), was acquired from which T1 relaxation time maps were generated.
Demographic and clinical findings including CSF opening pressure, Bern score, and CT myelography results were recorded from the patient charts.9⇓-11
Postprocessing
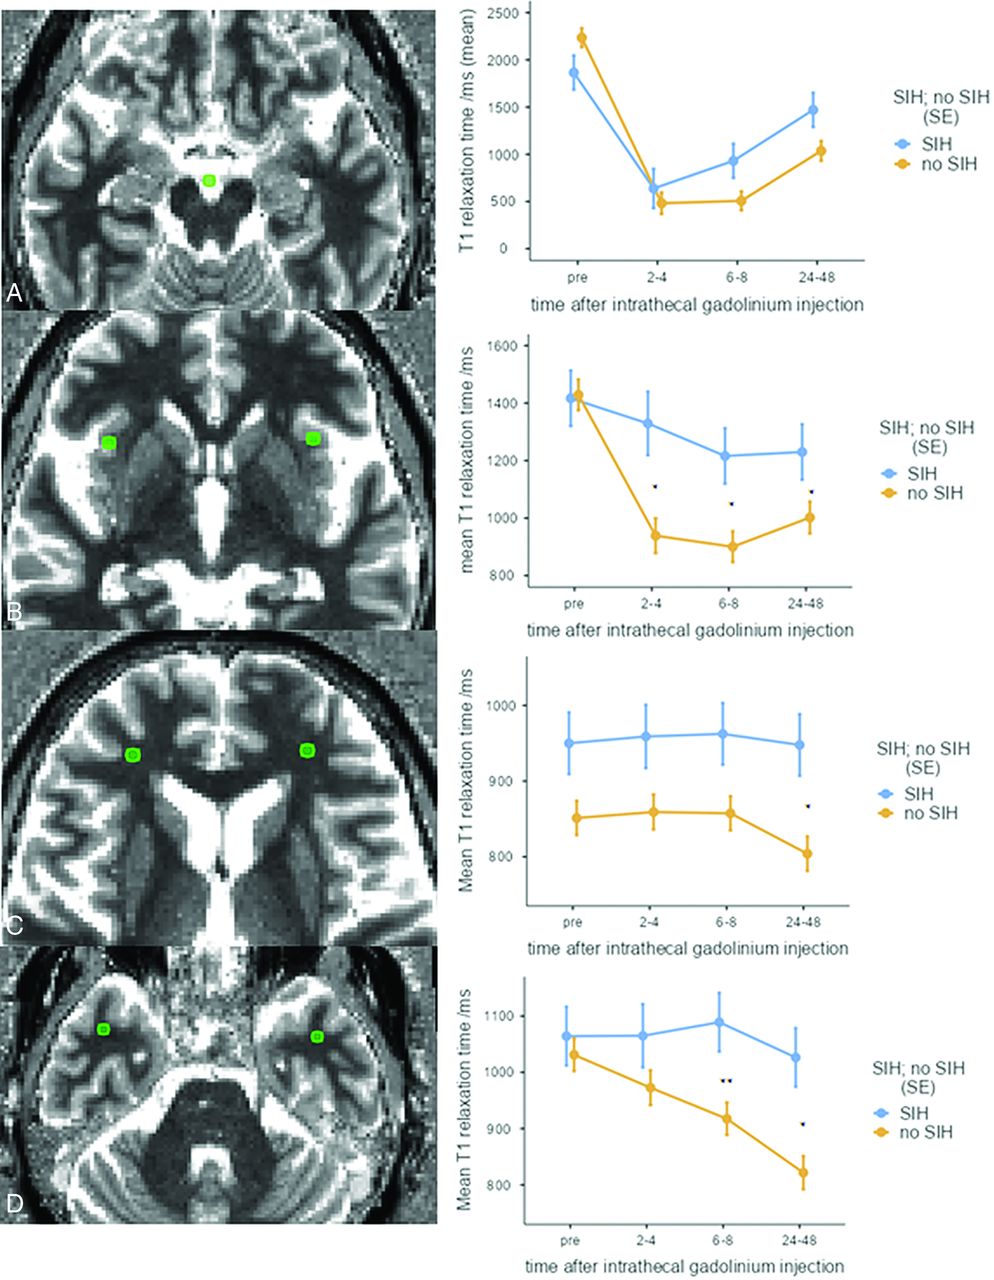
Using the toolbox NORA (www.nora-imaging.org), T1 relaxation time maps before, 2–4, 6–8, and 24–48 hours after injection were warped to the Montreal Neurological Institute space and coregistered by using SPM 12 (http://www.fil.ion.ucl.ac.uk/spm/). T1 relaxation times were measured in predefined ROIs of equal size and volume (0.63 cm2 and 0.095 mL, respectively) in the interpeduncular cistern, cortex (anterior insula), and white matter of the temporal and frontal lobes, respectively (Fig 1). For the subarachnoid CSF space, a single ROI was placed at interpeduncular cistern. For the brain parenchyma, an ROI was placed bilaterally in the cortex (anterior insula), in the white matter of the temporal and frontal lobes. In addition, T1 relaxation times were measured in ROIs manually identified in each patient in cervical lymph nodes. Because lymph nodes were of different size and location, these measurements were performed in the PACS.

T1 relaxation time curves in a 69-year-old woman with rhinorrhea after prolactinoma surgery (non-SIH group). T1 relaxation times decrease in the interpeduncular cistern (A) and the anterior insula (B) before they increase again after 6–8 hours. In contrast, T1 relaxation times in the white matter of the frontal and temporal lobes (C and D) decrease between 6–8 and 24 to 48 hours. The right column shows curves averaged over SIH and non-SIH groups: In the SIH group (blue lines), a significant T1 relaxation time decrease only occurs in the subarachnoid space. (*P < .05, **P < .01).
Statistics
SPSS Statistics for Macintosh (version 28.0; IBM), R (version 4.3.0, https://www.R-project.org/), and the open-source statistical software Jamovi version 2.4.8.0 (https://www.jamovi.org) were used for statistical analysis. A 1-sample Shapiro-Wilk test was applied to check for the assumption of normal distribution. Quantitative variables were expressed as number (percentage), mean ± standard deviation, or median [interquartile range], as appropriate. Differences between categoric data were determined by using Pearson χ2 test, and differences between groups for continuous data were determined by using independent samples t tests accounting for unequal variances or a Mann-Whitney U test. Statistically significant changes in T1 relaxation times over time were determined by linear mixed model analysis. A P value < .05 was considered statistically significant.
Ethics Statement
The study was performed in accordance with the ethical principles of the Declaration of Helsinki and its later amendments. Approval of our study protocol was granted (No. 21–1046) by the institutional review board of the University of Freiburg Medical Center, and all participants provided informed written consent before the inclusion.
RESULTS
Four patients with SIH (mean age 59 ± 8.4, 3 women and 1 man) with proved spinal CSF leaks were compared with 12 (1 patient had 2 examinations) patients (54.2 ± 13.5, 6 women and 6 men) who had either CSF rhinorrhea due to idiopathic intracranial hypertension, after surgery, or no SIH according to International Classification of Headache Disorders criteria (non-SIH group)21⇓-23 (Table 1). Sex and age distribution were similar in both groups: SIH group (59 [48–68] years, 3/4 women), non-SIH group (55 [32–76] years, 6/12 women).
T1 relaxation times decreased significantly over time in the interpeduncular cistern, cortex, and white matter of the non-SIH group, whereas in the SIH group a significant decrease was seen only in the interpeduncular cistern at 2–4 hours and 6–8 hours after contrast injection (Table 2).
T1 relaxation times (ms) in the interpeduncular cistern, gray matter (insular cortex), white matter of the temporal and frontal lobes, and cervical lymph nodes
Temporal dynamics showed the highest contrast (steepest T1 relaxation decrease) in the interpeduncular cistern after 2–4 hours, in the cortex after 6–8 hours, and in the white matter after 24–48 hours, respectively (Table 2) (Figs 1–3). There was no difference between groups at any time point in CSF. There were statistically significant differences between patients with SIH and those without SIH in insular gray matter at 2–4, 6–8, and 24–48 hours after contrast injection (P = .028, P = .018, and P = .042, respectively), in frontal white matter at 24–48 hours (P = .013), and in temporal white matter at 6–8 hours and 24–48 hours after contrast injection (P = .006 and P = .042).

T1 relaxation time difference maps in the 69-year-old woman reported in Fig 1. A, Pre; B, 2–4 hours; C, 6–8 hours; D, 24–48 hours after intrathecal gadobutrol injection. Brain-wide enhancement over time is shown as T1 relaxation time difference. The T1 relaxation time difference in milliseconds is indicated by the color scale. After 2–4 hours, gadobutrol is seen in the ventricles and subarachnoid space. After 6–8 hours, gadobutrol is seen especially in the subcortical area. After 24–48 hours, gadobutrol has progressed deep into the brain parenchyma and is beginning to be cleared from the ventricles.

T1 relaxation time difference maps in a 68-year-old woman with SIH due to a CSF venous fistula at T10-11 of the left side. A, Pre; B, 2–4 hours; C, 6–8 hours; D, 24–48 hours after intrathecal gadobutrol injection. Tracer accumulation occurs primarily in brain regions adjacent to large arterial trunks at the surface (6–8 hours), but is sparse in the white matter (24–48 hours).
CSF
The mean T1 relaxation time before contrast administration differed significantly from the mean of the 3 time points after contrast agent injection in the no SIH group (P < .001, Table 2), while in the SIH group there was only a statistically significant difference in the pair-wise comparisons of the measurements before and after 2–4 hours (P < .001) and before and after 6–8 hours (P = .01).
Gray Matter
T1 relaxation times before contrast differed from the other 3 time points in the non-SIH group (P < .001), but not in the SIH group (Table 2).
Temporal White Matter
The mean T1 relaxation time before contrast injection differed from the measurements at 6–8 hours and 24–48 hours in the no SIH group (P = .002 and P < .001), but not in the SIH group.
Frontal White Matter
There was a statistically significant difference only in the no SIH group when pair-wise comparing T1 relaxation times before and after 24–48 hours (P < .005).
Cervical Lymph Nodes
When both groups were considered together, mean T1 relaxation time before differed from the mean time after 2–4 hours only (P = .039).
DISCUSSION
This study replicates earlier studies showing the temporal dynamics of intrathecally injected GBCA, which first opacify the subarachnoid space, then enter the cortex before they are finally visualized in the deep white matter. Imaging cannot resolve whether this “flow” takes place in the para- or perivascular spaces, thus we refer to the term paravascular spaces that Iliff et al1,2 and Nedergaard3 used in their pivotal publications. The serial time relaxation curves are compatible with a glymphatic transport and are considered to represent convective or bulk flow driven by arterial pulsations that are prominent close to large artery trunks at the brain surface.6⇓-8,24 However, the different temporal dynamics in patients with SIH indicates that not only arterial pulsations but also the CSF pressure or the CSF volume impacts on the glymphatic flow. One may speculate that the reduced alertness (“brain fog”) reported by approximately 1 in 3 patients with SIH is due to a lower glymphatic transport.25 A different CSF pressure may also explain why the glymphatic transport is stronger during sleep, when the intracranial pressure is higher than when standing upright. Accordingly, a higher CSF flow in supine compared with upright positions was recently shown in a phase-contrast MR imaging study.26 Also, continuous positive airway pressure increases the CSF flow and likely the glymphatic clearance of waste proteins.27 A different CSF flow pattern in patients with idiopathic normal pressure hydrocephalus also differs from those of healthy controls by means of an early and persisting ventricular regurgitation of GBCA, as well as by enhancement of periventricular tissue across the ependymal ventricular lining, which is particularly prominent on late MR imaging scans.28
The visualization of the glymphatic system via intrathecal gadolinium clearly differs from IV contrast injections in which GBCA enter the brain not only along para- or perivascular spaces of penetrating cortical arteries, but also via the choroid plexus, the ciliary bodies of the eyes, and along perineural sheaths of cranial nerves.29 In our series, we could not detect T1 relaxation time changes in the globes. A different route has also been described for opacification of the perilymph spaces of the cochlea favoring an intrathecal instead over an IV contrast injection.30
We were able to detect T1 shortening in cervical lymph nodes only 2–4 hours after intrathecal contrast injection, which is difficult to interpret and may be related to the fact that only a few scans were acquired after 48 hours, the time point when intrathecally injected gadobutrol has been found in cervical lymph nodes.31
Limitations
Because intrathecal gadolinium injection is off-label, we can report on a small sample size of 16 patients (17 examinations, 1 patient had 2 examinations) only.32,33 The sample size is however comparable to former studies with 8 and 17 patients, respectively.17,18,28 MRI scans after intrathecal GBCA injection reliably display a CSF loss via the cribriform plate but do not have the temporal and spatial resolution to detect ventral or lateral spinal dural tears in patients with SIH.20,22 Whether it can show CSF venous fistulas is a matter of debate.34 Dynamic digital subtraction and CT myelographic techniques have surpassed intrathecal gadolinium injections, so it is unlikely to significantly increase the number of patients with SIH.22 Patients with SIH may not have been studied at exactly the same time points and may behave differently, eg, they stay in the supine position longer than the patients without SIH. However, staying in the supine position longer should enhance glymphatic transport as described above.26
CONCLUSIONS
Intrathecal gadolinium-based contrast agent displays the glymphatic transport through the brain. This transport is not only driven by a convective flow but also dependent on the CSF volume and pressure.
Footnotes
Disclosure forms provided by the authors are available with the full text and PDF of this article at www.ajnr.org.
References
- Received March 22, 2024.
- Accepted after revision May 19, 2024.
- © 2024 by American Journal of Neuroradiology


