
Abstract
BACKGROUND AND PURPOSE: Intracranial epidermoid tumors, temporal bone cholesteatomas, and head and neck epidermoid inclusion cysts are typically slow-growing, benign conditions arising from ectodermal tissue. They exhibit increased signal on DWI. While much of the imaging literature describes these lesions as showing diffusion restriction, we aimed to investigate these qualitative signal intensities and interpretations of restricted diffusion with respect to normal brain structures. This study aimed to quantitatively evaluate the ADC values and histogram features of these lesions.
MATERIALS AND METHODS: This retrospective study included children with histologically confirmed diagnoses of intracranial epidermoid tumors, temporal bone cholesteatomas, or head and neck epidermoid inclusion cysts. Lesions were segmented, and voxelwise calculation of ADC values was performed along with histogram analysis. ADC calculations were validated with a second analysis software to ensure accuracy. Normal brain ROIs—including the cerebellum, white matter, and thalamus—served as normal comparators. Correlational analysis and Bland-Altman plots assessed agreement among software tools for ADC calculations. Differences in the distribution of values between the lesions and normal brain tissues were assessed using the Wilcoxon rank sum and Kruskal-Wallis tests.
RESULTS: Forty-eight pathology-proved cases were included in this study. Among them, 13 (27.1%) patients had intracranial epidermoid tumors, 14 (29.2%) had head and neck epidermoid inclusion cysts, and 21 (43.7%) had temporal bone cholesteatomas. The mean age was 8.67 (SD, 5.30) years, and 27 (52.9%) were female. The intraclass correlation for absolute agreement for lesional ADC between the 2 software tools was 0.997 (95% CI, 0.995–0.998). The intracranial epidermoid tumor, head and neck epidermoid inclusion cyst, and temporal bone cholesteatoma median ADC values were not significantly different (973.7 versus 875.7 versus 933.2 ×10⁻⁶ mm2/s, P = .265). However, the ADCs of the 3 types of lesions were higher than those of 3 normal brain tissue types (933 versus 766, × 10-6 mm2/s, P < .0001).
CONCLUSIONS: The ADC values of intracranial epidermoid tumors, temporal bone cholesteatomas, and head and neck epidermoid inclusion cysts are higher than those of normal brain regions. It is not accurate to simply classify these lesions as exhibiting restricted diffusion or reduced diffusivity without considering the tissue used for comparison. The observed hyperintensity on DWI compared with the brain is likely attributable to a relatively higher contribution of the T2 shinethrough effect.
ABBREVIATIONS:
- EC
- head and neck epidermal inclusion cysts
- ICC
- intraclass correlation coefficient
- IE
- intracranial epidermoid cysts
- IET
- intracranial epidermoid tumors
- TBC
- temporal bone cholesteatomas
Intracranial epidermoid cysts (IE), temporal bone cholesteatomas (TBC), and head and neck epidermal inclusion cysts (EC) are typically slow-growing lesions arising from ectodermal tissue.1⇓–3 These benign entities are characterized by specific locations and distinctive features on CT and MRI.4⇓–6 Despite their differences, these lesions commonly exhibit increased signal intensity on trace DWI.7
Increased DWI signal can result from both restricted (reduced) diffusion and the T2 shinethrough effect.8 Diffusion restriction occurs when there is a decrease in molecular diffusion due to reduced free space for movement. On MRI, restricted diffusion is indicated by increased DWI signal intensity and reduced ADC values.9
The'T2 shinethrough effect increases when an elevated signal intensity on DWI is not predominantly due to restriction of water diffusion but instead largely results from an inherently high T2 signal in the tissue.10 This phenomenon can lead to the misinterpretation of the hyperintense DWI signal as indicative of diffusion restriction when it is not. Commonly observed in tissues with prolonged T2 relaxation times, such as in subacute infarctions and vasogenic edema, the T2 shinethrough effect is also manifested in various other pathologic conditions.11
In 1990, Tsuruda et al12 first demonstrated the use of DWI in diagnosing IEs. They assessed the ADC values of 2 IEs that were confirmed through surgery, finding that their ADC values were comparable with those of normal brain parenchyma, a feature not in keeping with diffusion restriction.12 This was followed by additional authors comparing the values with CSF.13⇓⇓–16 In 2002, Fitzek et al17 first demonstrated that the ADC of TBCs was in the range of brain values. In 3 patients in whom ADC could be calculated, the ADC was in the range of brain values (subcortical white matter and gray matter). Despite these findings, a considerable portion of subsequent imaging literature has depicted IEs, TBCs, and ECs as exhibiting diffusion restriction without explicit mention of comparators.6,18⇓⇓⇓–22 We have also personally seen comparisons of the diffusivity of some of these lesions with that of the brain in various practices within and outside the United States or during national or international conference lectures.
This study used quantitative ADC measurements to determine whether the DWI hyperintense signal detected in these specific ectodermal-origin masses is due to restricted diffusion. We assessed whether pediatric IEs, TBCs, and ECs exhibit diffusion restriction compared with adjacent structures. Consequently, the primary objective of this study was to quantify ADC distribution histograms in IEs, TBCs, and ECs in pediatric subjects.
MATERIALS AND METHODS
Study Design and Inclusion Criteria
This study is a retrospective, cross-sectional analysis conducted at a large academic children’s hospital. The hospital institutional review board reviewed and approved the study. Due to its retrospective nature, a waiver for documentation of informed consent was granted. Inclusion criteria were an age younger than 18 years, the availability of preoperative MRI, and a histologically-confirmed diagnosis of IE, TBC, or EC. Data were retrieved by searching our pathology and radiology databases (mPower; Nuance Communications Inc; and InSight; Illuminate) for cases of IE, TBC, and EC. Demographic data were obtained from our electronic medical records system (Epic Systems Corp; https://www.globaldata.com/company-profile/epic-systems-corp/) using the medical record number. Exclusion criteria included patients whose lesions were not within the intracranial compartment or the head and neck region, those without available preoperative MRI scans, and cases in which the diffusion MRI series lacked at least 2 b-values. The patient-selection process and the inclusion and exclusion criteria are depicted in Fig 1.

Sample study-selection process.
Imaging Data Acquisition
The examinations were performed on a 1.5T or 3T magnet (Siemens). Imaging was performed with a mixture of traditional single-shot EPI (with parallel imaging and minimal TE) and also readout-segmented multishot EPI with parallel imaging and long, variable echo-trains to decrease susceptibility and geometric distortion artifacts. Patients with inadequate imaging were excluded. ADC was measured using 2 b-values of 0 and 1000 s/mm2 for the axial echo-planar DWI sequence with the following parameters: TE = 54–127 ms, TR = 3000–11,000 ms, slice thickness = 2–5 mm, interslice gap = 0–2.25 mm.
Image Analysis
Lesions were assessed using DWI and manually segmented using a parametric software (pMRI) (https://www.parametricmri.com). Diffusivity metrics were calculated on a pixel-by-pixel basis. All imaging was retrospectively reviewed by a pediatric neuroradiologist with >10 years of experience. Normal tissues, such as brain, bone, CSF, skin, and subcutaneous tissue, were excluded from the ROIs by referencing T1WIs and T2WIs. Care was taken not to place the ROIs in areas of susceptibility artifacts. Similarly, the outer 2 mm of the lesion periphery, as well as the most cranial and caudal axial sections of the lesion, were excluded to prevent partial volume averaging.
DWI images were postprocessed using pMRI. ROIs were placed over the lesion, thalamus, cerebellum, and cerebral white matter. Average ADC values and histogram metrics, including minimum, maximum, median, and skewness, were calculated by fitting the signal intensities at each pixel in the b=0 and b=1000 images to the equation S(b) = S0 * e-ADC*b, where b represents the b-value (s/mm2), S(b) represents the signal intensity when the b-value equals b, S0 is the computed signal intensity at a b-value of 0, and ADC, the apparent diffusion coefficient (10−6mm2/s). A senior board-certified pediatric neuroradiologist reviewed the segmentation process and approved the results.
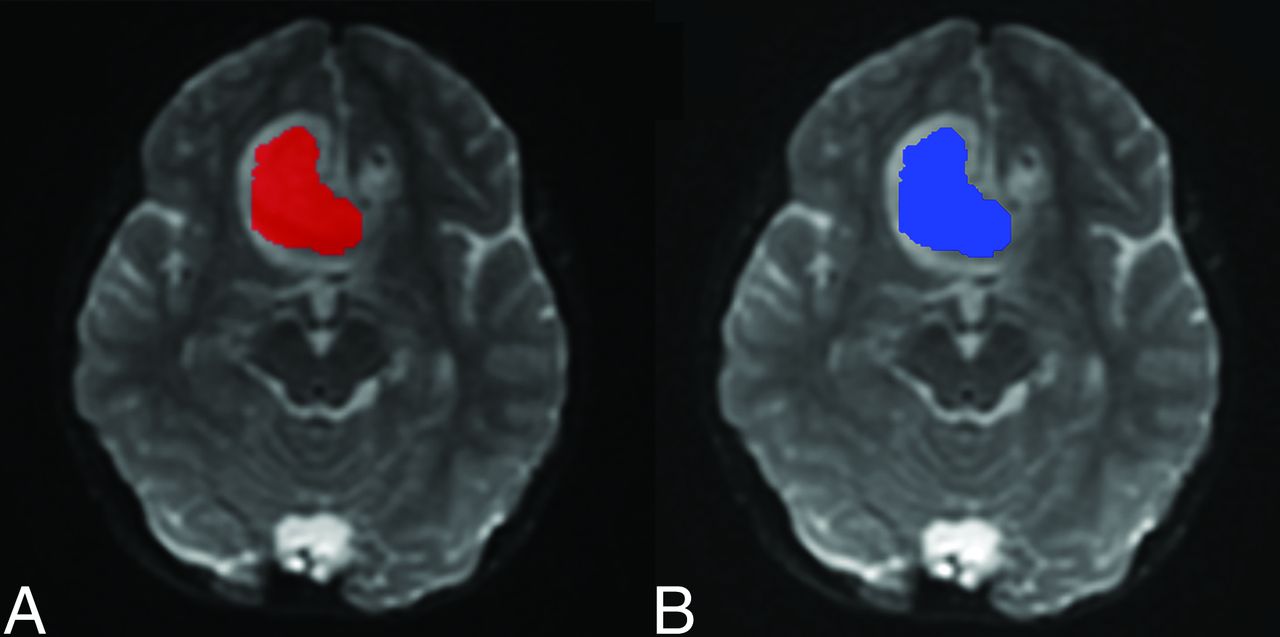
We used a second software for validation to ensure the accuracy of the diffusion analysis results obtained via pMRI. The software FireVoxel (FV) (http://www.firevoxel.com) was selected to recalculate the diffusion computation. To mitigate discrepancies arising from differences in ROI creation between the 2 software tools, we used the exact ROIs initially delineated in pMRI. Thus, all ROIs present in pMRI were exported as NIfTI files and subsequently imported into FV, ensuring that the ROIs in both software applications were fully aligned. Figure 2 displays screenshots of both pMRI and FV, showing the same image series with their corresponding ROIs. Examples of the DWI and T2-weighted images of the 3 types of lesions are shown in the Online Supplemental Data. An example of ROI placement for a TBC is shown in the Online Supplemental Data.

An example of an ROI used in pMRI (A) and FireVoxel (B) software to calculate the ADC values. The same ROI selection was used in both programs to ensure accurate and similar ADC values and to eliminate possible errors in multiple ROI creation.
Statistical Analysis
Statistical analysis was conducted using SPSS Statistics for Windows (Version 26.0; IBM). Nominal data were presented as percentages, while quantitative data were represented as medians (range). The agreement between software calculations of ADC was assessed using the intraclass correlation coefficients (ICC) with a 2-way random effects mode for absolute agreement among multiple measurements and also Bland-Altman analysis. Differences among the values and histogram features of the lesions and normal brain tissues were evaluated using the Wilcoxon rank-sum and Kruskal-Wallis tests. Statistical significance was defined as a P < .05.
RESULTS
Forty-eight patients were included in this study. Thirteen (27.1%) patients had IE, 14 (29.2%) had EC, and 21 (43.7%) had TBC. The mean age of the patients was 8.67 (SD, 5.30) years, and 27 (56.3%) were female.
Each lesion ADC value was calculated using pMRI and the FireVoxel software. The calculated mean ADC values of the lesions were 1118.52 (SD, 516.90) mm2/s for pMRI and 1134.79 (SD, 504.88) mm2/s for FireVoxel, with an ICC of 0.997 (95% CI, 0.995–0.998). Table 1 provides additional details for other histogram metrics and their respective ICCs. The Bland-Altman plot also demonstrates that the mean difference among the ADC values calculated by the 2 programs is just 19.23 mm2/s, with 45 of 48 data points (93.75%) falling within the upper and lower limits of agreement (Fig 3).

A Bland-Altman plot comparing the ADC values between pMRI and FireVoxel. The mean difference in ADC values between the 2 programs is −19.23 × 10⁻³ mm2/s. The 95% limit of agreement is at +46.37 and −84.83 × 10⁻³ mm2/s. Except for 3 outliers, all scores fall within the 95% range and are distributed randomly and equally within the upper and lower ranges, showing good reliability between the 2 programs. LoA indicates limits of agreement.
Mean ADC values calculated by pMRI and FireVoxel and their degree of agreement
The median ADC values were 973.7 × 10⁻⁶ mm2/s for IE, 875.77 × 10⁻⁶ mm2/s for EC, and 933.2 × 10⁻⁶ mm2/s for TBC, respectively (Fig 4). Because the Shapiro-Wilk test indicated that the distribution of median ADC values significantly deviates from the normal distribution (P < .001), the Kruskal-Wallis test was used to compare the ADC values of IE, EC, and TBC. The results revealed no significant differences among the 3 groups (P = .265). The median ADC values of the thalamus, cerebellum, and white matter were 789 × 10−6 mm2/s, 730 × 10−6 mm2/s, and 802 × 10−6 mm2/s, respectively (Fig 4). When we compared the median ADC values of normal brain regions with those of all 3 different lesions using the Wilcoxon rank-sum test, the ADC values of the lesions were found to be significantly higher (933 versus 766 × 10−6 mm2/s, P < .0001). The median ADC of the lateral ventricular CSF was 3193 × 10−6 mm2/s and was significantly higher than that of the various brain regions and 3 types of tissues analyzed (P < .001). Subgroup analyses for each brain region and lesion type are presented in Table 2.

Boxplot of the median ADC value of lesions (intracranial and extracranial epidermoid cysts and cholesteatoma) in comparison with the ADC values of normal brain area (normal thalamus, cerebellum, and white matter). Comparisons between the ADC values of each lesion showed no statistically significant differences between the lesions (P = .265). Comparisons between the ADC values of each pathology with each normal reference area and between the values of all pathologies to all normal control areas are all found to have a statistically significant difference (P < .001).
Comparison of median ADC values of lesions and normal brain parts using the Wilcoxon rank-sum test
DISCUSSION
Major advancements in neuroimaging, particularly with DWI and ADC, have been made since the foundational work of Le Bihan.23 ADC plays a vital role in measuring water diffusion in the brain, which is critical for evaluating microstructure and identifying characteristics of gray and white matter and CSF.24 ADC values are highest in CSF, reflecting its free-flowing nature; they are higher in the cerebral cortex than in white matter due to higher water and blood flow and intermediate in the basal ganglia and thalamus, indicating their unique microstructures.25 For perspective, free water ADC in an aqueous solution at 37.5°C is approximately 3.0 × 10⁻³ mm2/s but 2–10 times lower in the brain parenchyma.23 This difference leads to consistently lower diffusivity in normal brain parenchyma compared with CSF and CSF-filled structures like arachnoid cysts.
Epidermoid cysts or epidermoid cysts are ectodermal-derived congenital or acquired encapsulated lesions or nodules lined by stratified squamous epithelium and filled with luminal keratin. Similarly, congenital or acquired cholesteatomas show bland, keratinizing, stratified squamous epithelium and anucleate squares with keratinous debris. The lining and composition of these lesions are used for histopathologic differentiation. The keratin content often defines the imaging characteristics and distinguishes them from the more fluid content of other cysts and cystlike lesions.12,18–19,26 In 1990, Tsuruda et al12 first demonstrated that ADC aids in diagnosing “cystic-appearing” extra-axial brain lesions. IEs, which are cystic-appearing lesions but with more solid content, were found to have restricted diffusion relative to CSF but not when compared with normal parenchyma. Their study revealed that the ADC of arachnoid cysts approximates that of stationary water, whereas the ADC of IEs is similar to brain parenchyma.12 Contrary to these initial descriptions, a major portion of the imaging literature, including book chapters and radiology reports, continues to describe IEs, TBCs, and ECs as exhibiting diffusion restriction without specifying the comparator tissue, leading to erroneous conclusions and issues with interpretation. Numerous research studies show that IEs demonstrate restricted diffusion.18,19 However, a few studies have otherwise suggested the absence of such diffusion restriction in IEs.26,27 For TBCs, most articles report that they exhibit diffusion restriction.20,21 Multiple studies examining the DWI characteristics of ECs describe these lesions as also exhibiting restricted diffusion.6,22
IEs, TBCs, and ECs are recognized for their high DWI signal, a key distinguishing characteristic, though the reason behind this in these conditions is still debated in some articles.28 In medical imaging, DWI hyperintensity can result from a combination of restricted water movement and the T2 effects (T2 shinethrough).8,29 Accordingly, the qualitative evaluation of ADC map images plays a crucial role in differentiating these causes.29 Quantitative ADC values offer a more objective assessment of water diffusion in brain lesions or parenchyma.30 Higher ADC values indicate greater water molecule diffusivity, typical of CSF and vasogenic edema, while lower ADC values suggest restricted water movement, as in ischemic cells or densely cellular tumors.31
In our study, all 3 entities showed higher ADC values than the white matter, thalamus, and cerebellum, confirming that their hyperintense DWI signal is not due to restricted diffusion relative to the normal brain. Our findings also demonstrated that the ADC values of all 3 conditions are comparable, underscoring their shared origin and similar characteristics. The term “restricted or reduced diffusion” should be relative and needs comparison with a reference structure. For instance, ADC values of CSF are higher than those of any other brain tissue because all tissue has some degree of diffusion restriction compared with free water and CSF. Consequently, all brain regions will display restricted diffusion if the reference point is water or CSF. Preferably, when one evaluates ADC maps, the focus should be identifying diffusion restriction or reduced diffusivity relative to neighboring tissues. Ideally, the ADC value within the lesion should be statistically significantly lower than that of the surrounding tissues and visually distinguishable.
In this study, because all lesions were confined to the head and neck region, we used the cerebellum, white matter, and thalamus as reference points to compare with ADC values of IE, TBC, and EC. For these lesions to be classified as having restricted diffusion, their ADC values should have been lower than those in other brain parts. Nevertheless, our findings revealed that the ADC values of these lesions were, in fact, statistically higher than those of the brain. We used pMRI and the histogram metrics of IE, TBC, and EC to evaluate the ADC values. To ensure the precision of this software, we also used another software, FireVoxel, to calculate the ADC values of these lesions using the same ROIs as in the initial software calculation. On the basis of our findings, the calculated ADC values from pMRI and FireVoxel are similar. When comparing the means of ADC values, the ICC was 0.997. For the ADC medians, the ICC was even higher at 0.999. The lowest ICC value between these 2 applications, 0.878, was found when we compared the maximum ADC values of these lesions. This result suggests a slightly higher heterogeneity and lower degree of agreement when analyzing lesions with high ADC values.
Moreover, the Bland-Altman plot comparing the ADC values between the 2 software applications demonstrates good agreement and consistency in the measurements. The mean difference of measurements between these 2 applications was only 19.23, indicating that, on average, the ADC values obtained from both software applications are very similar. Additionally, the upper and lower limits of agreement, typically set at an SD of 1.96 of the differences (ranging from −84.83 to 46.37), encompass most the data points (93.75%). This finding further confirms the strong concordance between the 2 methods.
In IE, the hyperintensity observed in DWI was initially considered to result from restricted water movement due to the histologic arrangement of concentric keratin filaments.28 However, some studies have demonstrated that IE may exhibit ADC values similar in appearance to the surrounding brain parenchyma.12,13 Most of the studies that measured the ADC values of IE had small sample sizes. Chen et al14 reported 1.197 × 10⁻³ mm2/s in 8 patients with IE. Annet et al15 reported 1.070 × 10⁻³ mm2/s in 6 patients; and Hakyemez et al16 reported 1.157 × 10⁻³ mm2/s in 15 patients with IE. Our results align with some of these previous studies, with a mean ADC value of 1.116 × 10⁻³ mm2/s obtained from the DWI of 13 pediatric patients with IEC. In a study involving 15 patients with IEs, Hakyemez et al discovered that the ADC values of ECs were notably lower than those of CSF yet higher than those of deep white matter. They also observed that ECs showed similar intensity in exponential DWI to those of brain parenchyma. This finding suggests that the hyperintensity seen in trace images of ECs is primarily due to an enhanced T2 effect in the tissue rather than a decrease in ADC values.16
EC are typically found subcutaneously.22 However, studies using MRI to evaluate these lesions are scarce because most are diagnosed clinically.22 Imaging evaluations of these lesions in the head and neck region are even rarer. In a previous study, the ADC value of subcutaneous epidermal cysts has been documented to be 0.81 × 10⁻³ mm2/s from a sample of 14 patients.32 Our mean ADC value of 0.918 × 10⁻³ mm2/s is slightly higher. Suzuki et al32 measured epidermoid cysts located intracranially and subcutaneously and found a statistically significant difference, with intracranial cysts exhibiting a much higher ADC value. In contrast, our results did not show a statistical difference among IE, TBC, and EC. However, the sample size in these studies is limited, and further research is needed to clarify the true cause of this discrepancy.
Like epidermoid cyst, cholesteatoma is a benign lesion caused by the excessive growth of keratinizing squamous epithelium.33 While high-resolution CT is the primary imaging technique for diagnosing cholesteatoma, the characteristic DWI hyperintensity of TBC has been shown to enhance the accurate diagnosis of these lesions.20 This feature has also been used to rule out recurrence during follow-up.34 The DWI and ADC maps of these lesions are often compared with those of the brain because it is often the main tissue with adequate signal for comparison on trace DWI images. Only 1 previous study by Thiriat et al,35 in 2009, measured ADC values quantitatively in 9 patients with cholesteatoma, with a mean value of 0.903 × 10⁻³ mm2/s, different from the mean ADC value of an abscess 0.415 × 10⁻³ mm2/s. These findings generally align with the mean ADC value of our study of 1.252 × 10⁻³ mm2/s in 21 patients with TBC, suggesting that restricted diffusion (relative to brain) is not the cause of lesion hyperintensity on DWI.
This article is the first to address these 3 types of lesions comprehensively in a pediatric cohort by ADC histogram analysis with rigorous inclusion and exclusion criteria. Its strengths include strict inclusion and exclusion criteria, by including pathology-proved cases only, using 2 distinct software tools to calculate ADC to ensure accuracy, and double-checking ROIs. A potential limitation of our retrospective study is the that the ROIs may overlook microscopic pockets of CSF, calcification, or blood products in the lesions.
CONCLUSIONS
The ADC values for IE, TBC, and EC are higher than those of normal brain tissue, including the cerebellum, white matter, and thalamus. Consequently, these entities should not be classified as having restricted diffusion or reduced diffusivity without designating a comparator tissue or using the brain as a comparator, despite the literature and this study suggesting otherwise. The hyperintensity observed on DWI is likely relatively more attributable to the T2 shinethrough effect. If the comparison is explicitly made with CSF, then using the term restricted diffusion is accurate. While diffusion imaging remains crucial for visualizing these anomalies, accurate medical terminology should be used in reports to describe these findings appropriately. Further investigations are essential to ascertain whether similar lesions in other body regions also have a relatively smaller magnitude of diffusion restriction and whether distinguishing between dermoid and epidermoid cysts using quantitative assessments of ADC values is possible.
Footnotes
F.G. Gonçalves and A. Manteghinejad contributed equally to this work.
Disclosure forms provided by the authors are available with the full text and PDF of this article at www.ajnr.org.
References
- Received March 1, 2024.
- Accepted after revision June 4, 2024.
- © 2024 by American Journal of Neuroradiology


Jump to section
Related Articles
Cited By...
- No citing articles found.