
Abstract
BACKGROUND AND PURPOSE: Vein of Galen malformation (VOGM) is the most common congenital cerebrovascular malformation, and many patients have high mortality rates and poor cognitive outcomes. Quantitative diagnostic tools are needed to improve clinical outcomes, and the purpose of this study was to characterize intracranial blood flow in VOGM using quantitative 4D flow MRI.
MATERIALS AND METHODS: A prospective study of children with VOGM was conducted by acquiring 4D flow MRI to quantify total blood inflow to the brain, flow in the pathologic falcine sinus, and flow in the superior sagittal sinus. Linear regression was used to test the relationships between these flows and age, clinical status, and the mediolateral diameter of the outflow tract of the lesion through the falcine or straight sinus diameter, which is a known morphologic prognostic metric.
RESULTS: In all 11 subjects (mean age, 22 [SD,17 ] weeks), total blood flow to the brain always exceeded normal levels (mean, 1063 [SD, 403] mL/minute). Significant correlations were observed between falcine sinus flow and the mediolateral diameter of the straight or falcine sinus, the posterior cerebral artery/MCA flow ratio and age at scanning, and superior sagittal sinus flow proximal to malformation inflow and age at scanning.
CONCLUSIONS: Using 4D flow MRI, we established the hemodynamic underpinnings of the mediolateral diameter of the straight or falcine sinus and investigated metrics representing parenchymal venous drainage that could be used to monitor the normalization of hemodynamics during embolization therapy.
ABBREVIATIONS:
- ACA
- anterior cerebral artery
- BA
- basilar artery
- MD
- mediolateral diameter of the straight or falcine sinus
- NAR
- neonatal at risk
- PCA
- posterior cerebral artery
- SSS
- superior sagittal sinus
- VENC
- encoding velocity
- VOGM
- vein of Galen malformation
SUMMARY
PREVIOUS LITERATURE:
A purely morphologic marker of an aggressive early clinical course, the mediolateral diameter of the falcine sinus, was established without corresponding hemodynamic observations. Separately, cerebral hemodynamic measurements in patients with vein of Galen malformation using 4D flow MRI have been reported in 2 studies. For 10 patients total, changes during serial embolization therapy included inflow decreased, shunt flow decreased, and normal cerebral flow distribution established. A new MRI sequence with dual-velocity encoding and k-t SENSE acceleration now permits whole-slab flow measurements with a 1-mm3 resolution in <8 minutes.
KEY FINDINGS:
In 11 subjects (mean age, 22 weeks), total blood flow to the brain always exceeded normal levels. Significant correlations were observed among falcine sinus flow and its mediolateral diameter, the posterior cerebral artery/MCA flow ratio and age at scanning, and between the superior sagittal sinus flow and age at scanning.
KNOWLEDGE ADVANCEMENT:
The hemodynamic underpinnings of the mediolateral diameter marker of an aggressive clinical course were explicitly established. In addition, the flow through the superior sagittal sinus was identified as a possible marker of parenchymal venous drainage that may normalize after embolization therapy.
Vein of Galen malformation (VOGM), a high-flow intracranial arteriovenous shunt between the choroidal arteries and the prosencephalic vein (of Markowski) (Fig 1),1 presents in neonates or young infants as high-output cardiac failure with neurologic comorbidities.1,2 Endovascular treatment strategies developed in the 1980s and 1990s have provided therapeutic options for an otherwise fatal malformation,3,4 but outcomes when VOGM is diagnosed as a fetus remain poor, with one-third not surviving past 1 year of age and another one-third having severe neurocognitive effects,5 highlighting the necessity of further improvement in clinical care for these children.

A, Example vascular anatomy in VOGM. The complex plexiform nexus draining into the varix originates from segments of the posterior choroidal and anterior cerebral arteries. For the first scan of subject 2, example 4D flow automated cut plane and ROI extraction for the falcine sinus segment (B), time-resolved flow averaged across all cut planes (C), and mediolateral diameter measurement based on a TOF-MRA (D). RACA indicates right anterior cerebral artery; RICA, right internal carotid artery; RMCA, right middle cerebral artery; LICA, left internal carotid artery; LMCA, left middle cerebral artery; LPCom, left posterior communicating artery; LPCA, left posterior cerebral artery; RPCom, right posterior communicating artery; and LACA, left anterior cerebral artery.
The development of clear prognostic indicators for the neonatal course of the disease and eventual neurologic outcomes would almost certainly be helpful in this regard.6 A recent effort to identify prognosticators based on fetal imaging found that the mediolateral diameter of the straight or falcine sinus at its narrowest point (MD) (Fig 1B) was highly predictive of which neonates would have an aggressive early clinical course and require urgent embolizations after birth to control cardiopulmonary failure (ie, the neonatal at risk [NAR] cohort).7 This anatomic metric was sufficiently accurate to decide which fetuses are eligible for a clinical trial of in utero embolization for VOGM fetuses at high risk of brain injury or death.8
Another improvement would be the development of robust and reliable metrics of cerebral hemodynamics that could inform detailed planning of embolization therapy. Treatment planning is typically based on many factors,2 but methods for observing individual cerebral hemodynamics and responses to embolization would give great insight into the mechanisms of effective therapy.
4D flow MRI seems ideal for monitoring intracranial hemodynamics in VOGM. Accelerated 4D flow MRI provides sufficient resolution to accurately estimate flows through vessels in the circle of Willis as well as in draining venous structures.9⇓-11 Previous studies of a small number of patients with VOGM (n = 10, across 2 studies12,13) using 4D flow MRI have demonstrated complex hemodynamic changes with successive embolization procedures,12⇓-14 but work remains to develop these hemodynamic observations into useful prognosticators that might guide clinical management.
We observed intracranial blood flow dynamics using both 4D and 2D flow MRI to develop clinically useful flow-based indicators of risk and progression. We related our hemodynamic observations to MD to further support the clinical use of this biomarker, hypothesizing a strong correlation between flow and MD in the falcine sinus, and investigated several candidate metrics of parenchymal (ie, nonlesional) blood flow that could be developed into biomarkers of response to therapy.
MATERIALS AND METHODS
This prospective observational study was conducted with Boston Children’s Hospital institutional review board approval. From November 2021 to April 2023, all parents of children with VOGM who were referred to our hospital for evaluation and treatment of VOGM were approached to consent for 10−15 minutes of additional research scanning to be added at the end of their clinically indicated MRI studies. We have previously demonstrated that in the setting of VOGM, once parenchymal brain injuries begin to accrue there is a nearly inevitable cascading effect whereby further injuries continue to develop, leaving patients at high risk of severe neurocognitive impairment.15 Thus, any infant with parenchymal injury severe enough to impact flow would be under a palliative care paradigm and therefore systematically excluded from clinical and research imaging. Patients underwent MRI scans according to clinical need, and we added research imaging whenever feasible, as determined by researcher availability and scanner and patient schedules. This schedule meant that there was no research control over scan timing in relation to clinical events, because we collected data as opportunities presented themselves. During sedated scans to minimize motion, 4D flow imaging was attempted on 3T Magnetom Prisma and Magnetom Skyra scanners (Siemens, Erlangen, Germany) when the sequence was available.
Patients were classified as NAR on the basis of severe cardiopulmonary distress at birth necessitating intubation and embolization therapy in the first 14 days of life. This classification was in contrast to stable, non-NAR neonates, who were discharged home to await their first embolization treatment at around 6 months of age.
During the research portion of the scan, 4D and 2D flow imaging was collected. 4D flow MRI was used to measure hemodynamics in the circle of Willis, the varix, and the falcine sinus (TR = 82.6−92.8 ms, TE = 3–3.2 ms, resolution = 0 .8–1 mm isotropic, field-of-view = 220 mm, k-t GRAPPA R = 5, 5 cardiac phases). Single and dual encoding velocity (VENC) 4D flow imaging was used, depending on available imaging time with dual VENCs (low = 60−80 cm/s, high = 100−160 cm/s) and single VENCs = 150 cm/s. VENCs were adjusted from default low/high = 80/160 cm/s when scout imaging or prior conventional angiography was available. 2D flow imaging (2D phase-contrast MRI) was used to measure the flow in the superior sagittal sinus (SSS) upstream from its junction with the falcine sinus (with the SSS at this location representing parenchymal brain drainage rather than malformation drainage), a location typically outside the feasible 4D flow imaging slab due to scan time constraints (Fig 1A) (TR = 65.76 ms, TE = 5.02 ms, resolution = 0.8 × 0.8 × 4 mm3, field of view = 240 mm, VENC = 25−100 cm/s through-plane, 10 cardiac phases).
Individual vessel flows were quantified. 4D flow data were corrected for Maxwell terms during reconstruction and for eddy currents and velocity noise.16,17 Vessel-wise flows were then calculated in a semiautomated fashion using a Matlab-based tool (MathWorks Natick, Massachusetts).18 All automatic ROIs along the vessels were manually reviewed for quality, excluding individual cut planes where the vessel size was transiently >20% larger or smaller or was drawn on the incorrect adjacent vessel. SSS flows were quantified through manually-defined vessel ROIs drawn in Segment (Medviso, Lund, Sweden),19 correcting for eddy currents.
Individual vessel flows were combined in various ways to check the measurement quality and to investigate metrics of normal parenchymal inflow. Inflow conservation error, a previously developed data quality metric, was calculated as |QICA-QACA-QMCA-QPCOM|/QICA.11 There are various possible ways to quantify inflowing blood destined for parenchymal perfusion. In each metric, we looked for normalization after therapy and evidence of the increase in CBF during the first year of life. One metric would be nonshunting inflow, the difference between total inflow and falcine sinus flow. The quality of this metric would depend on the extent to which falcine flow represents shunt flow versus normal parenchymal drainage, but on the basis of the pathophysiology of VOGM, the expectation would be that falcine sinus flow would be overwhelmingly lesional. A previous study found that MCA and posterior cerebral artery (PCA) flows, in particular the PCA/MCA flow ratio, indicated improved parenchymal perfusion after embolization.12 The PCA/MCA flow ratio was calculated from the PCA and MCA vessel flows for each side. Inflow was the sum of ICA and basilar artery (BA) flow. MD was measured following the previously described protocol.7
We created regression models using the Python-based statsmodels library, including either a linear effect for MD or age at scanning, and fixed effects for embolization status and NAR classification, to test relationships between these variables and inflow, nonshunting inflow, PCA/MCA flow ratio, individual vessel flows, and the fourth root of falcine flow. The fourth root of flow was a plausible transform following the intuition of the Poiseuille Law for pipes of approximately circular cross-section, which states that flow is proportional to the fourth power of the radius.20 Model residuals were tested for normality using the Shapiro-Wilk test with a level of α =.05, and response variables were transformed and regressions were re-analyzed in cases in which normality was not achieved but there was an observed significant regression. P values < .05 were judged significant regressions. The analysis code can be found at https://github.com/dittothat/vogm_4dflow.
RESULTS
The recruitment and exclusion flow diagram for all subjects is shown in Fig 2. All approached families consented to scanning, but some subjects underwent their subsequent clinical scan on a scanner without the 4D flow sequence installed or at a time when research staff were unavailable. One subject underwent unsedated follow-up clinical scanning and was excluded from further analysis, given the known effects of sedation on CBF precluding comparison with prior sedated scans.21,22 Age and relevant clinical history of the subjects who underwent 4D flow imaging (n =11) are given in the Table.

Flow diagram of subjects in this study.
| Subject | Age at First Scan (weeks) | History at Time of First Scan | Neonatal at Risk | No. of Scans |
|---|---|---|---|---|
| 1 | 61.2 | S/p angiogram (no embolization) | 0 | 1 |
| 2 | 23.8 | No previous interventions | 0 | 3 |
| 3 | 11.1 | S/p embolization 1 day previously | 0 | 2 |
| 4 | 24.0 | S/p embolization same day | 0 | 1 |
| 5 | 16.9 | S/p embolization same day | 0 | 1 |
| 6 | 0.1 | No interventions, later deceased | 1 | 1 |
| 7 | 0.9 | S/p embolization 2 days previously | 1 | 1 |
| 8 | 20.9 | No interventions, coarctation of the aorta | 0 | 1 |
| 9 | 19.4 | No previous interventions | 0 | 1 |
| 10 | 36.7 | No previous interventions | 0 | 1 |
| 11 | 26.7 | No previous interventions | 0 | 2 |
| Avg = 22 | n = 2 | n = 15 |
Note:—Avg indicates average; S/p, status post.
Subjects who underwent sedated 4D flow MRI
All 15 MRI flow measurements are provided in the Online Supplemental Data. SSS measurements were not obtained for subjects 2, 4, and 11 due to scanner schedule constraints. PCA measurements for subject 3 were not possible using the automatic vessel segmentation algorithm. The right anterior cerebral artery (ACA) for subject 8 was too small to resolve. The Online Supplemental Data contain the significant regression model fit results, and the results from all tested models.
Inflow Vessels
Inflow results are summarized in Fig 3. Data quality was generally acceptable, with an average inflow conservation error of 24% (Online Supplemental Data). Total inflows were high, with no correlation to age (Fig 3A).23,24 In the 3 patients with serial observations, inflow always decreased after embolization. The high subject-wise variance in inflow masked the effect of embolization across the entire cohort (Online Supplemental Data).

Quantitative inflow results from 4D flow MRI with pre-embolization open markers, postembolization closed markers, and subsequent measurements connected by dotted lines. Labels indicate subject number. A, Total inflow through the ICA and BA versus age, with the normal range of blood flow in this age range indicated by the gray shading.22,23 B, Nonshunting inflow (inflow-falcine flow) versus age with no significant correlation. C and D, MCA and PCA flow versus age, with no significant correlation. Right side shown with circles, and left side shown with triangles. E and F, The PCA/MCA ratio versus age at scanning was significantly correlated on both the left (P = .015) and the right (P = .038).
We did not observe a significant correlation between nonshunting inflow and age at scanning or a consistent change after embolization (Fig 3B). The decrease for subject 3 happened to correspond to a marked increase in flow conservation error, which hampers interpretation.
We did not observe significant correlations between age and PCA or MCA flows (Fig 3C, -D), though there was a significant negative correlation between the PCA/MCA flow ratio and age at scanning (Fig 3E, -F). In addition and clearly recognizing that our sample size was very small with serial results only for n = 2 subjects, we did not observe any significant trends between the PCA/MCA flow ratio and the time after embolization nor a resolution to the previously observed normal value of 0.55.12
Outflow Vessels
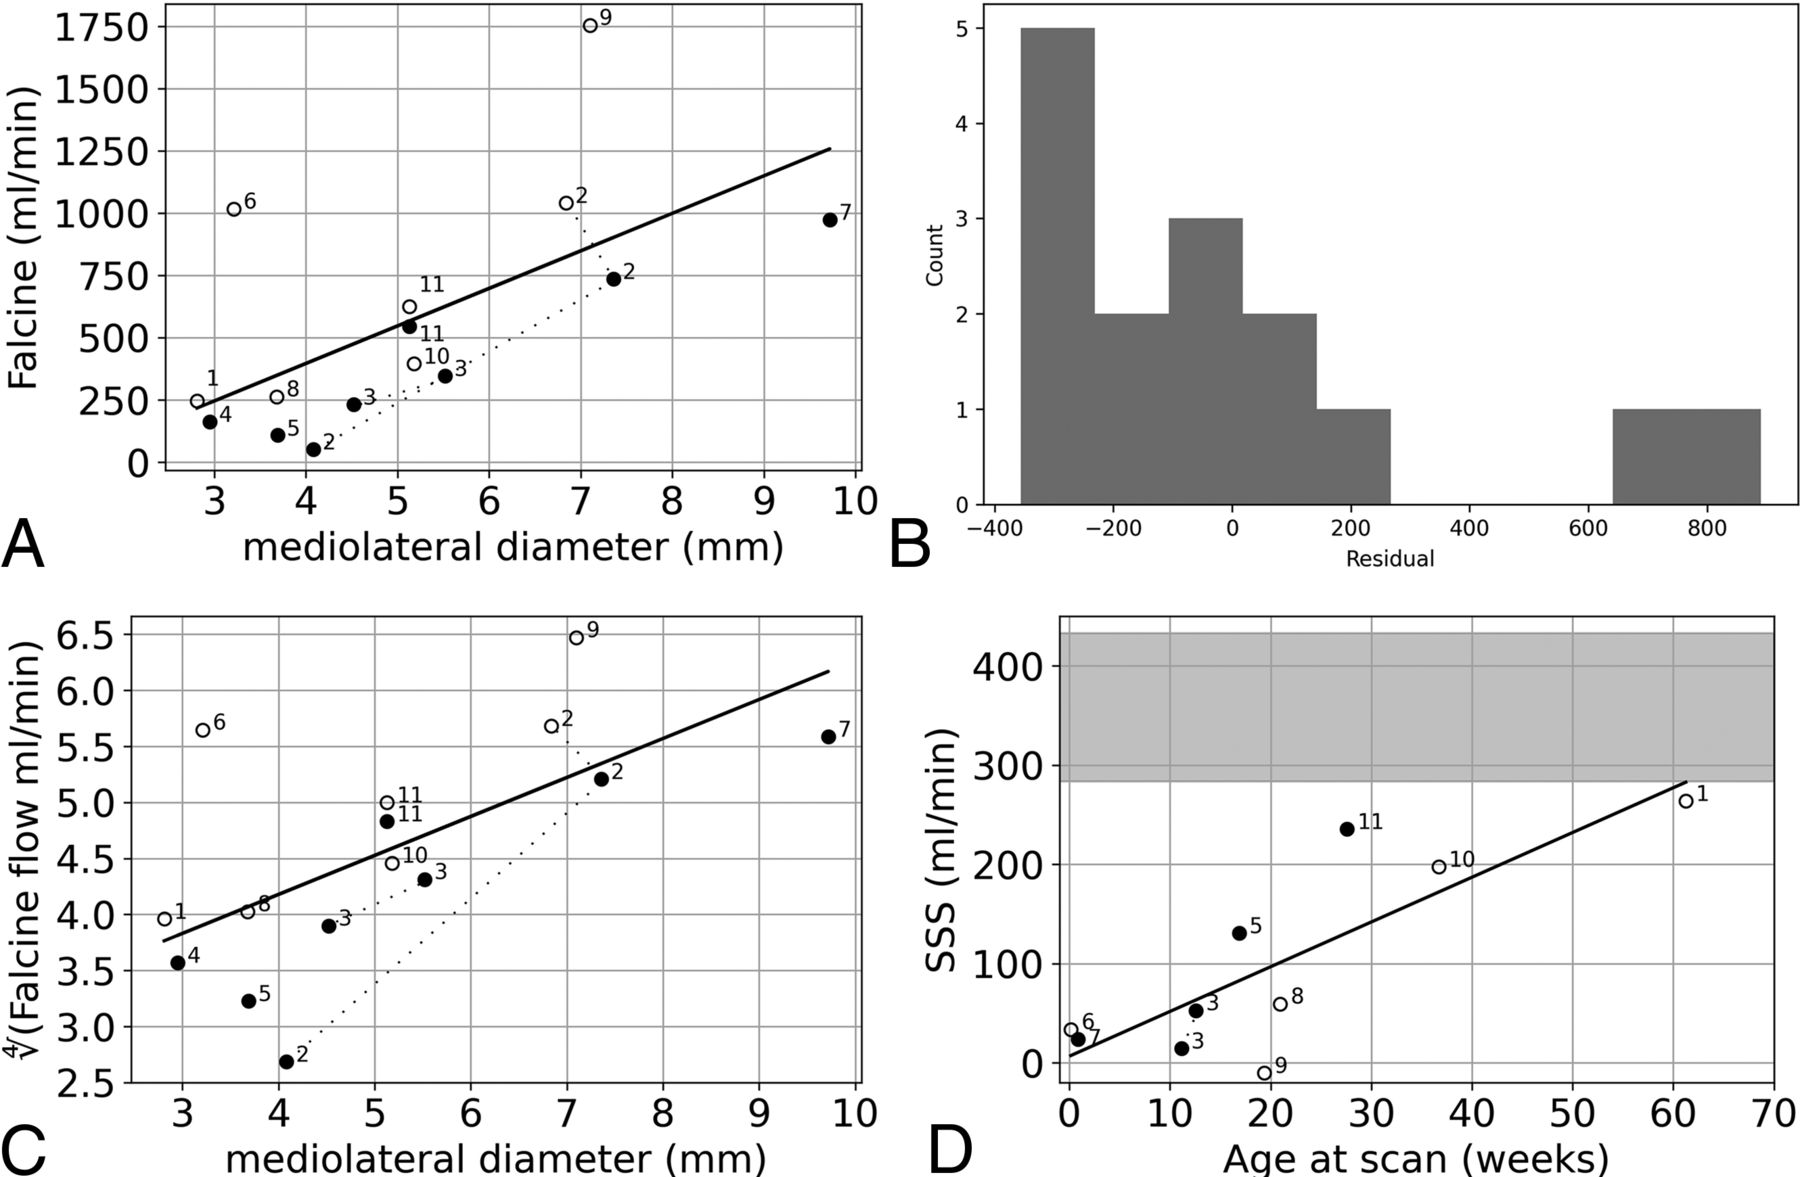
Outflow results are summarized in Fig 4. Falcine sinus flow demonstrated a significant relationship with the modeled linear effect of MD (Fig 4A), but the higher flow observations for subjects 6 and 8 meant that the model residuals were not normally distributed (Fig 4B). The modeled linear relationship between the fourth root of falcine sinus and MD was both significantly correlated and yielded residuals that were normally distributed (Fig 4C). Furthermore, after subsequent embolization procedures, subjects 2 and 3 appeared to have a flow to MD ratio that remained approximately constant, matching the observed cohort trend (Fig 4A).

Quantitative outflow results from 4D flow MRI for the falcine sinus and 2D flow MRI for the SSS. A, Falcine sinus flow versus MD was significantly correlated (slope, 151; 95% CI, 37–264; P = .013). B, The histogram of the residuals of the model of falcine sinus flow versus MD is not normally distributed (Shapiro-Wilk, W = 0.79, P = .003). C, The fourth root of falcine sinus flow versus MD was significantly correlated with MD (P = .009). D, 2D flow MRI results from the SSS prefalcine inflow were correlated with age at scanning (slope, 4.51; 95% CI, 1.92–7.10; P = .004), with the normal range of SSS blood flow from 29 to 60 weeks indicated by the gray shading.25
The final metric we considered related to parenchymal perfusion was SSS flow. There was a significant correlation between prefalcine SSS flow and age, though all SSS flows were lower than what would be expected in this age range (Fig 4D).25 Subject 9 had an average retrograde SSS flow.
DISCUSSION
New MRI tools for flow quantification permit detailed observations of intracranial hemodynamics in VOGM. 4D flow MRI is a powerful technique for the simultaneous quantification of inflow and outflow vessels. We collected 4D flow data from 11 patients (previously only 2 studies of 10 patients total have presented 4D flow observations of patients with this disease and only 5 were as young as our cohort), observing high brain blood inflow and a strong correlation between the fourth root of falcine sinus flow and MD, the previously described biomarker for NAR.7 Additionally, we explored metrics of parenchymal venous outflow, finding that SSS flow anterior to the falcine sinus junction had a significant correlation with age, as expected.
High brain blood inflow has been previously observed in patients with VOGM and reflects shunt flow. Quantitative inflow results have been published only for a total of 5 patients in the age range of our cohort (300−1800 mL/min),12,13 with results similar to our observed range (570−2050 mL/min). The average inflow reduction of 40% from baseline to end point embolization was observed in a previous study,12 and subject 2 in our study had a 54% reduction of inflow (Fig 3A).
The observed strong correlation between the fourth root of falcine flow and MD (Fig 1B) supports the use of MD as a structural biomarker of pathologic flow in the VOGM. Prior literature investigated only pretreatment MD and the likelihood of needing urgent neonatal treatment, which was related to a more aggressive early clinical course that was assumed to be related to a greater lesional flow in these cases,7 whereas flow observations can establish the link among the structure, pathophysiology, and clinical presentation. Our study has proved that falcine sinus flow is related to MD, even in the postnatal and the posttreatment settings, based on the significant relationships between flow and MD even when controlling for embolization status (Online Supplemental Data). Some subjects exhibited falcine sinus flow much higher than the modeled trend for flow versus MD (ie, subjects 6 and 9). We contend that these subjects demonstrate the large range of intracranial hemodynamics in VOGM and that more observations are needed to understand the nuances in the flow-morphology relationship for this lesion. This relationship is complex, because the craniocaudal diameter of the falcine sinus tends to be fixed, so a smaller MD is an elliptical cylinder and a larger MD approaches a circular cylinder. This description is different from comparing flow through cylinders of different radii, for which the Poiseuille law would completely explain the proportionality. Longitudinal measurements (subjects 2 and 3) after subsequent embolizations corroborate a sustained relationship.
We sought a marker of the blood flow supplying parenchymal perfusion—that is, the nonarteriovenous shunt flow. Relying on the knowledge that CBF increases dramatically in the first year of life,23,24 we looked for correlations between our candidate metrics and age and also the expected normalization after embolization. We did not find these expected characteristics for nonshunting inflow, the inflow–falcine flow difference. This result was puzzling but may be due to the strong relationship between inflow and falcine flow. Embolizations aim to increase the resistance of the shunt flow path, and this change causes both a reduction in inflow and, presumably, flow redistribution in the various normal drainage pathways of the brain, including through the internal cerebral veins, the falcine sinus, and the SSS. Indeed, normal drainage through the internal cerebral veins is a known risk factor for hemorrhage after endovascular treatment.26 This complex interaction between inflow and flow through the falcine sinus varies for each subject and at each time point. Indeed, approximating the nonshunting inflow metric from a past study suggests no clear trends were revealed there either.12 Thus, we reject nonshunting inflow as a useful metric reflecting parenchymal perfusion.
In 2 subjects with serial embolizations, we did not observe a normalization in the PCA/MCA ratio as was previously observed,12 but the ratio did decrease with age (Online Supplemental Data and Fig 3E, -F). The arterial flow to normal brain may be altered via the arterial steal phenomenon or may not match age-expected levels if brain injury occurs from the VOGM. Normalization of arterial brain inflow may occur for a variable extended timeframe after exclusion of lesional flow by embolization, and if so, it would not be reflected in our acute posttreatment imaging. SSS flow, anterior to the junction with the falcine sinus, showed a significant correlation with age (Fig 4D). Our subjects all have lower SSS flow than the reference range (from limited previous observations25), and we hypothesize that this may reflect some degree of pressurization of the entire SSS by dint of the arterialized shunt inflow. Subject 3 did have higher SSS flow after embolization, but the final flow was still much lower than expected, and, in general, we did not observe a pronounced resolution after embolization.
This study had several limitations. The research scan time allowed under general anesthesia, <15 minutes, impacted obtainable image resolution and coverage. Ideally, we would position a thicker slab that would include the SSS locations we targeted with 2D flow MRI, but this was often out of reach within our designated scan time. The specific implementation of 4D flow MRI used in this study has been previously validated at another institution using flow phantoms.11 Our average inflow conservation error of 24% is in line with an expected flow conservation error when <3 voxels span the vessel lumen,11 which is often the case for the ACA, MCA, and PCA vessels in our subjects. As we continue to collect data from more subjects, we will have the opportunity to set a rejection threshold on the basis of this inflow conservation quality metric. Additionally, more subjects would support an investigation of nonlinear relationships among flow, morphology, and clinical parameters. Previous work classified NAR in two-thirds of the imaging cohort, consistent with previous reports,7 so our sample is likely not representative of the full pathophysiologic variety of the VOGM.
A larger, longer study of flow normalization is warranted. We obtained follow-up measurements for only 3 subjects, and only 2 had baseline, pretreatment measurements. Our maximum follow-up duration was <8 months. Finally, more studies of CBF in neonates are needed to establish reference ranges for this early period of development.23⇓-25 While several documented factors affect flow quantification accuracy,11,24 we contend that 4D flow MRI would be ideal for the goal of establishing reference ranges of inflow and outflow vessels at young ages. However, it is known that anesthesia and sedation drive CBF to be lower on average, though individual response varies (−50% to +20%).21,22 It will be challenging to collect control flow values in healthy children for anesthesia and sedation states that match our patient cohort.
The next steps toward the development of hemodynamic metrics to guide prognosis and embolization therapy include exploring the flow and pressure relationships in the draining veins and collecting more observations from patients who are NAR. Additionally, the demonstration of a consistent relationship between flow and MD supports the measurement of MD to follow the physiologic status of patients who are not near advanced MR centers.
CONCLUSIONS
The observed correlation between falcine sinus flow and morphology and the exploration of metrics of parenchymal flow finding SSS flow as significantly correlated with age suggest the importance of venous outflow quantification to the pathophysiology of VOGM. The simultaneous observation of flow across multiple vessels demonstrates the utility of 4D flow MRI for prognostication and guidance of therapy for patients with VOGM.
Acknowledgments
We thank to Maria Aristova for providing the software tools and training to process the images that were collected using the 4D flow sequence provided by Susanne Schnell.
Footnotes
Funding for this study was from the Sage Schermerhorn Chair in Image-Guided Therapy.
Disclosure forms provided by the authors are available with the full text and PDF of this article at www.ajnr.org.
References
- Received March 4, 2024.
- Accepted after revision May 17, 2024.
- © 2024 by American Journal of Neuroradiology


Jump to section
Related Articles
Cited By...
- No citing articles found.